
- The iM-Best12(USMV)-Trader periodically invests in the 12 highest ranked stocks of USMV which currently holds 208 large-cap stocks.
- This strategy, postulated in 2014, has produced from the end of Jun-2014 to end of Feb-2018 an annualized return of 16.1% versus 11.9% for USMV, and 11.5% for SPY.
- We have now changed the trading rules and ranking system which we believe will provide improved returns with low turnover in the future.
In this 2014 article we showed that better returns than those from the ETF could be obtained by applying a ranking system to the stock holding of USMV (the universe), and investing periodically only in the 12 highest ranked stocks, bought and sold according to certain rules.
For the live model all rules remained the same as for the original simulation, except that the model’s universe was periodically updated with the stock holding of USMV.
The model assumes an initial investment of $100,000 and runs on the on-line platform Portfolio 123. Trading costs, including slippage was taken as 0.10% of the trade amounts.
Performance
The iM-Best12(USMV)-Trader is now 3.75 years old, and since Sep-2014 we have published trade signals, holdings and performance on our website iMarketSignals.com. The most recent performance to Feb-28-2018 is shown in Figure-1.
In the figure the red graph represents the performance of the Trader and the blue graph shows the performance of the benchmark, the SPDR S&P 500 ETF (SPY).
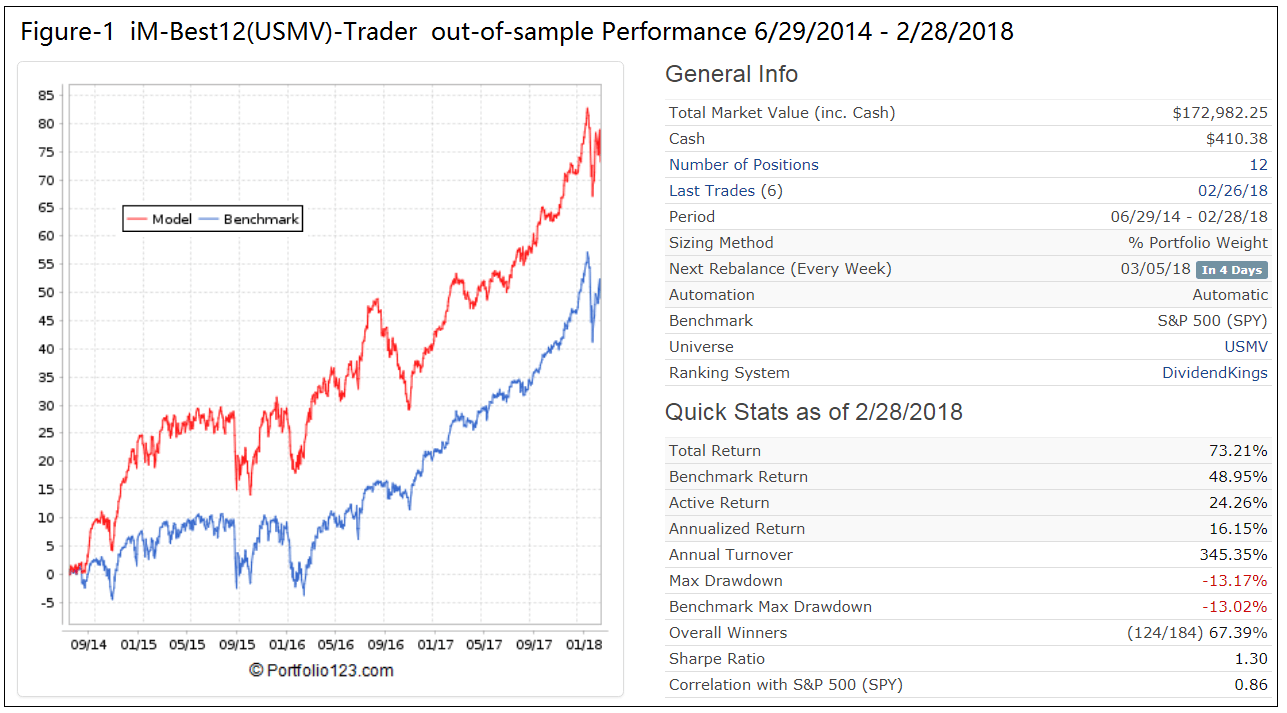
The table below shows the annualized returns for USMV, SPY, and the Trader.
| Value 6/29/2014 |
Value 2/28/2018 |
Annualized Return |
|
| USMV | 100.00 | 150.85 | 11.9% |
| SPY | 100.00 | 148.95 | 11.5% |
| iM-Best12(USMV)-Trader | 100.00 | 173.21 | 16.1% |
Simulated Performance with new Rules and Ranking System
At iMarketSignals we strive to improve our models, if possible.
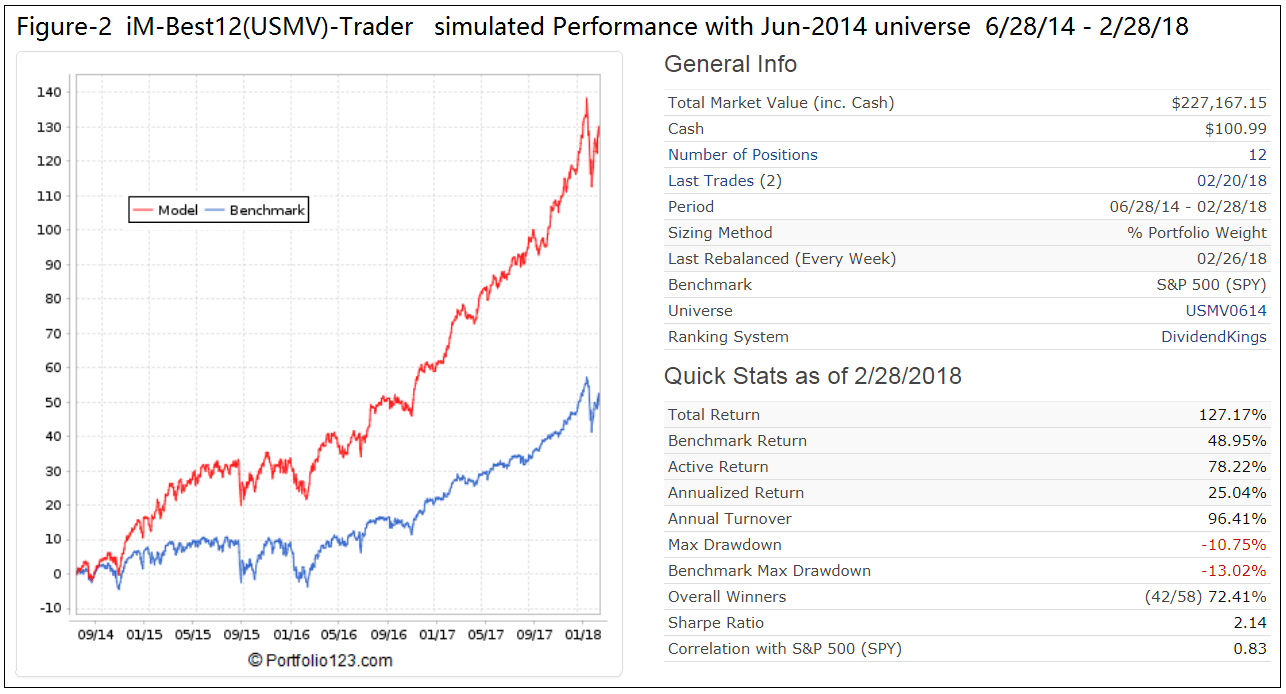
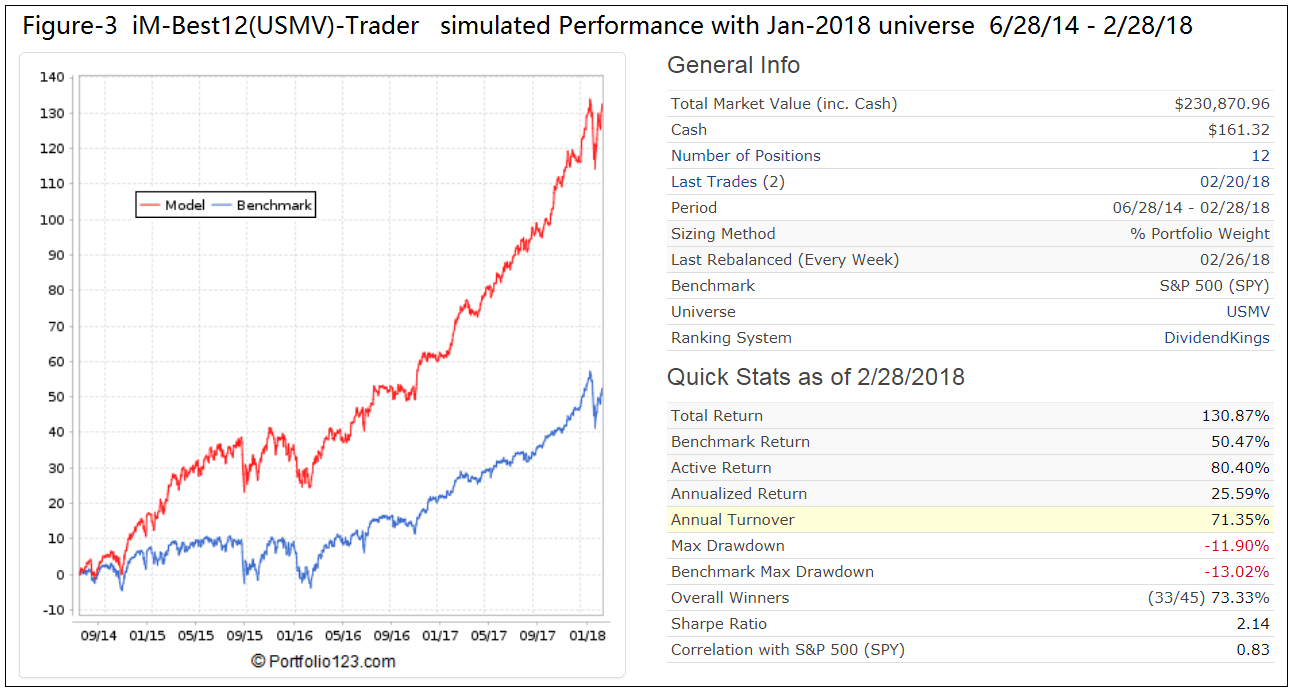
Figure-2 and Figure-3 are taken from Portfolio 123 and give simulated performance statistics from 6/28/2014 to 2/28/2018 using the USMV universes from Jun-2014 and Jan-2018, respectively. Both simulations show similar characteristics because USMV has a low turnover of about 24%, holdings do not change much over time.
The improvements are:
- The simulated annualized return is approximately 25%, a great improvement over the actual 16.1 % return achieved so far.
- The annual turnover is now about 80%-90% versus 350% for the original model. Fewer trades provide better returns.
- The performance curve is a lot smoother, and Sharpe Ratio is about 2.1 versus 1.3 for the original model.
Conclusion
Only investing periodically in the 12 highest ranked stocks of USMV has produced much better returns over the last 3.75 years than the ETF itself. Using a new ranking system to rank the stock holdings of USMV and new trading rules should provide better returns in the future.
Following the Models
At our website iM imarketsignals.com one can follow the weekly performance update of the iM-Best12(USMV)-Trader.
Disclaimer
The performance data shown represent past performance, which is not a guarantee of future results. Investment returns and portfolio value will fluctuate, so stocks when sold may be worth more or less than their original cost. Future performance may be lower or higher than the performance data cited.
Anton,
Can you ballpark a tax adjusted return if in a taxable account?
Thank You,
Mark