  |
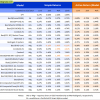
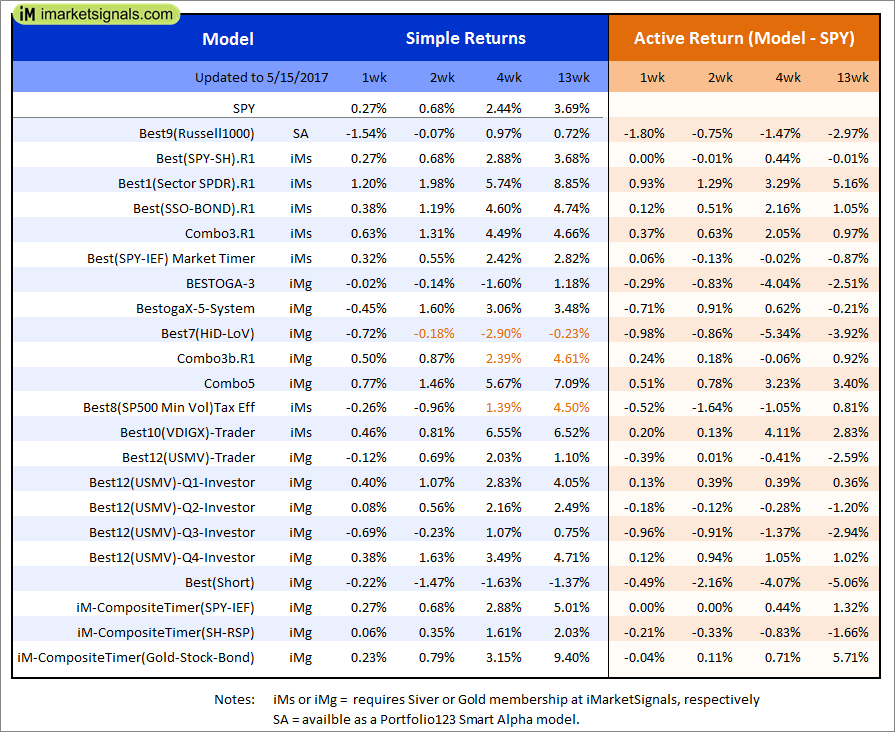
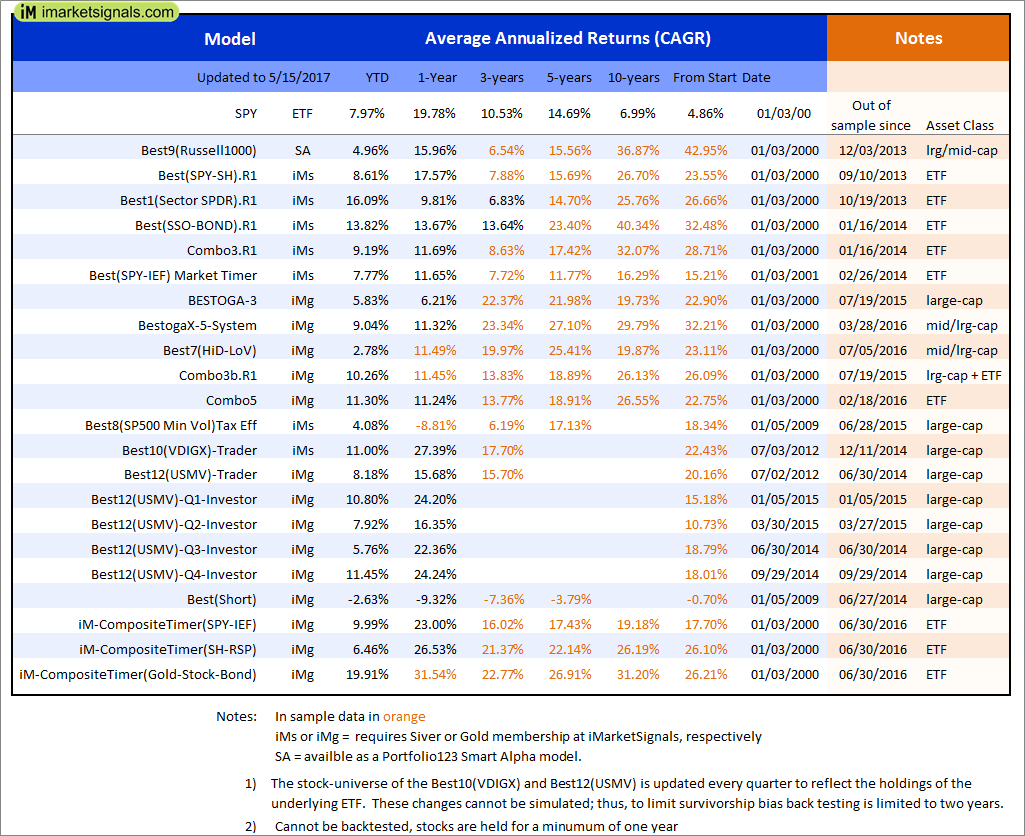
Out of sample performance summary of our models for the past 1, 2, 4 and 13 week periods. The active active return indicates how the models over- or underperformed the benchmark ETF SPY. Also the YTD, and the 1-, 3-, 5- and 10-year annualized returns are shown in the second table |
|
|
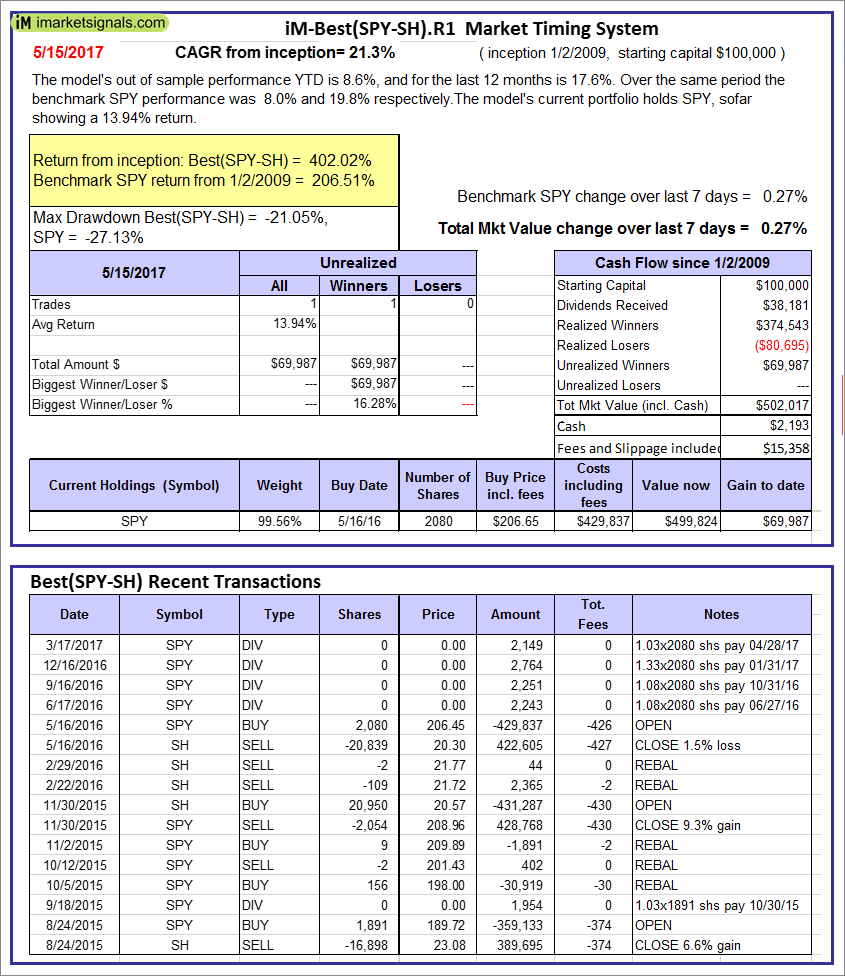
iM-Best(SPY-SH).R1: The model’s out of sample performance YTD is 8.6%, and for the last 12 months is 17.6%. Over the same period the benchmark SPY performance was 8.0% and 19.8% respectively. Over the previous week the market value of Best(SPY-SH) gained 0.27% at a time when SPY gained 0.27%. A starting capital of $100,000 at inception on 1/2/2009 would have grown to $502,017 which includes $2,193 cash and excludes $15,358 spent on fees and slippage. |
|
|
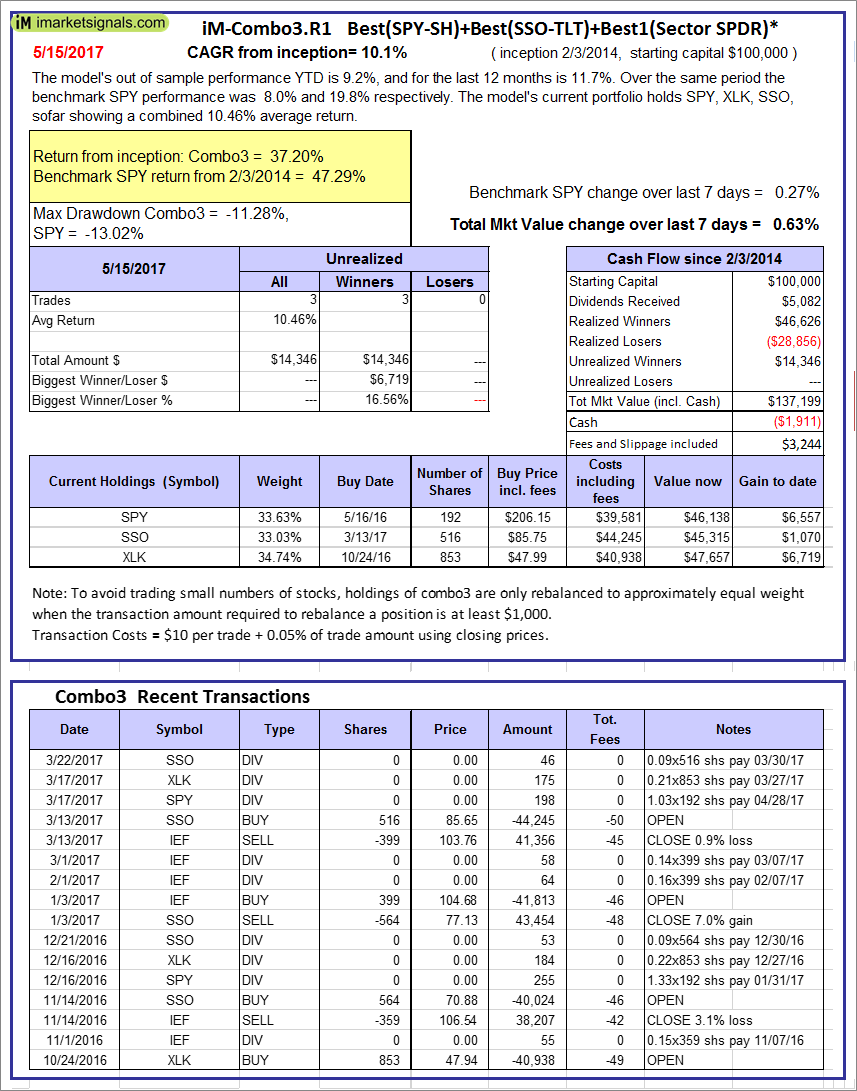
iM-Combo3.R1: The model’s out of sample performance YTD is 9.2%, and for the last 12 months is 11.7%. Over the same period the benchmark SPY performance was 8.0% and 19.8% respectively. Over the previous week the market value of iM-Combo3.R1 gained 0.63% at a time when SPY gained 0.27%. A starting capital of $100,000 at inception on 2/3/2014 would have grown to $137,199 which includes -$1,911 cash and excludes $3,244 spent on fees and slippage. |
|
|
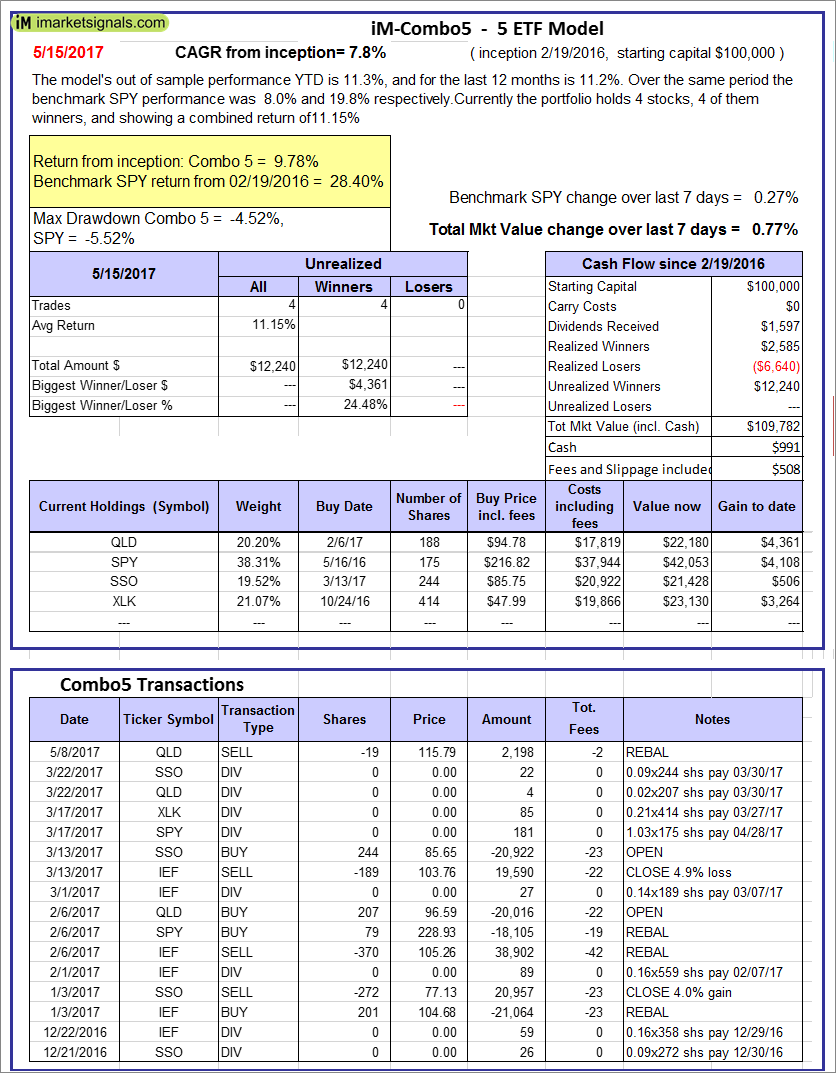
iM-Combo5: The model’s out of sample performance YTD is 11.3%, and for the last 12 months is 11.2%. Over the same period the benchmark SPY performance was 8.0% and 19.8% respectively. Over the previous week the market value of iM-Combo5 gained 0.77% at a time when SPY gained 0.27%. A starting capital of $100,000 at inception on 2/22/2016 would have grown to $109,782 which includes $991 cash and excludes $508 spent on fees and slippage. |
|
|
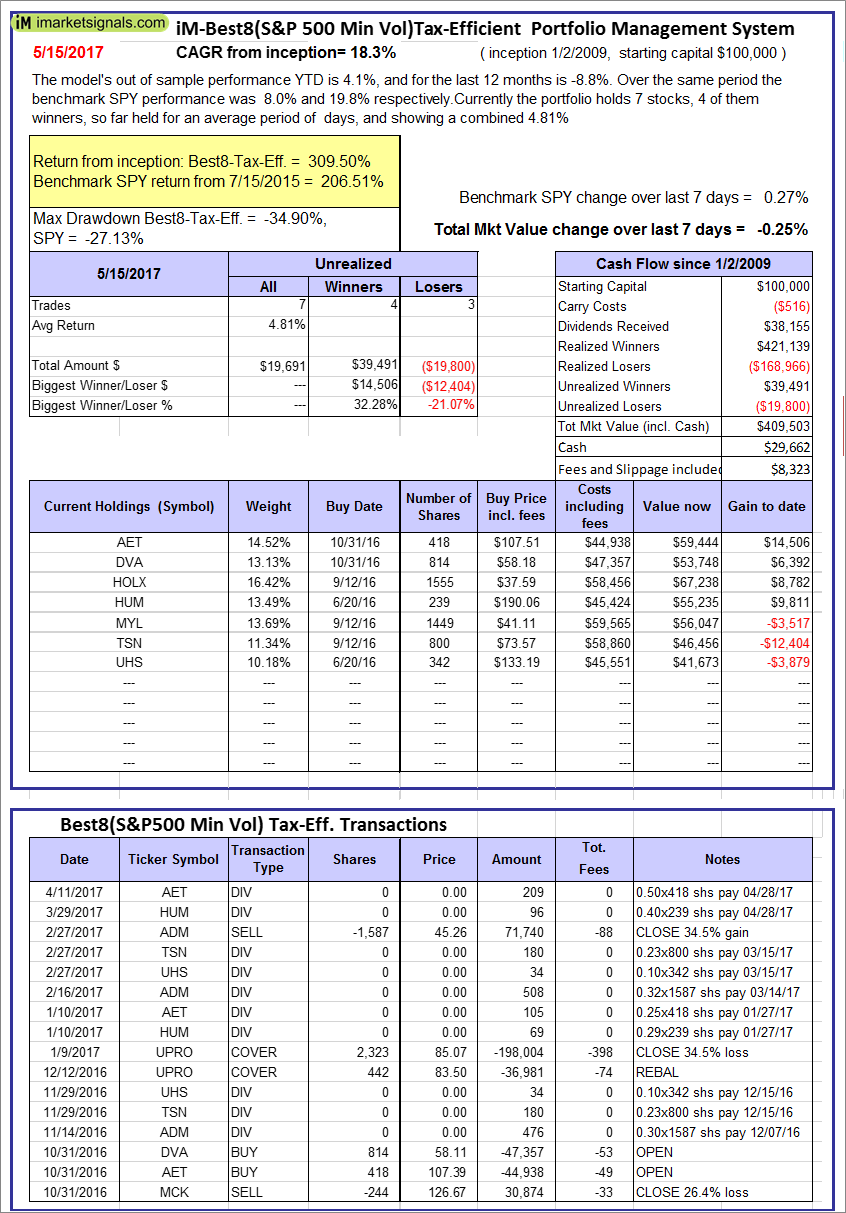
The iM-Best8(S&P500 Min Vol)Tax-Efficient The model’s out of sample performance YTD is 4.1%, and for the last 12 months is -8.8%. Over the same period the benchmark SPY performance was 8.0% and 19.8% respectively. Over the previous week the market value of iM-Best8(S&P 500)Tax-Eff. gained -0.25% at a time when SPY gained 0.27%. A starting capital of $100,000 at inception on 1/2/2009 would have grown to $409,503 which includes $29,662 cash and excludes $8,323 spent on fees and slippage. |
|
|
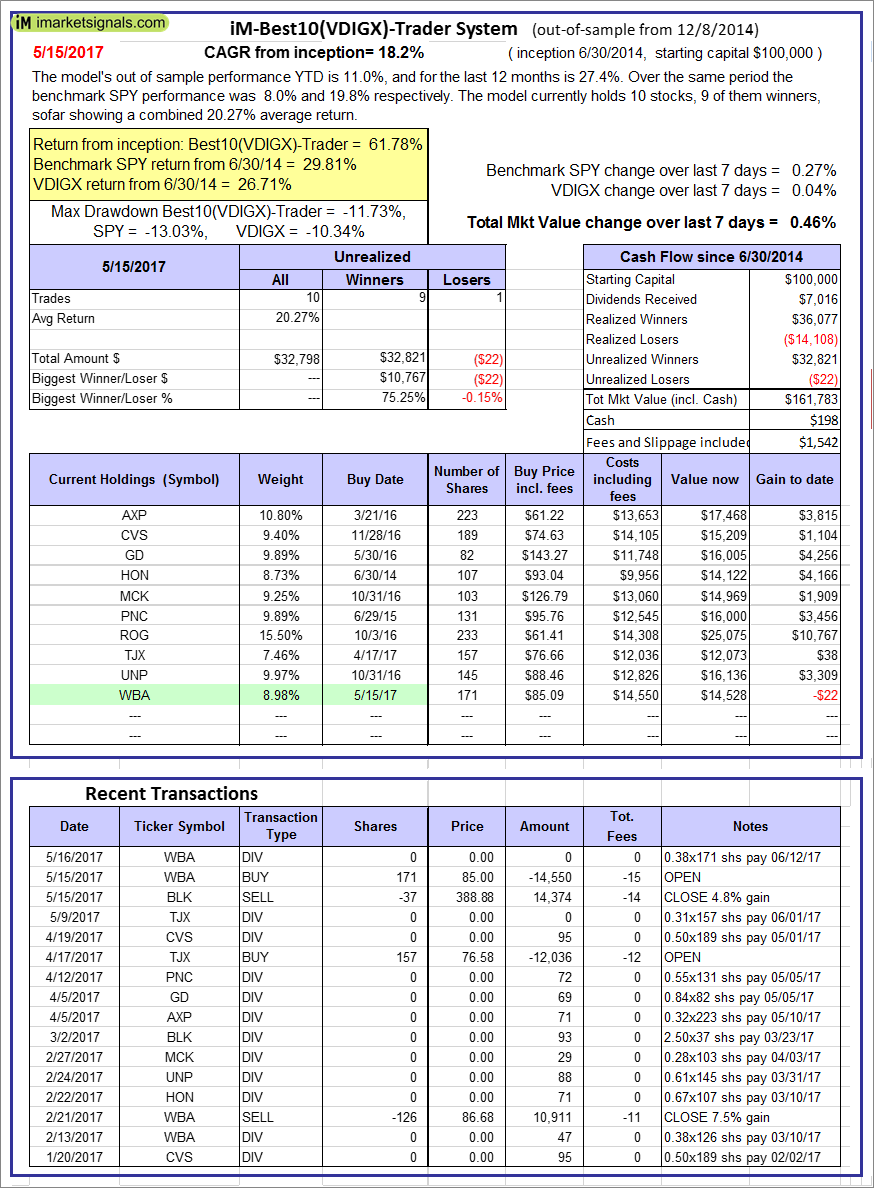
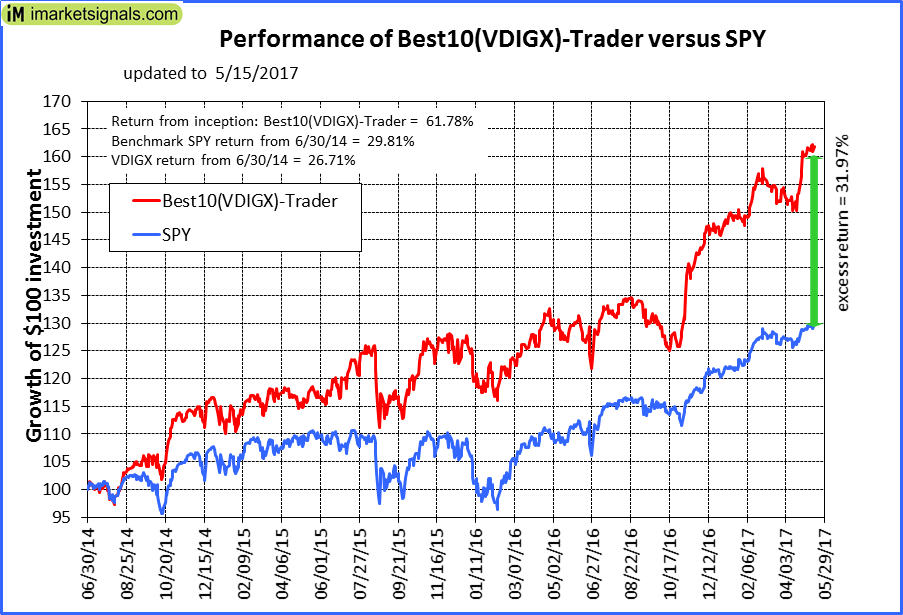
iM-Best10(VDIGX)-Trader: The model’s out of sample performance YTD is 11.0%, and for the last 12 months is 27.4%. Over the same period the benchmark SPY performance was 8.0% and 19.8% respectively. Since inception, on 7/1/2014, the model gained 61.78% while the benchmark SPY gained 29.81% and VDIGX gained 26.71% over the same period. Over the previous week the market value of iM-Best10(VDIGX) gained 0.46% at a time when SPY gained 0.27%. A starting capital of $100,000 at inception on 7/1/2014 would have grown to $161,783 which includes $198 cash and excludes $1,542 spent on fees and slippage. |
|
|
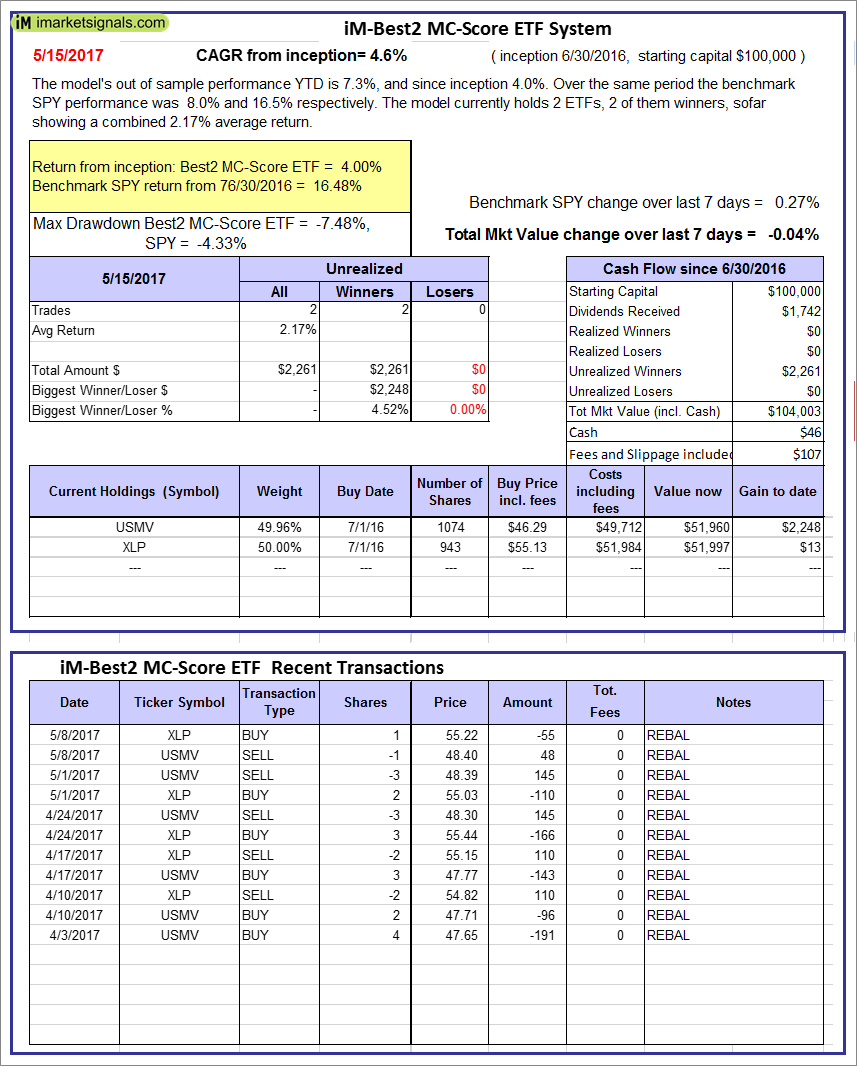
iM-Best2 MC-Score ETF System: The model’s out of sample performance YTD is 7.3%, and since inception 4.0%. Over the same period the benchmark SPY performance was 8.0% and 16.5% respectively. Over the previous week the market value of iM-BESTOGA-3 gained -0.04% at a time when SPY gained 0.27%. A starting capital of $100,000 at inception on 6/30/2016 would have grown to $46 which includes $107 cash and excludes Gain to date spent on fees and slippage. |
|
|
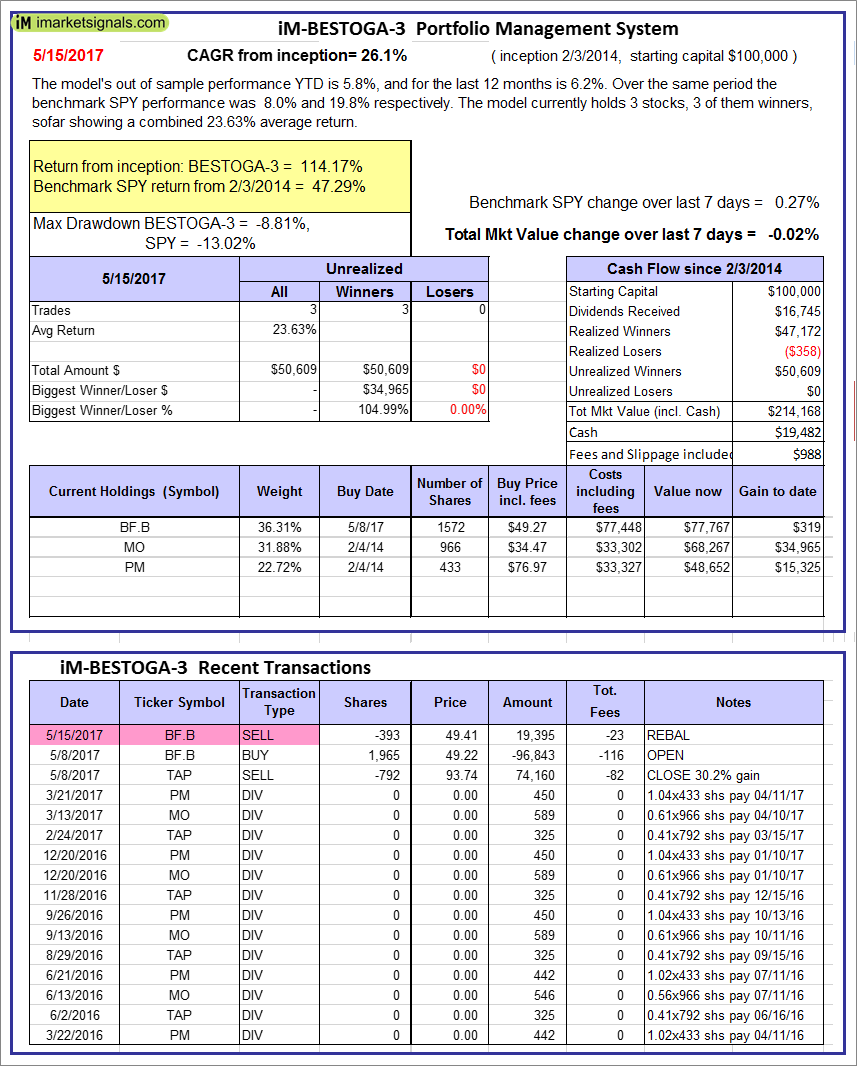
iM-BESTOGA-3: The model’s out of sample performance YTD is 5.8%, and for the last 12 months is 6.2%. Over the same period the benchmark SPY performance was 8.0% and 19.8% respectively. Over the previous week the market value of iM-BESTOGA-3 gained -0.02% at a time when SPY gained 0.27%. A starting capital of $100,000 at inception on 2/3/2014 would have grown to $214,168 which includes $19,482 cash and excludes $988 spent on fees and slippage. |
|
|
iM-Best7(HiD-LoV): The model’s out of sample performance YTD is 2.8%, and since inception 5.6%. Over the same period the benchmark SPY performance was 8.0% and 16.5% respectively. Over the previous week the market value of iM-BESTOGA-3 gained -0.72% at a time when SPY gained 0.27%. A starting capital of $100,000 at inception on 6/30/2016 would have grown to $105,607 which includes $84 cash and excludes $785 spent on fees and slippage. |
|
|
iM-BestogaX5-System: The model’s out of sample performance YTD is 9.0%, and for the last 12 months is 11.3%. Over the same period the benchmark SPY performance was 8.0% and 19.8% respectively. Over the previous week the market value of iM-Best8(S&P 500)Tax-Eff. gained -0.45% at a time when SPY gained 0.27%. A starting capital of $100,000 at inception on 3/28/2016 would have grown to $107,464 which includes $1,607 cash and excludes $662 spent on fees and slippage. |
|
|
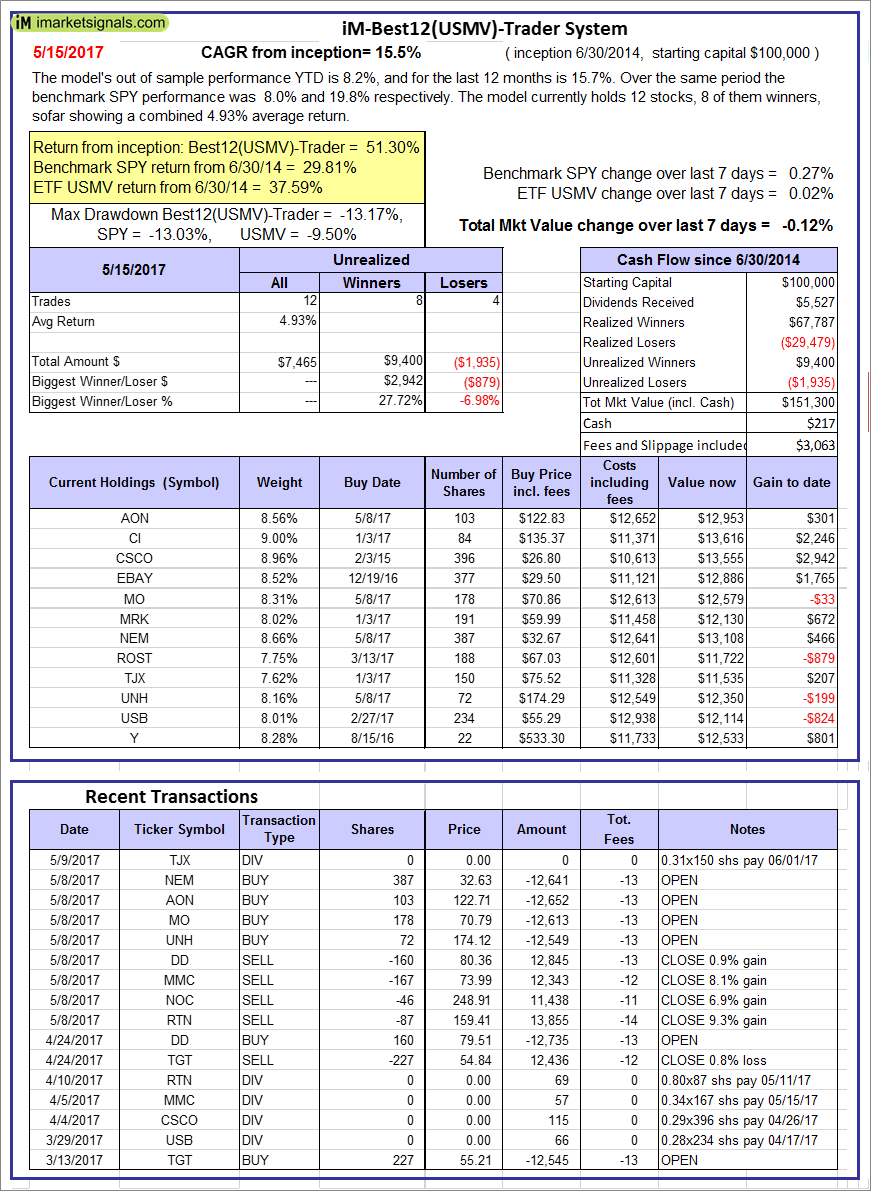
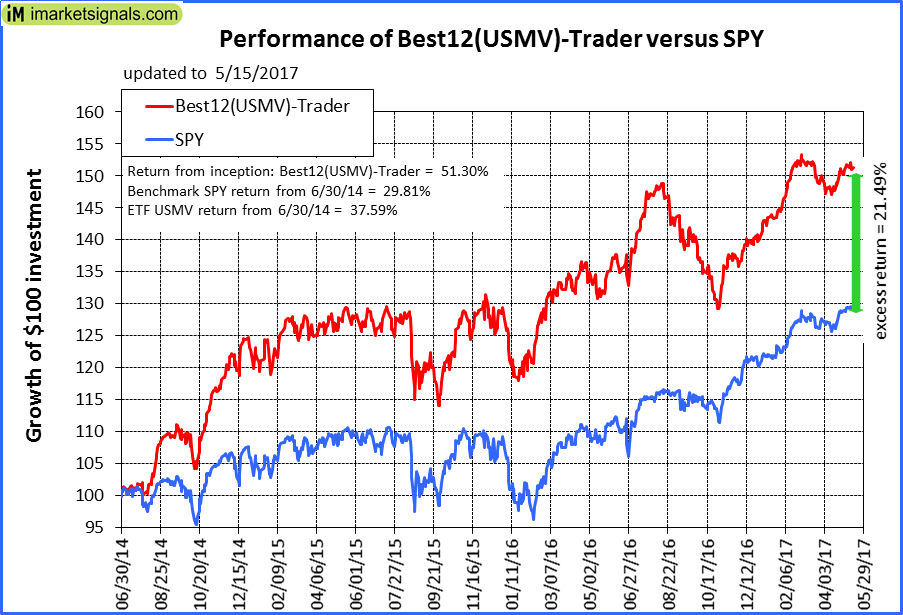
iM-Best12(USMV)-Trader: The model’s out of sample performance YTD is 8.2%, and for the last 12 months is 15.7%. Over the same period the benchmark SPY performance was 8.0% and 19.8% respectively. Since inception, on 7/1/2014, the model gained 51.30% while the benchmark SPY gained 29.81% and the ETF USMV gained 37.59% over the same period. Over the previous week the market value of iM-Best12(USMV)-Trader gained -0.12% at a time when SPY gained 0.27%. A starting capital of $100,000 at inception on 7/1/2014 would have grown to $151,300 which includes $217 cash and excludes $3,063 spent on fees and slippage. |
|
|
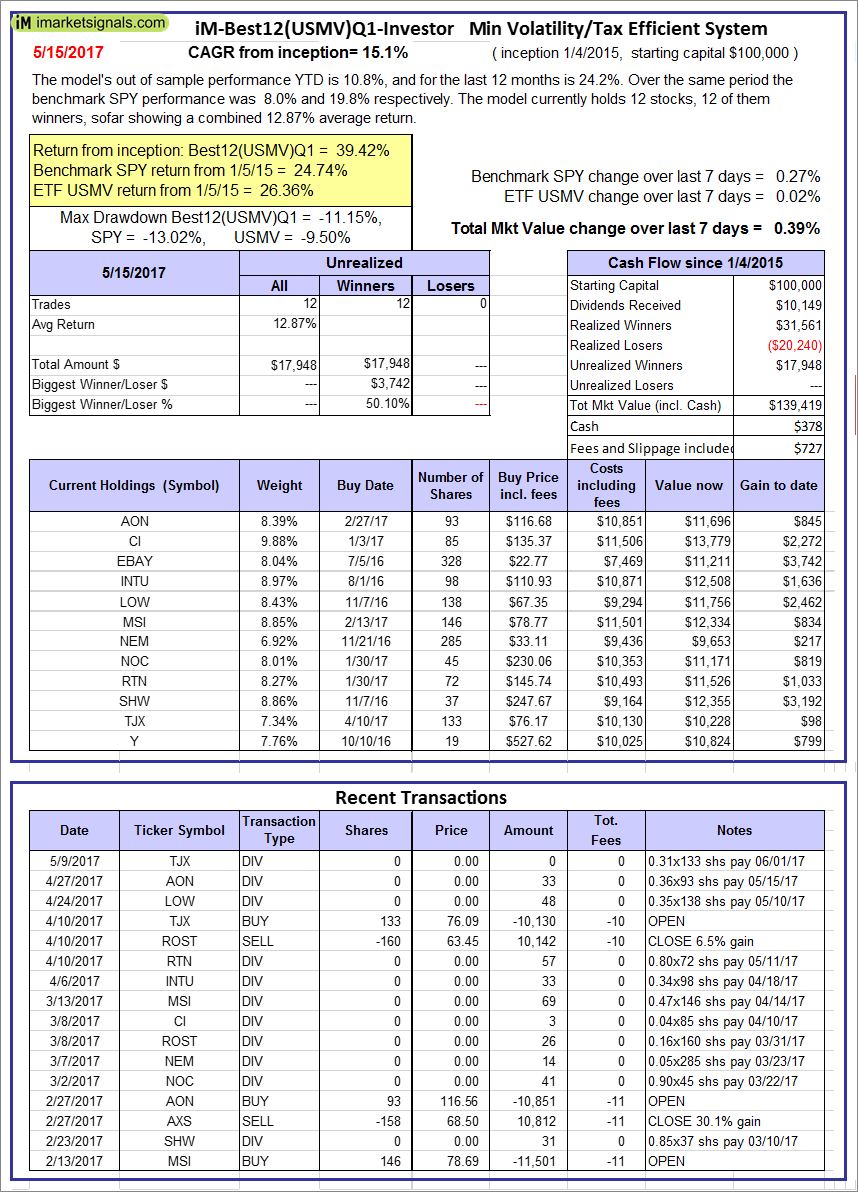
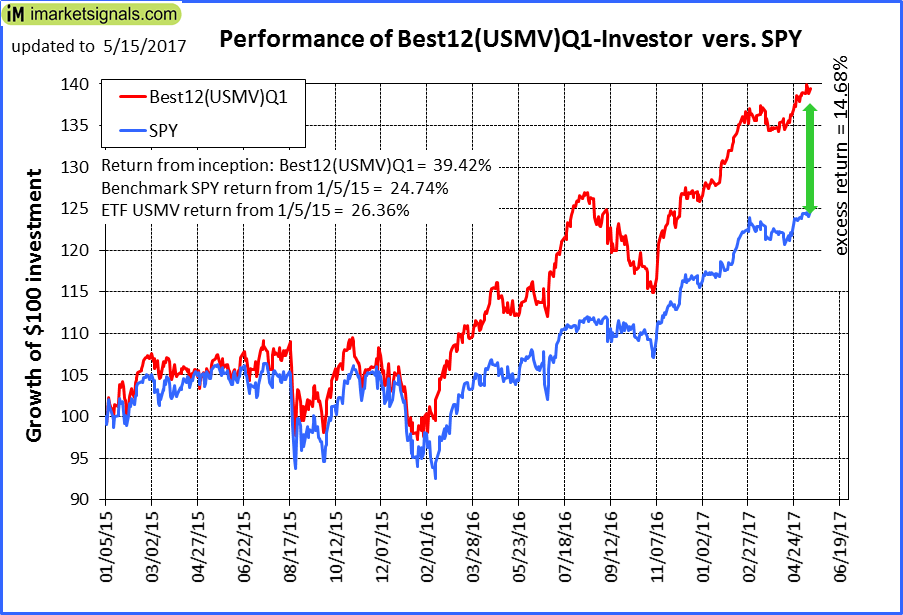
iM-Best12(USMV)Q1-Investor: The model’s out of sample performance YTD is 10.8%, and for the last 12 months is 24.2%. Over the same period the benchmark SPY performance was 8.0% and 19.8% respectively. Since inception, on 1/5/2015, the model gained 39.42% while the benchmark SPY gained 24.74% and the ETF USMV gained 26.36% over the same period. Over the previous week the market value of iM-Best12(USMV)Q1 gained 0.39% at a time when SPY gained 0.27%. A starting capital of $100,000 at inception on 1/5/2015 would have grown to $139,419 which includes $378 cash and excludes $727 spent on fees and slippage. |
|
|
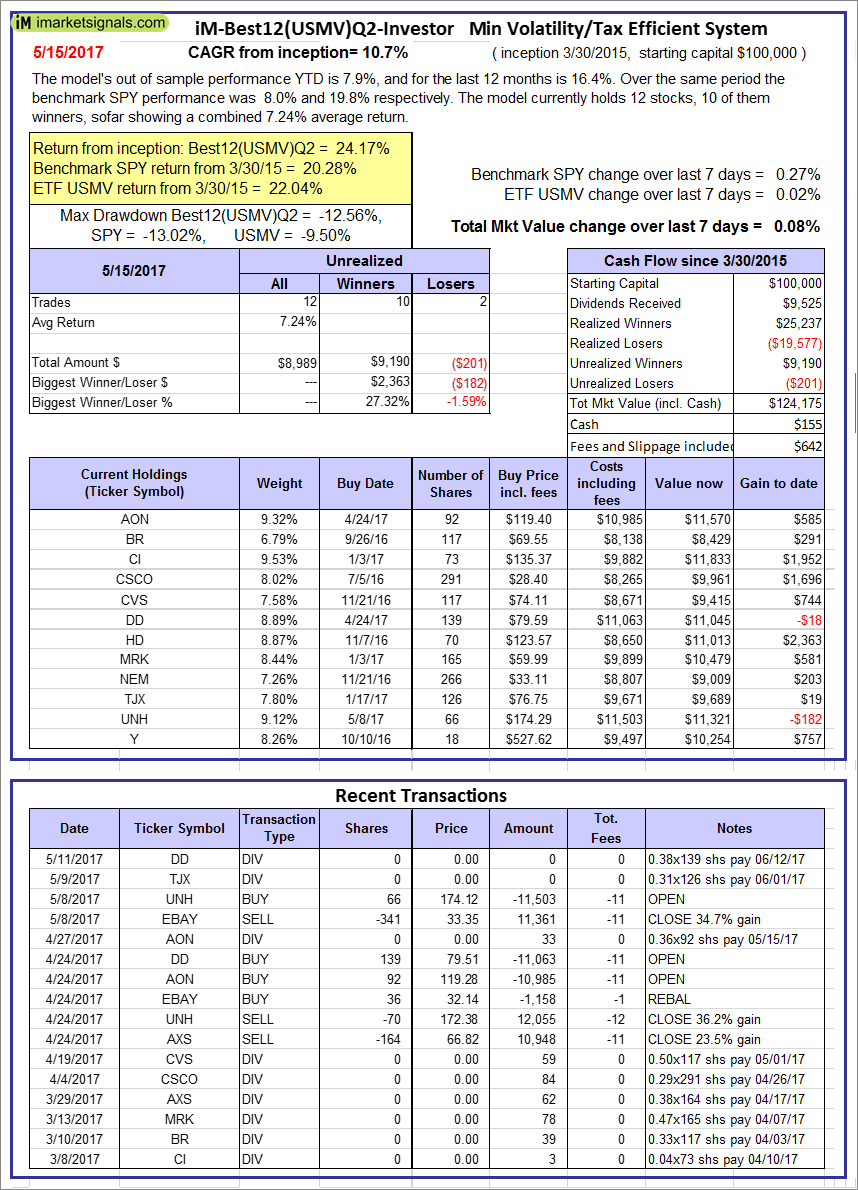
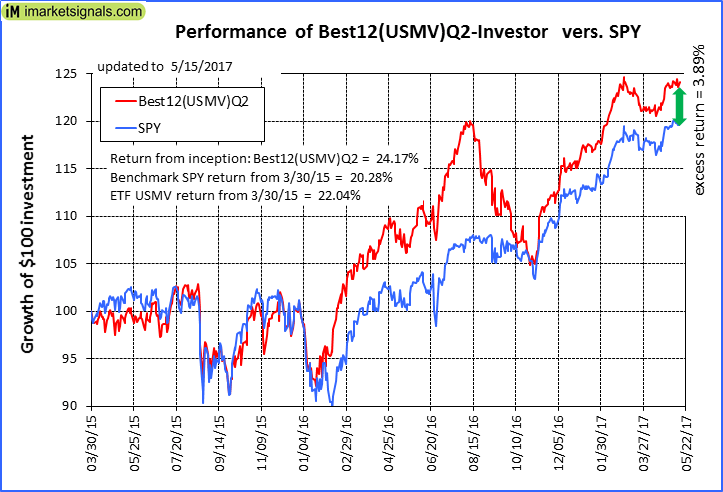
iM-Best12(USMV)Q2-Investor: The model’s out of sample performance YTD is 7.9%, and for the last 12 months is 16.4%. Over the same period the benchmark SPY performance was 8.0% and 19.8% respectively. Since inception, on 3/31/2015, the model gained 24.17% while the benchmark SPY gained 20.28% and the ETF USMV gained 22.04% over the same period. Over the previous week the market value of iM-Best12(USMV)Q2 gained 0.08% at a time when SPY gained 0.27%. A starting capital of $100,000 at inception on 3/31/2015 would have grown to $124,175 which includes $155 cash and excludes $642 spent on fees and slippage. |
|
|
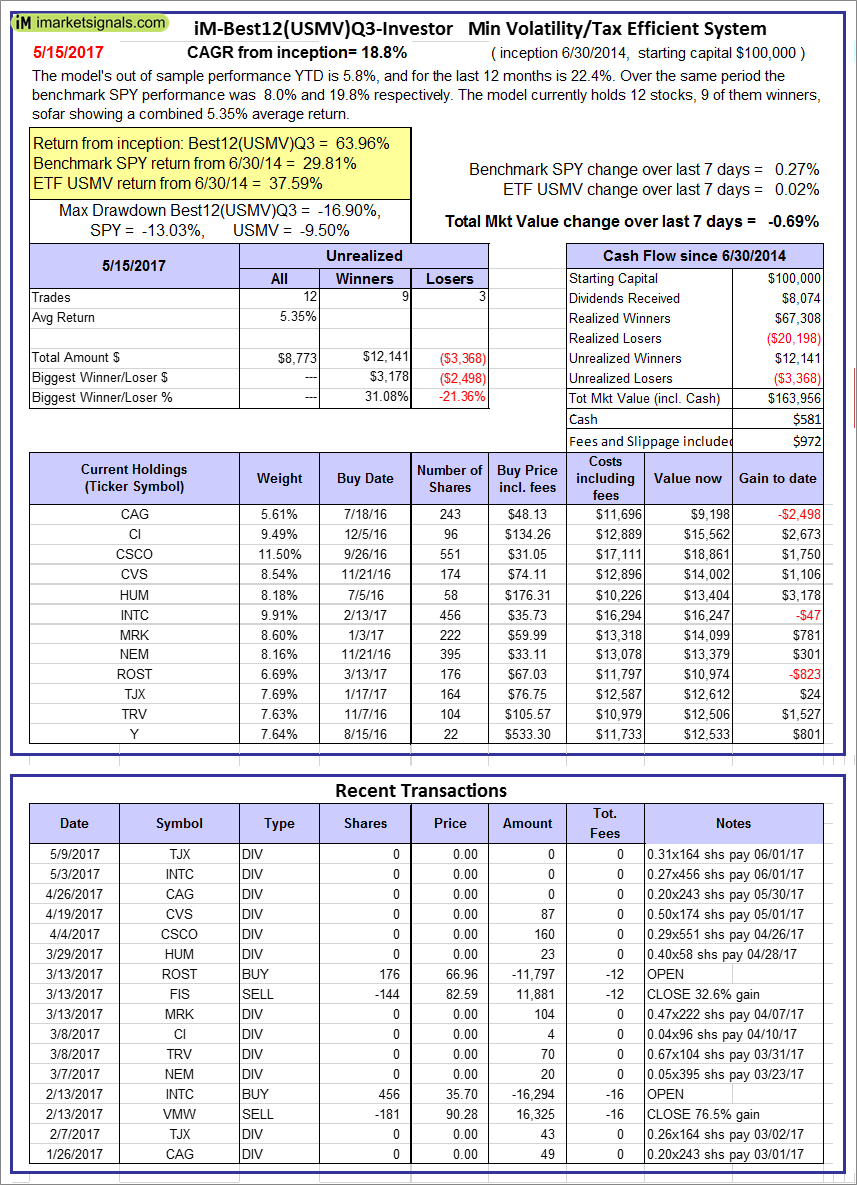
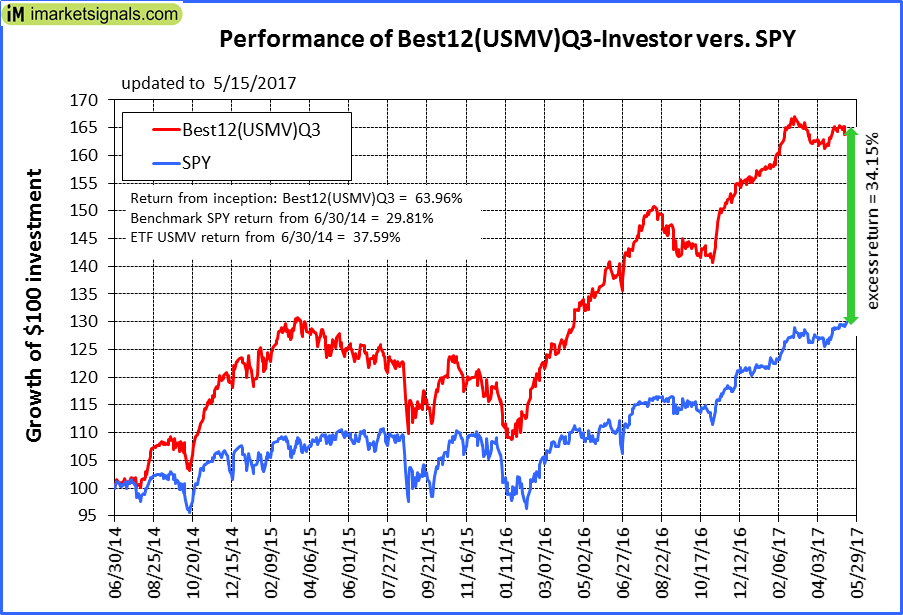
iM-Best12(USMV)Q3-Investor: The model’s out of sample performance YTD is 5.8%, and for the last 12 months is 22.4%. Over the same period the benchmark SPY performance was 8.0% and 19.8% respectively. Since inception, on 7/1/2014, the model gained 63.96% while the benchmark SPY gained 29.81% and the ETF USMV gained 37.59% over the same period. Over the previous week the market value of iM-Best12(USMV)Q3 gained -0.69% at a time when SPY gained 0.27%. A starting capital of $100,000 at inception on 7/1/2014 would have grown to $163,956 which includes $581 cash and excludes $972 spent on fees and slippage. |
|
|
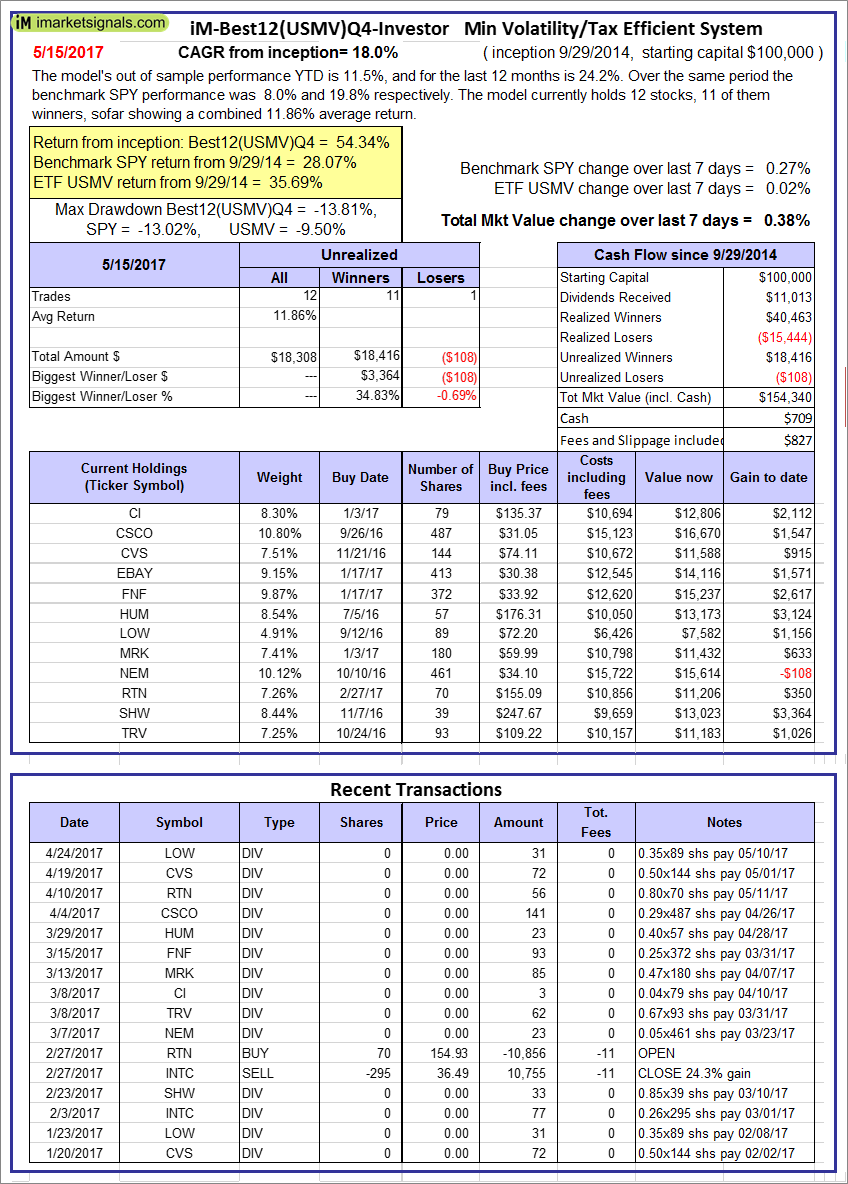
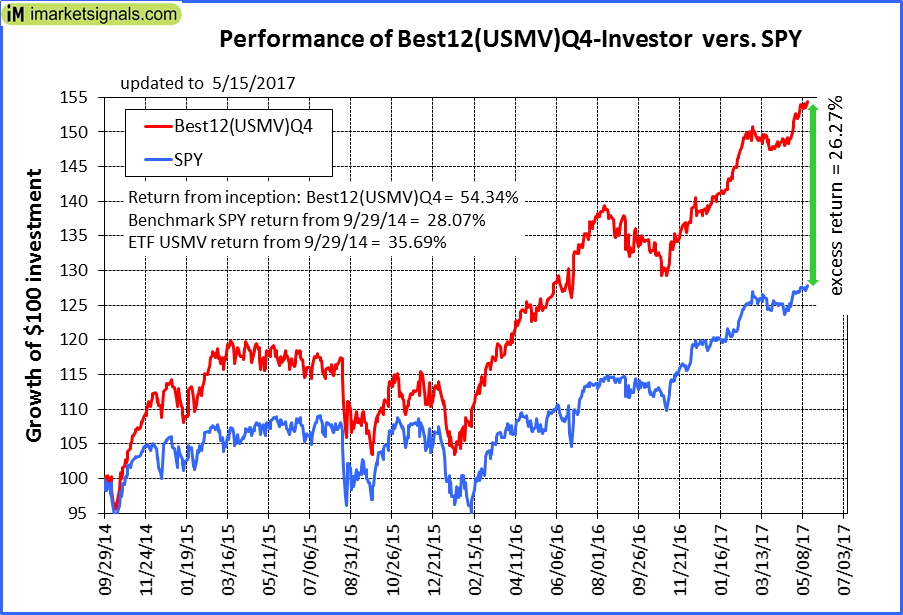
iM-Best12(USMV)Q4-Investor: Since inception, on 9/30/2014, the model gained 54.34% while the benchmark SPY gained 28.07% and the ETF USMV gained 35.69% over the same period. Over the previous week the market value of iM-Best12(USMV)Q4 gained 0.38% at a time when SPY gained 0.27%. A starting capital of $100,000 at inception on 9/30/2014 would have grown to $154,340 which includes $709 cash and excludes $827 spent on fees and slippage. |
|
|
Average Performance of iM-Best12(USMV)Q1+Q2+Q3+Q4-Investor resulted in an excess return of 34.21% over SPY. (see iM-USMV Investor Portfolio) |
|
|
iM-Best(Short): The model’s out of sample performance YTD is -2.6%, and for the last 12 months is -9.3%. Over the same period the benchmark SPY performance was 8.0% and 19.8% respectively. Over the previous week the market value of iM-Best(Short) gained -0.22% at a time when SPY gained 0.27%. Over the period 1/2/2009 to 5/15/2017 the starting capital of $100,000 would have grown to $94,242 which includes $151,899 cash and excludes $21,974 spent on fees and slippage. |


Leave a Reply
You must be logged in to post a comment.