
  |
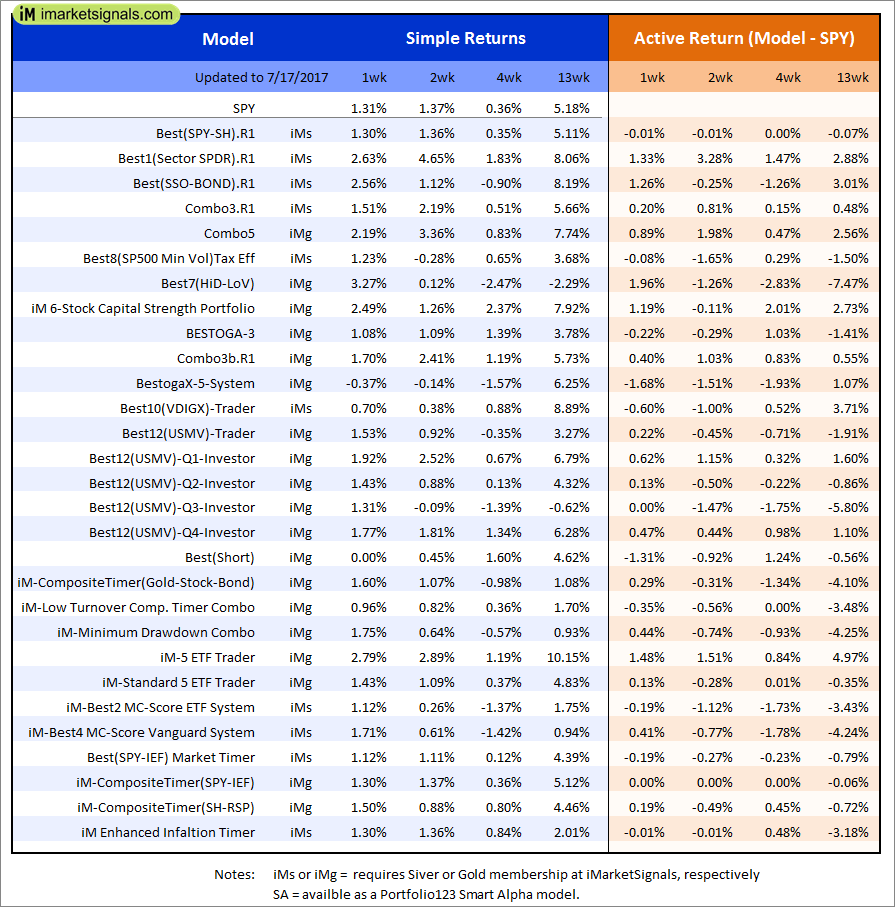
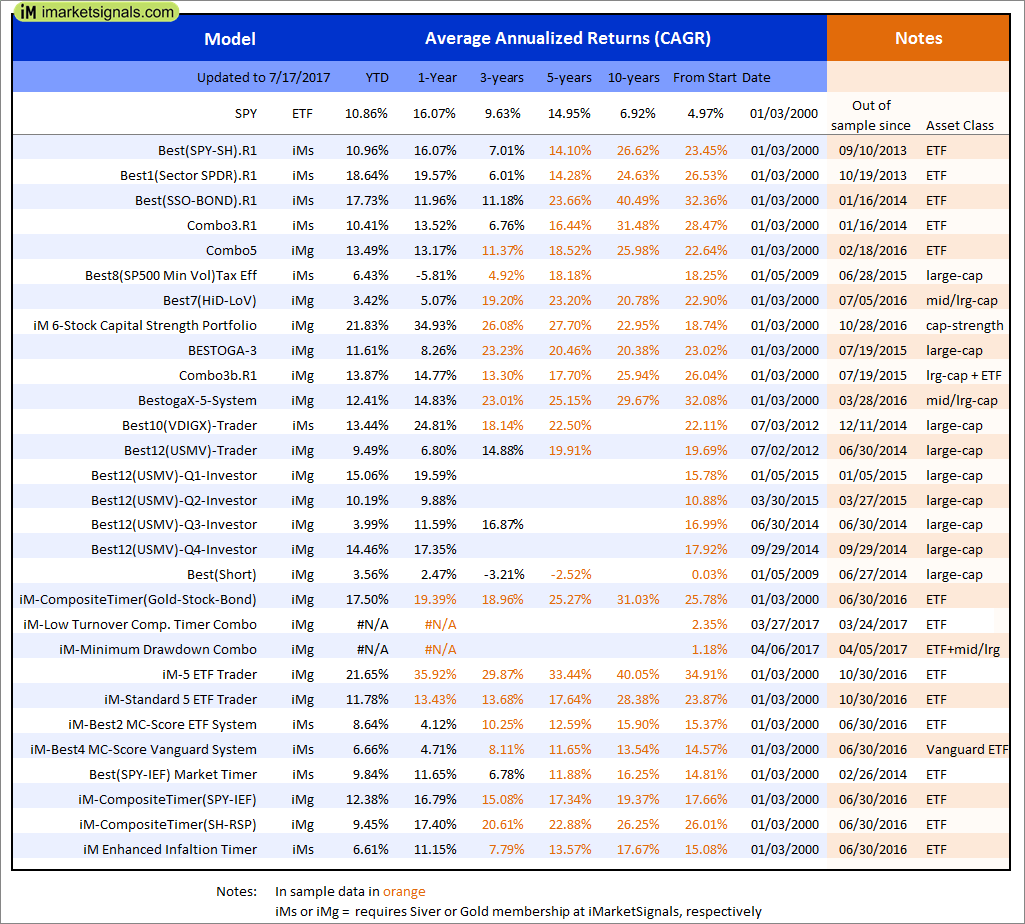
Out of sample performance summary of our models for the past 1, 2, 4 and 13 week periods. The active active return indicates how the models over- or underperformed the benchmark ETF SPY. Also the YTD, and the 1-, 3-, 5- and 10-year annualized returns are shown in the second table |
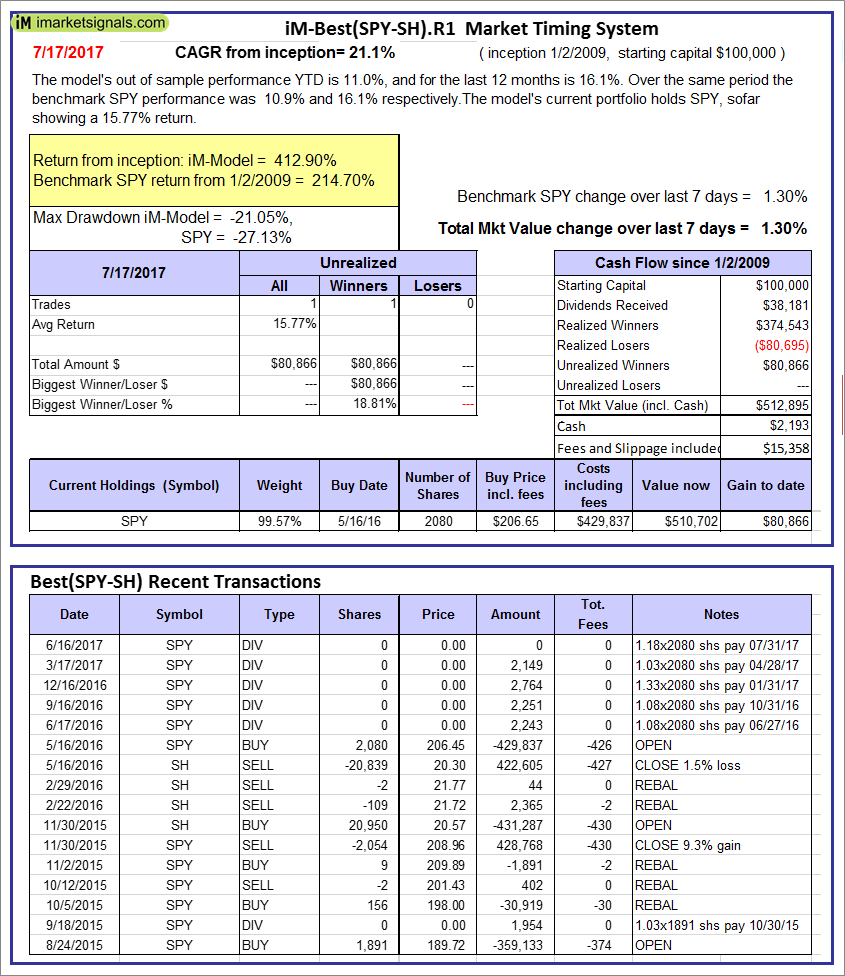 |
iM-Best(SPY-SH).R1: The model’s out of sample performance YTD is 11.0%, and for the last 12 months is 16.1%. Over the same period the benchmark SPY performance was 10.9% and 16.1% respectively. Over the previous week the market value of Best(SPY-SH) gained 1.30% at a time when SPY gained 1.30%. A starting capital of $100,000 at inception on 1/2/2009 would have grown to $512,895 which includes $2,193 cash and excludes $15,358 spent on fees and slippage. |
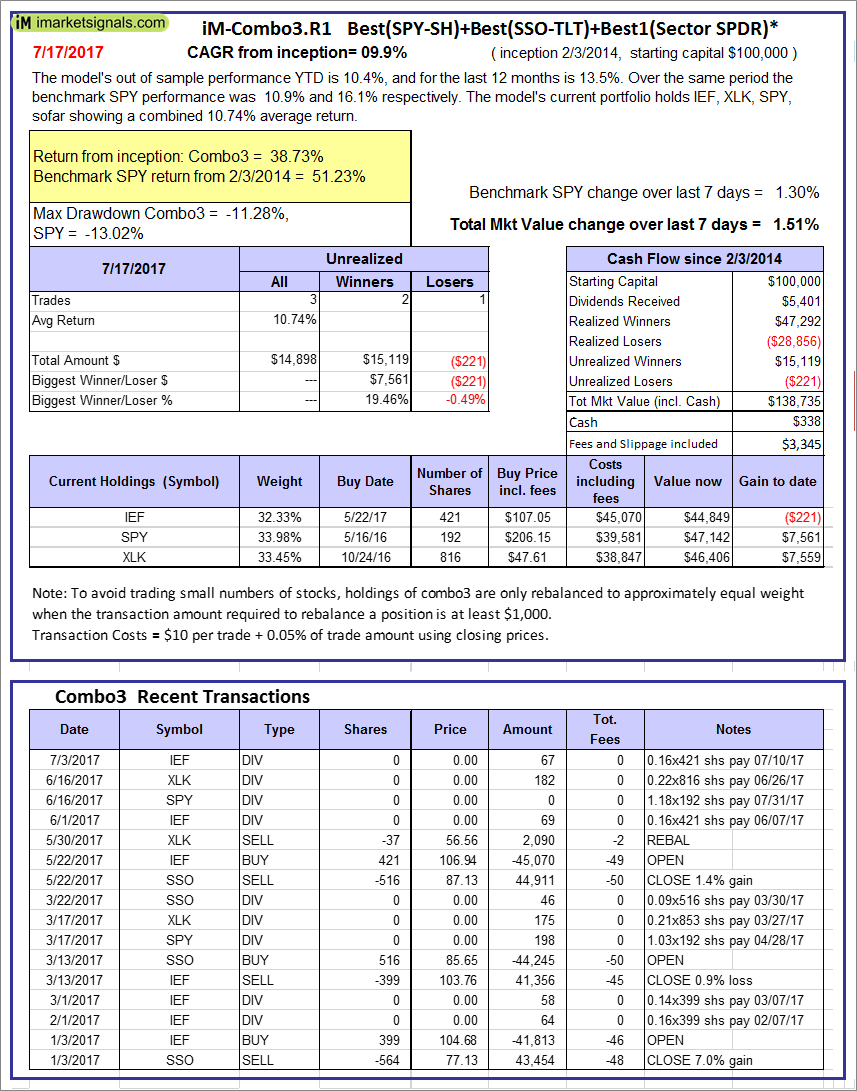 |
iM-Combo3.R1: The model’s out of sample performance YTD is 10.4%, and for the last 12 months is 13.5%. Over the same period the benchmark SPY performance was 10.9% and 16.1% respectively. Over the previous week the market value of iM-Combo3.R1 gained 1.51% at a time when SPY gained 1.30%. A starting capital of $100,000 at inception on 2/3/2014 would have grown to $138,735 which includes $338 cash and excludes $3,345 spent on fees and slippage. |
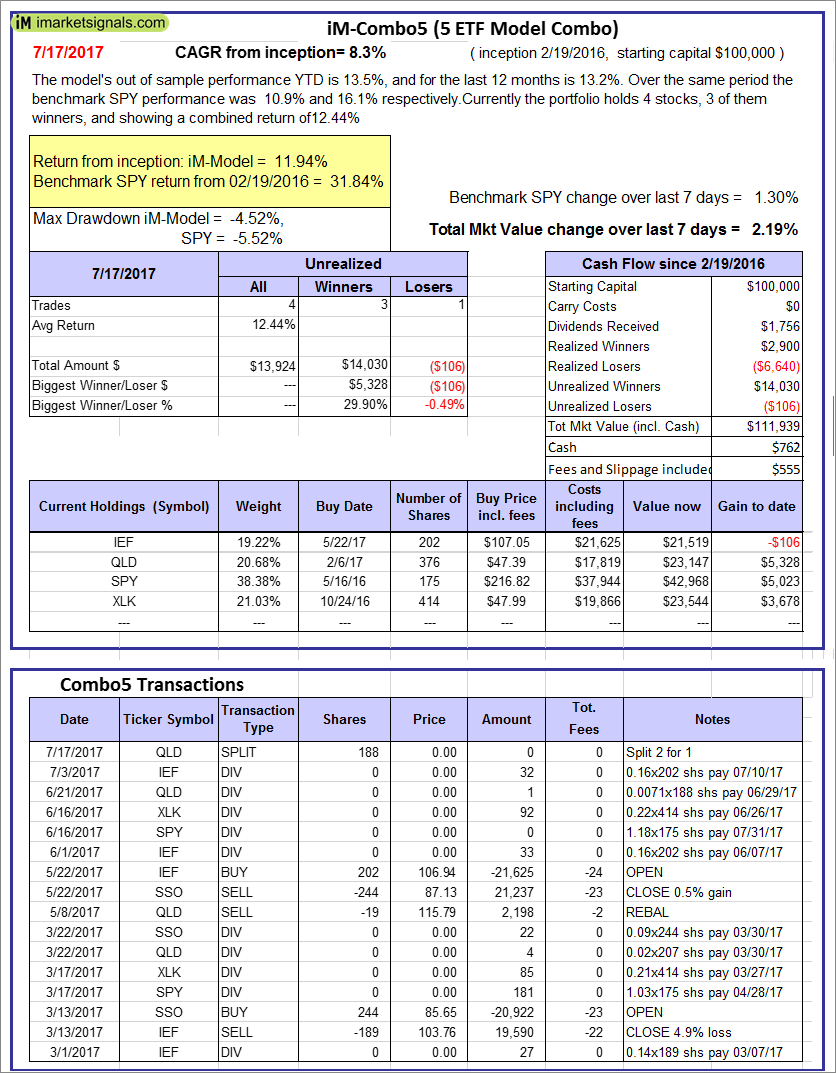 |
iM-Combo5: The model’s out of sample performance YTD is 13.5%, and for the last 12 months is 13.2%. Over the same period the benchmark SPY performance was 10.9% and 16.1% respectively. Over the previous week the market value of iM-Combo5 gained 2.19% at a time when SPY gained 1.30%. A starting capital of $100,000 at inception on 2/22/2016 would have grown to $111,939 which includes $762 cash and excludes $555 spent on fees and slippage. |
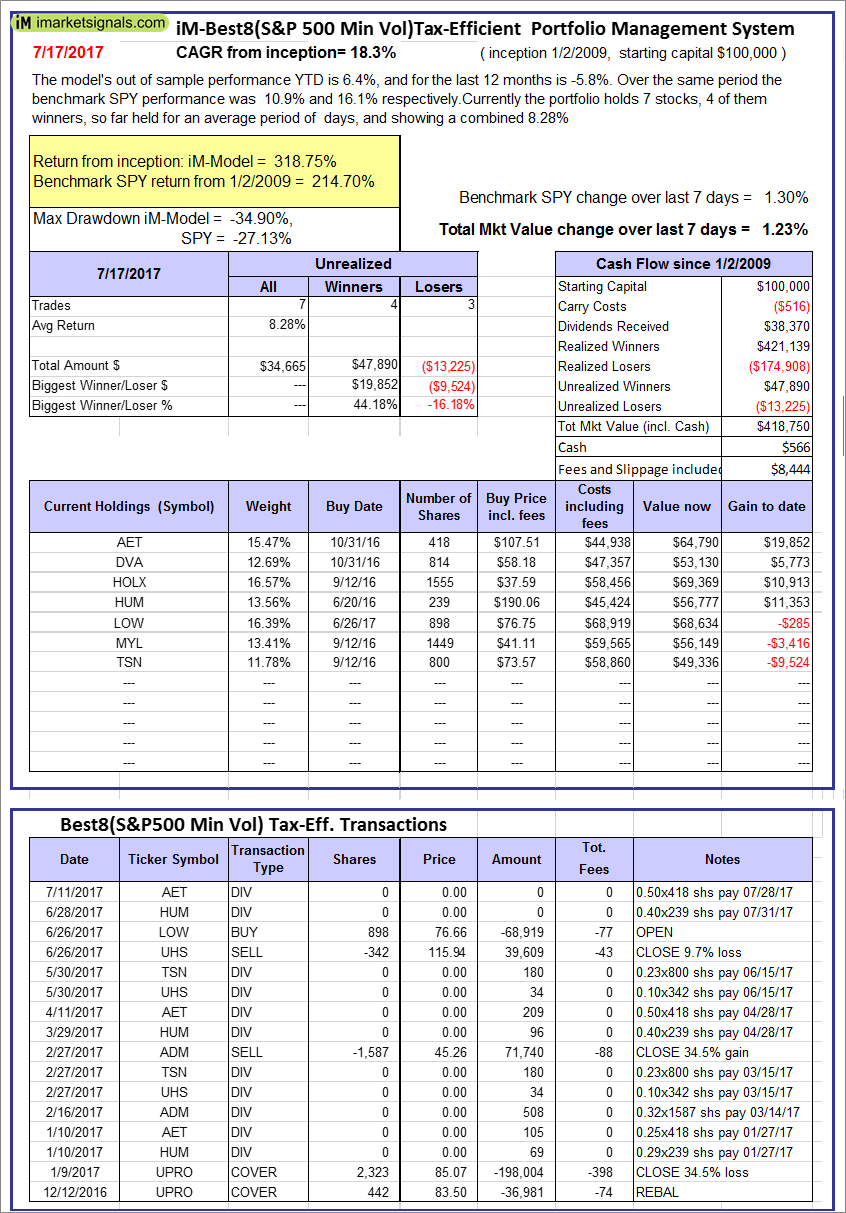 |
The iM-Best8(S&P500 Min Vol)Tax-Efficient The model’s out of sample performance YTD is 6.4%, and for the last 12 months is -5.8%. Over the same period the benchmark SPY performance was 10.9% and 16.1% respectively. Over the previous week the market value of iM-Best8(S&P 500)Tax-Eff. gained 1.23% at a time when SPY gained 1.30%. A starting capital of $100,000 at inception on 1/2/2009 would have grown to $418,750 which includes $566 cash and excludes $8,444 spent on fees and slippage. |
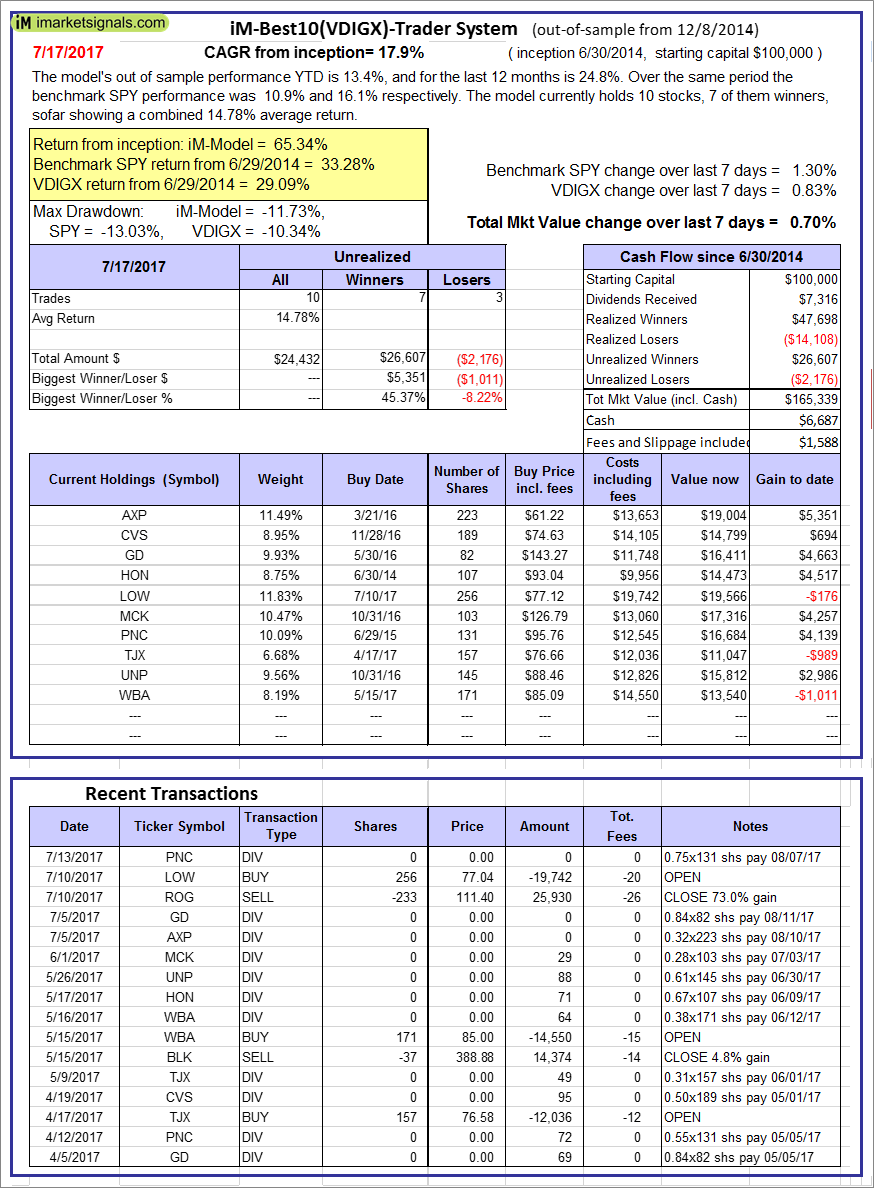 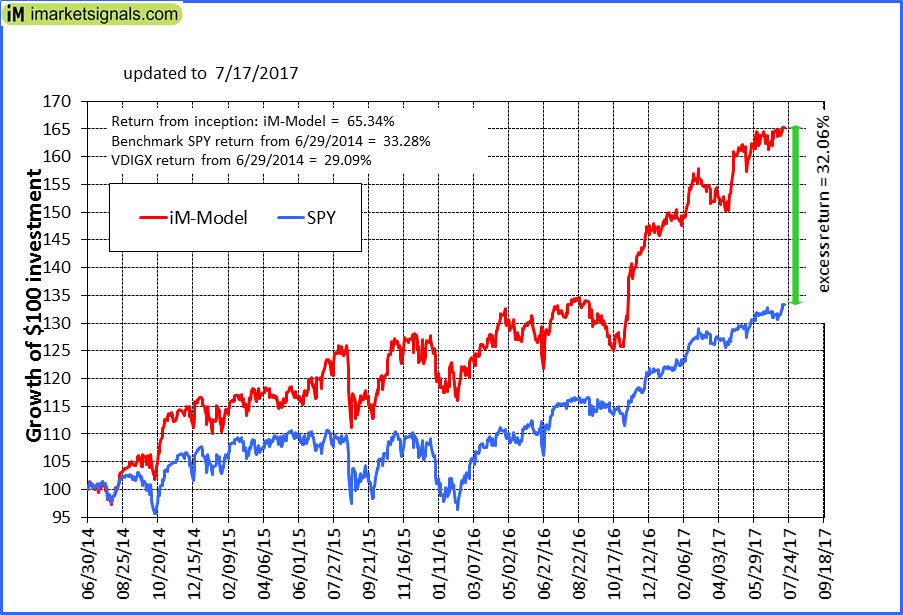 |
iM-Best10(VDIGX)-Trader: The model’s out of sample performance YTD is 13.4%, and for the last 12 months is 24.8%. Over the same period the benchmark SPY performance was 10.9% and 16.1% respectively. Since inception, on 7/1/2014, the model gained 65.34% while the benchmark SPY gained 33.28% and VDIGX gained 29.09% over the same period. Over the previous week the market value of iM-Best10(VDIGX) gained 0.70% at a time when SPY gained 1.30%. A starting capital of $100,000 at inception on 7/1/2014 would have grown to $165,339 which includes $6,687 cash and excludes $1,588 spent on fees and slippage. |
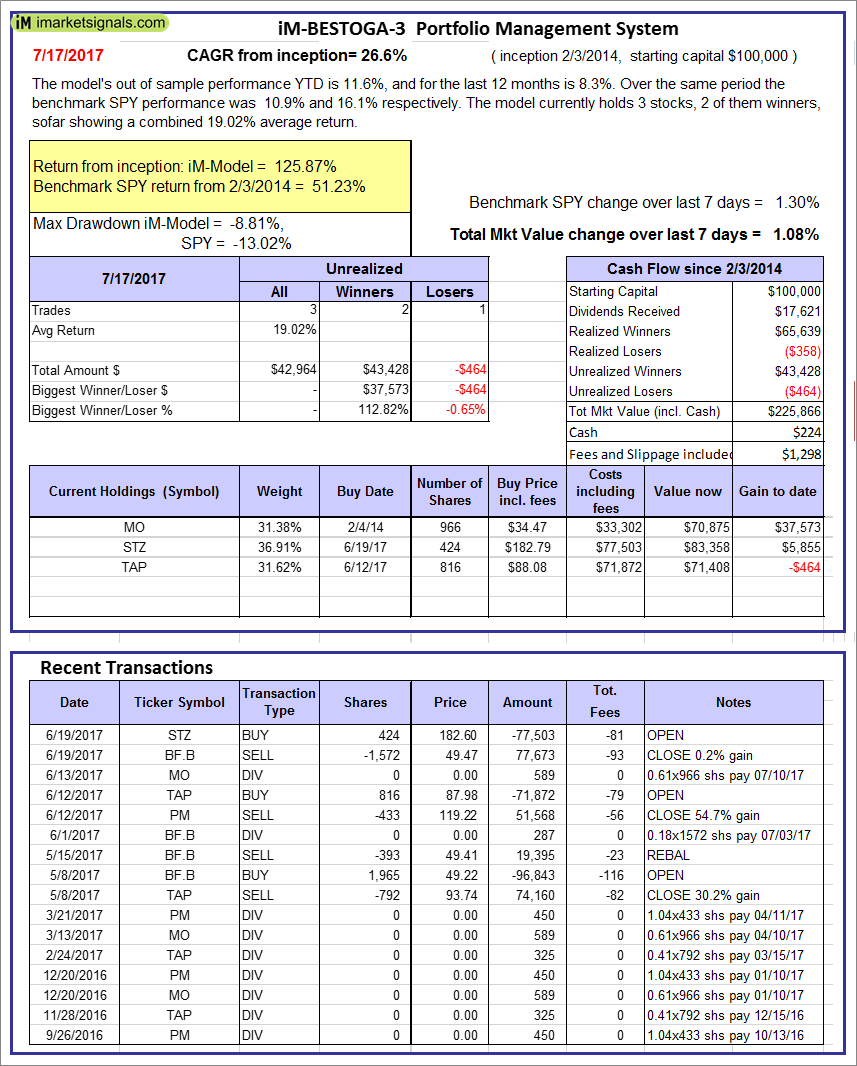 |
iM-BESTOGA-3: The model’s out of sample performance YTD is 11.6%, and for the last 12 months is 8.3%. Over the same period the benchmark SPY performance was 10.9% and 16.1% respectively. Over the previous week the market value of iM-BESTOGA-3 gained 1.08% at a time when SPY gained 1.30%. A starting capital of $100,000 at inception on 2/3/2014 would have grown to $225,866 which includes $224 cash and excludes $1,298 spent on fees and slippage. |
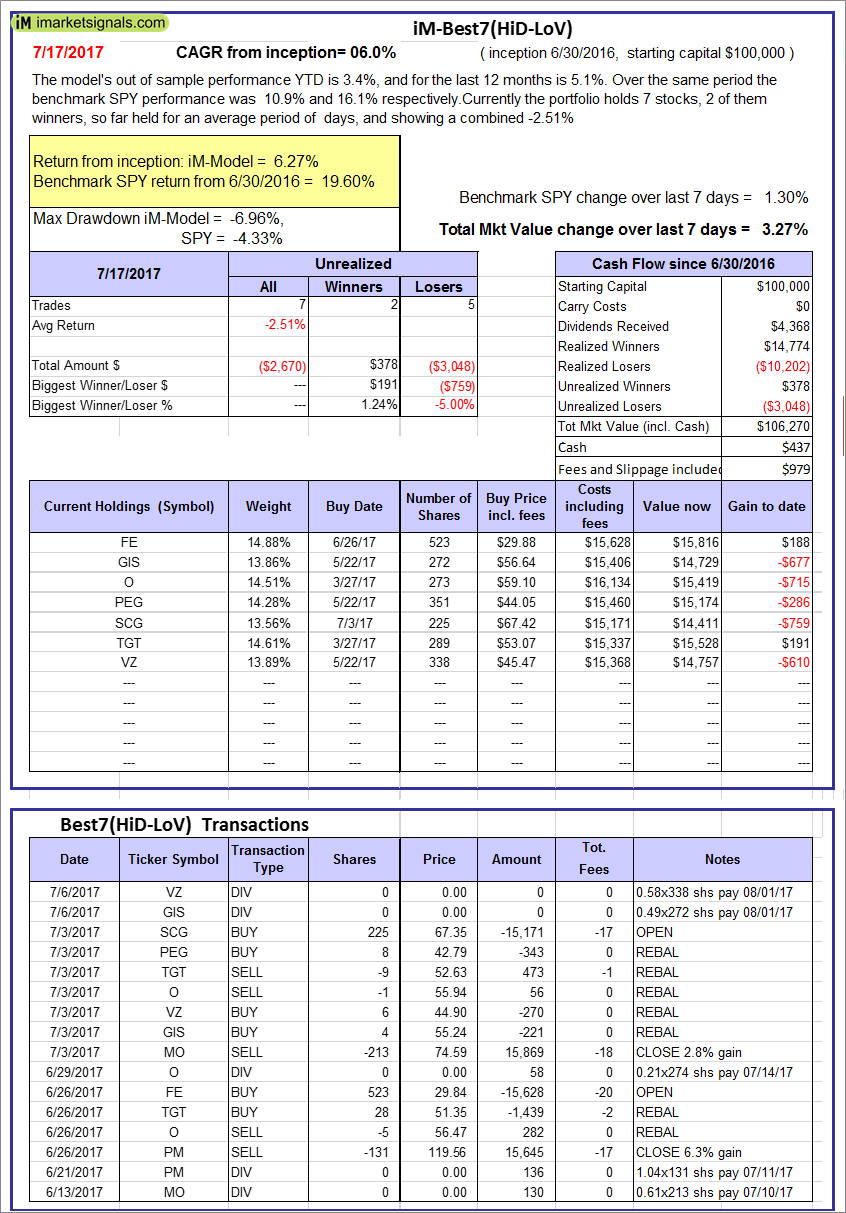 |
iM-Best7(HiD-LoV): The model’s out of sample performance YTD is 3.4%, and for the last 12 months is 5.1%. Over the same period the benchmark SPY performance was 10.9% and 16.1% respectively. Over the previous week the market value of iM-BESTOGA-3 gained 3.27% at a time when SPY gained 1.30%. A starting capital of $100,000 at inception on 6/30/2016 would have grown to $106,270 which includes $437 cash and excludes $979 spent on fees and slippage. |
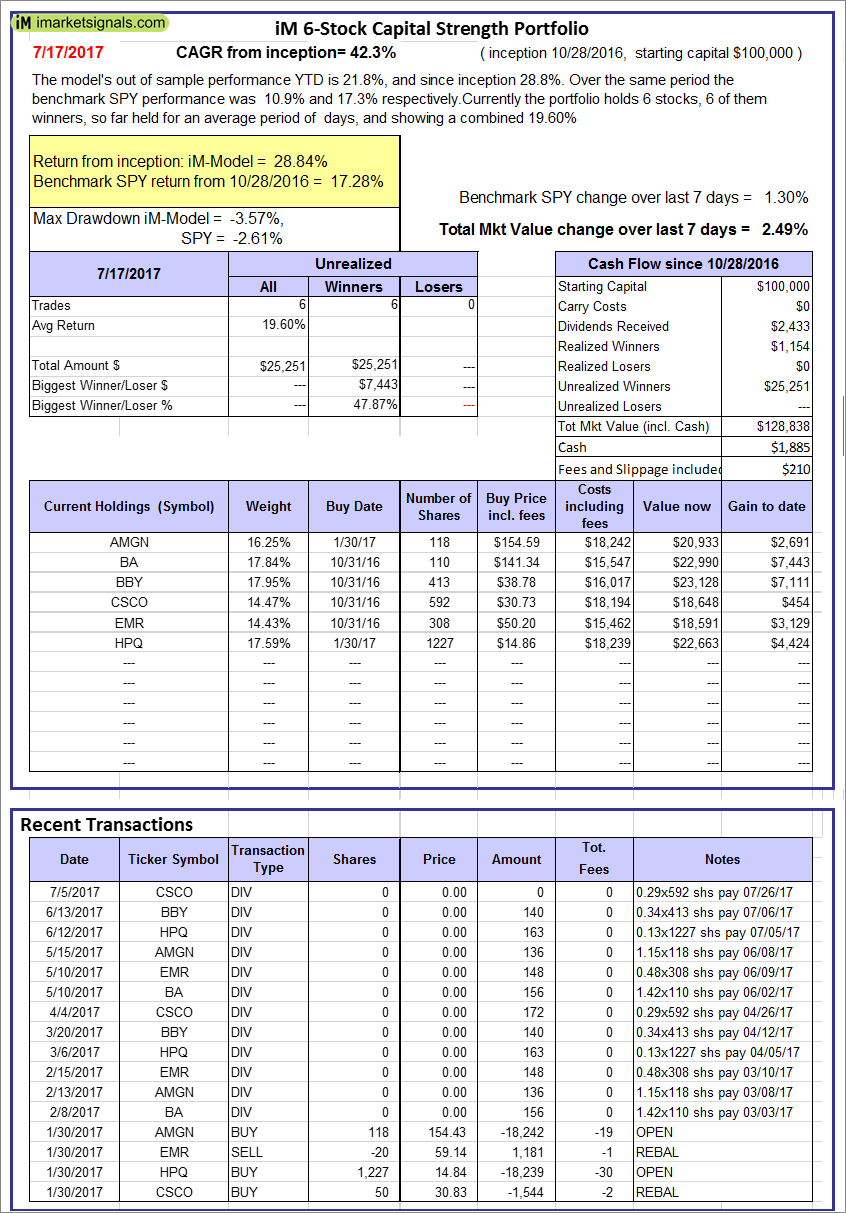 |
iM 6-Stock Capital Strength Portfolio: The model’s out of sample performance YTD is 21.8%, and since inception 28.8%. Over the same period the benchmark SPY performance was 10.9% and 17.3% respectively. Over the previous week the market value of the iM 6-Stock Capital Strength Portfolio gained 2.49% at a time when SPY gained 1.30%. A starting capital of $100,000 at inception on 10/28/2016 would have grown to $128,838 which includes $1,885 cash and excludes $210 spent on fees and slippage. |
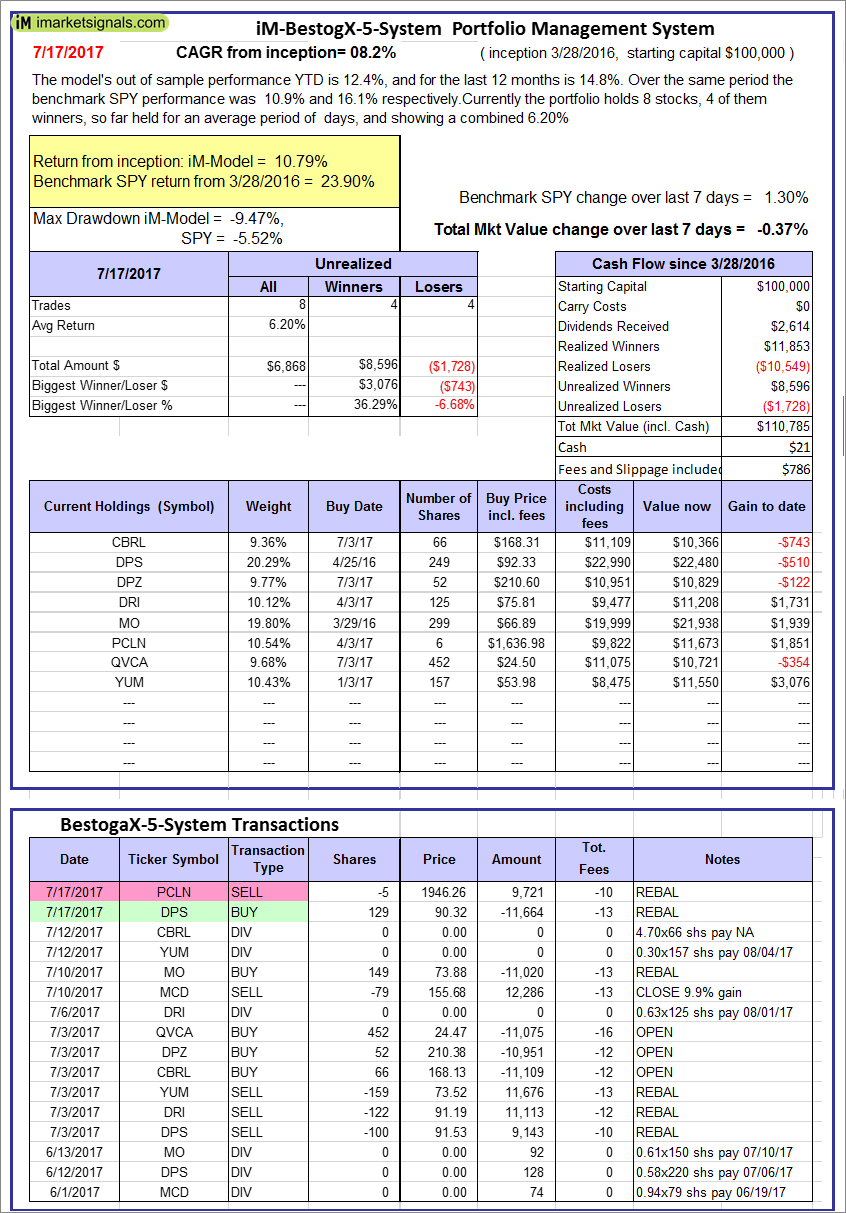 |
iM-BestogaX5-System: The model’s out of sample performance YTD is 12.4%, and for the last 12 months is 14.8%. Over the same period the benchmark SPY performance was 10.9% and 16.1% respectively. Over the previous week the market value of iM-Best8(S&P 500)Tax-Eff. gained -0.37% at a time when SPY gained 1.30%. A starting capital of $100,000 at inception on 3/28/2016 would have grown to $110,785 which includes $21 cash and excludes $786 spent on fees and slippage. |
 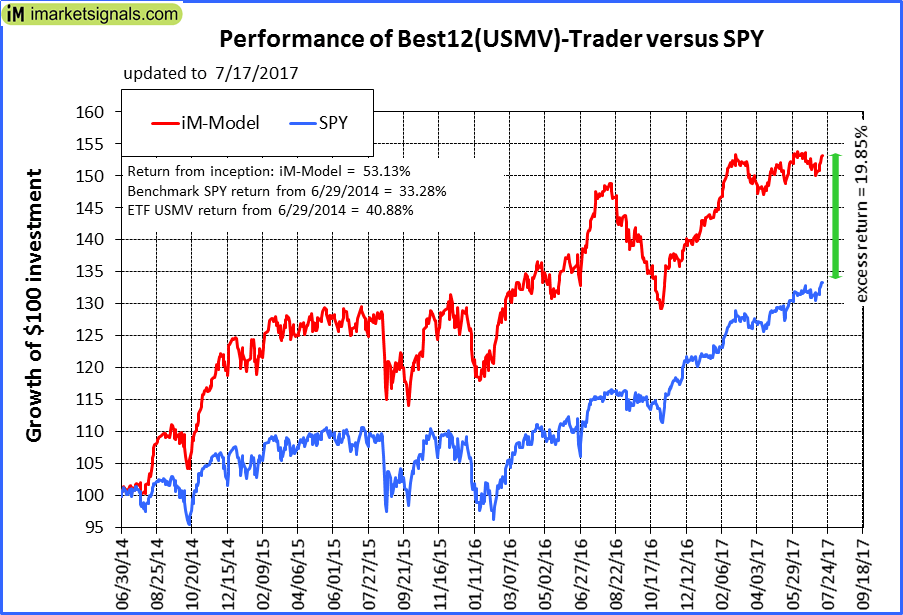 |
iM-Best12(USMV)-Trader: The model’s out of sample performance YTD is 9.5%, and for the last 12 months is 6.8%. Over the same period the benchmark SPY performance was 10.9% and 16.1% respectively. Since inception, on 6/30/2014, the model gained 53.13% while the benchmark SPY gained 33.28% and the ETF USMV gained 40.88% over the same period. Over the previous week the market value of iM-Best12(USMV)-Trader gained 1.53% at a time when SPY gained 1.30%. A starting capital of $100,000 at inception on 6/30/2014 would have grown to $153,133 which includes $287 cash and excludes $3,210 spent on fees and slippage. |
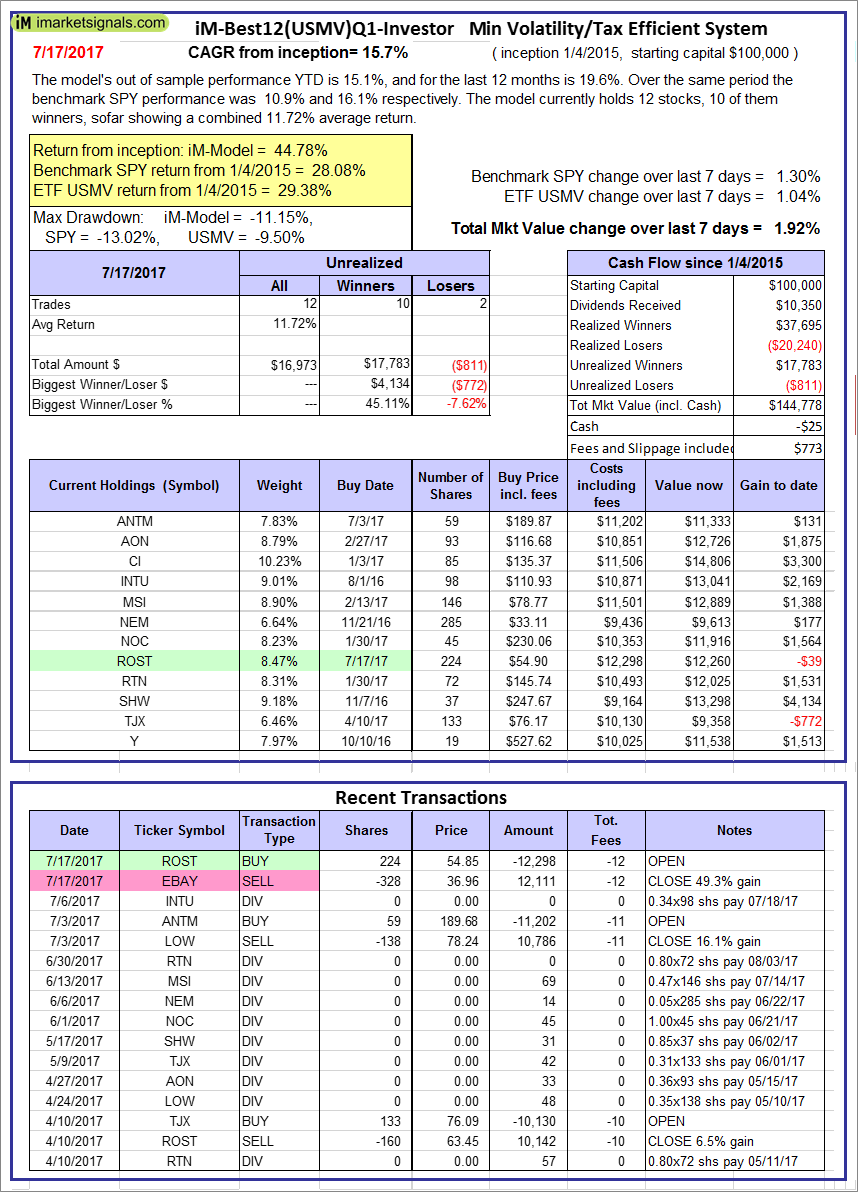 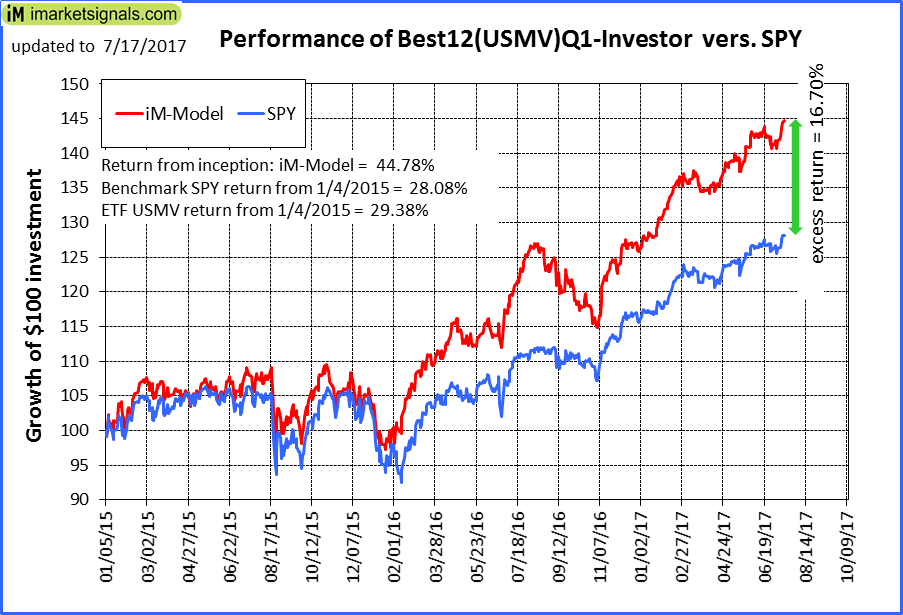 |
iM-Best12(USMV)Q1-Investor: The model’s out of sample performance YTD is 15.1%, and for the last 12 months is 19.6%. Over the same period the benchmark SPY performance was 10.9% and 16.1% respectively. Since inception, on 1/5/2015, the model gained 44.78% while the benchmark SPY gained 28.08% and the ETF USMV gained 29.38% over the same period. Over the previous week the market value of iM-Best12(USMV)Q1 gained 1.92% at a time when SPY gained 1.30%. A starting capital of $100,000 at inception on 1/5/2015 would have grown to $144,778 which includes -$25 cash and excludes $773 spent on fees and slippage. |
 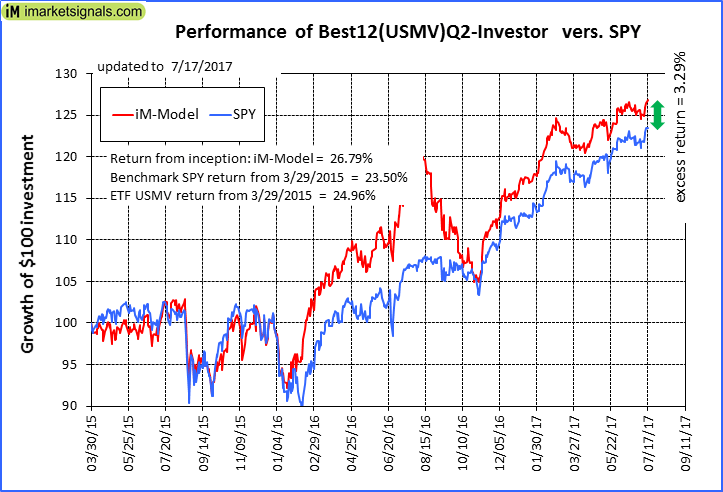 |
iM-Best12(USMV)Q2-Investor: The model’s out of sample performance YTD is 10.2%, and for the last 12 months is 9.9%. Over the same period the benchmark SPY performance was 10.9% and 16.1% respectively. Since inception, on 3/30/2015, the model gained 26.79% while the benchmark SPY gained 23.50% and the ETF USMV gained 24.96% over the same period. Over the previous week the market value of iM-Best12(USMV)Q2 gained 1.43% at a time when SPY gained 1.30%. A starting capital of $100,000 at inception on 3/30/2015 would have grown to $126,794 which includes $57 cash and excludes $660 spent on fees and slippage. |
 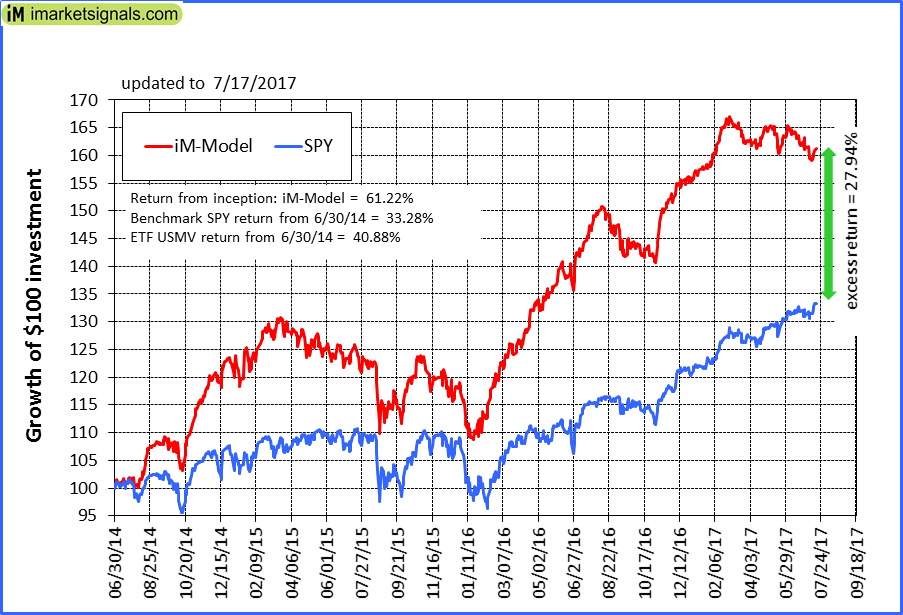 |
iM-Best12(USMV)Q3-Investor: The model’s out of sample performance YTD is 4.0%, and for the last 12 months is 11.6%. Over the same period the benchmark SPY performance was 10.9% and 16.1% respectively. Since inception, on 7/1/2014, the model gained 61.22% while the benchmark SPY gained 33.28% and the ETF USMV gained 40.88% over the same period. Over the previous week the market value of iM-Best12(USMV)Q3 gained 1.31% at a time when SPY gained 1.30%. A starting capital of $100,000 at inception on 7/1/2014 would have grown to $161,220 which includes $190 cash and excludes $995 spent on fees and slippage. |
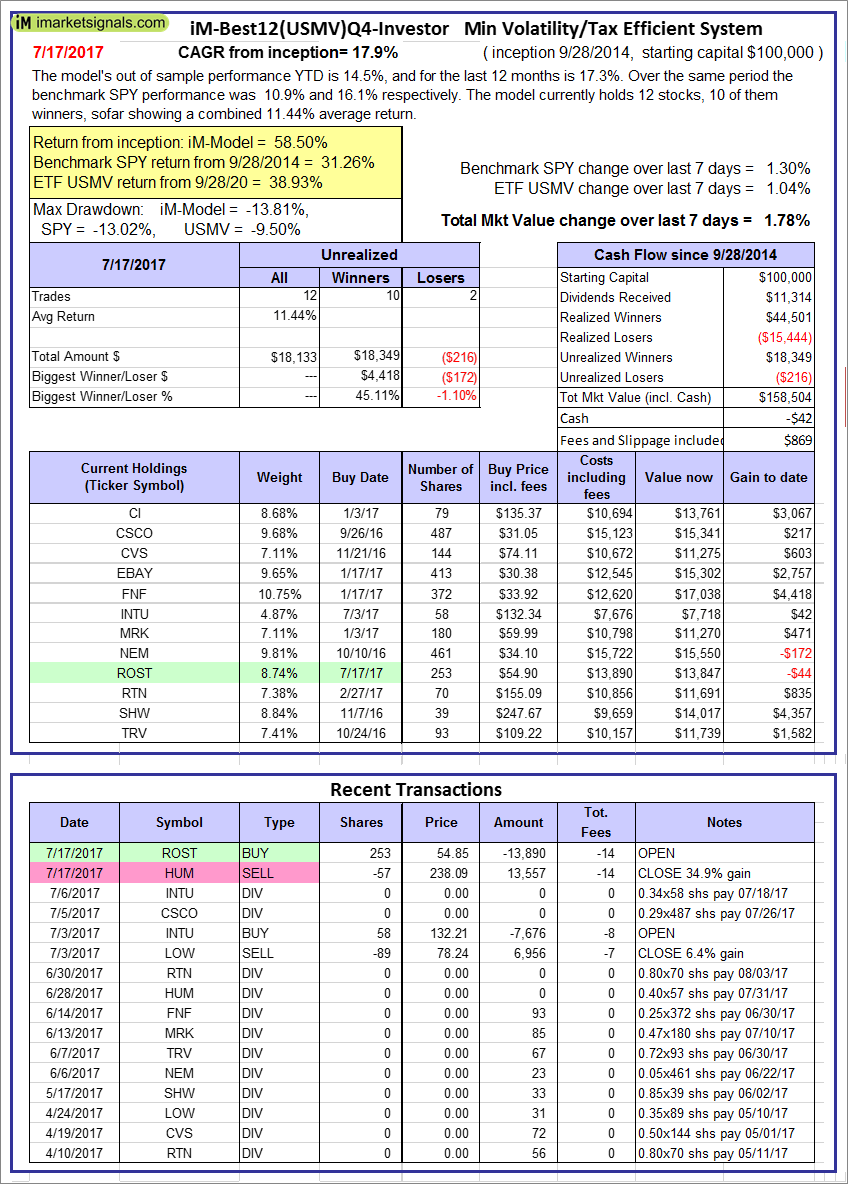 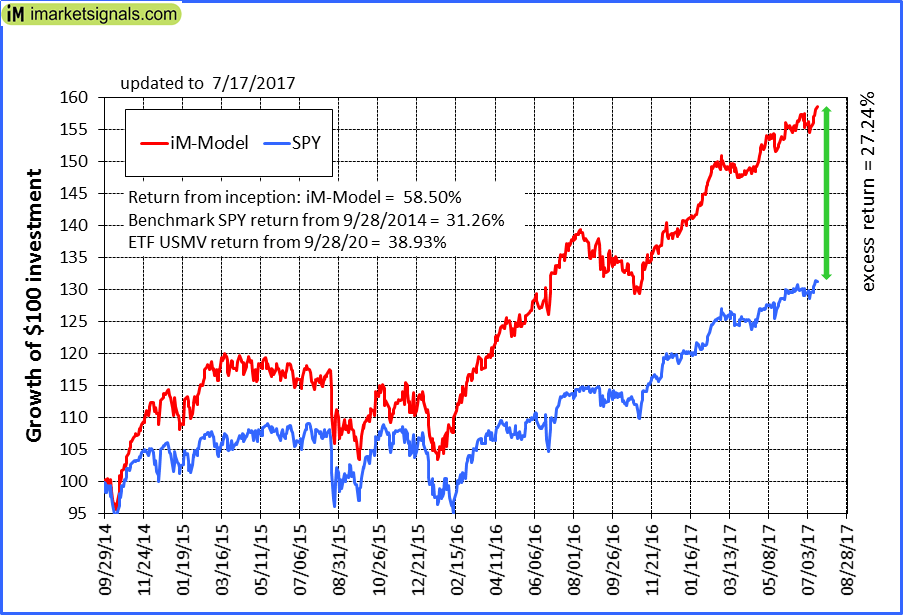 |
iM-Best12(USMV)Q4-Investor: Since inception, on 9/29/2014, the model gained 58.50% while the benchmark SPY gained 31.26% and the ETF USMV gained 38.93% over the same period. Over the previous week the market value of iM-Best12(USMV)Q4 gained 1.78% at a time when SPY gained 1.30%. A starting capital of $100,000 at inception on 9/29/2014 would have grown to $158,504 which includes -$42 cash and excludes $869 spent on fees and slippage. |
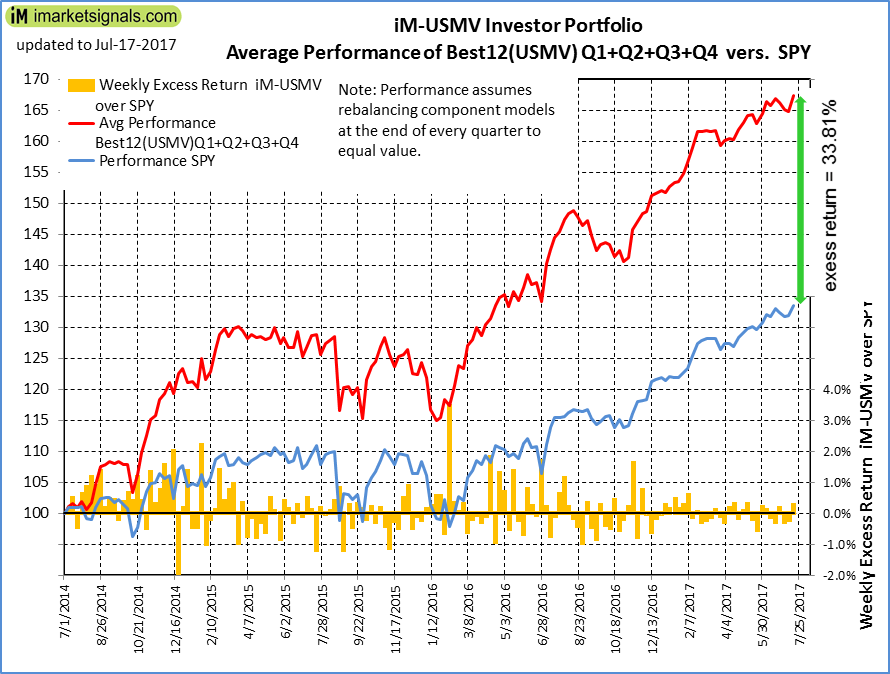 |
Average Performance of iM-Best12(USMV)Q1+Q2+Q3+Q4-Investor resulted in an excess return of 33.81% over SPY. (see iM-USMV Investor Portfolio) |
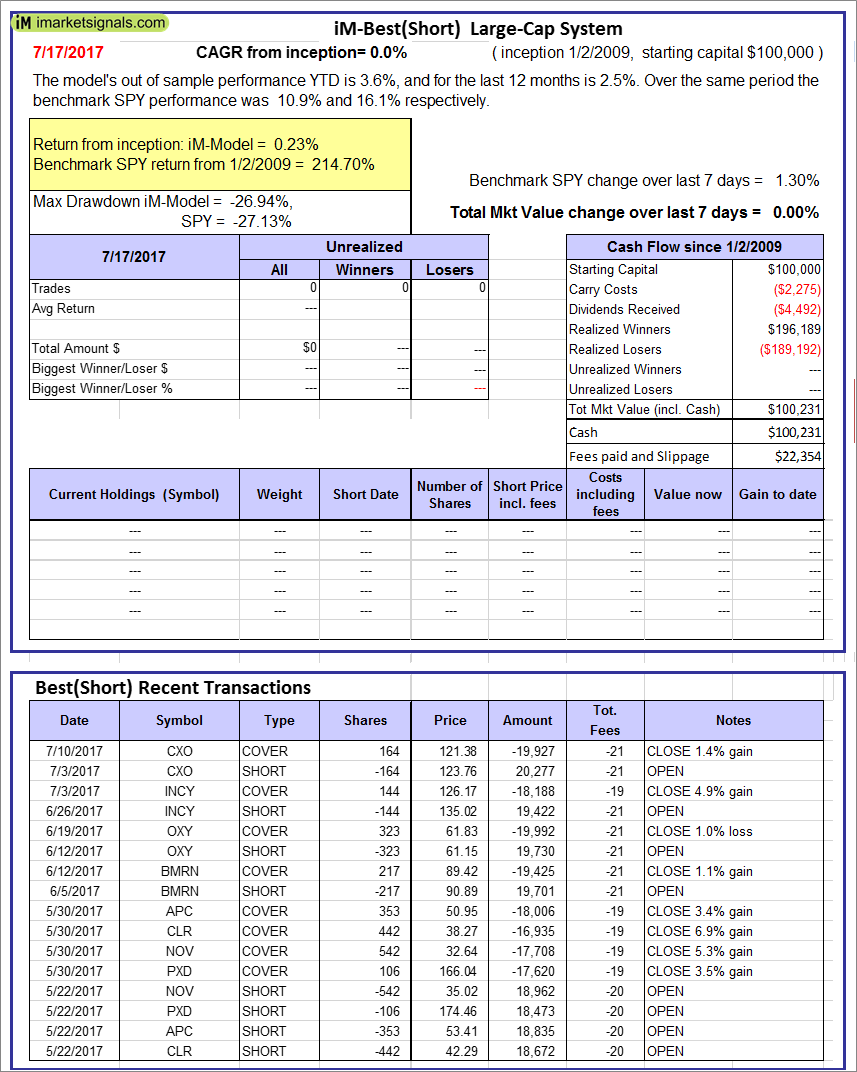 |
iM-Best(Short): The model’s out of sample performance YTD is 3.6%, and for the last 12 months is 2.5%. Over the same period the benchmark SPY performance was 10.9% and 16.1% respectively. Over the previous week the market value of iM-Best(Short) gained 0.00% at a time when SPY gained 1.30%. Over the period 1/2/2009 to 7/17/2017 the starting capital of $100,000 would have grown to $100,231 which includes $100,231 cash and excludes $22,354 spent on fees and slippage. |
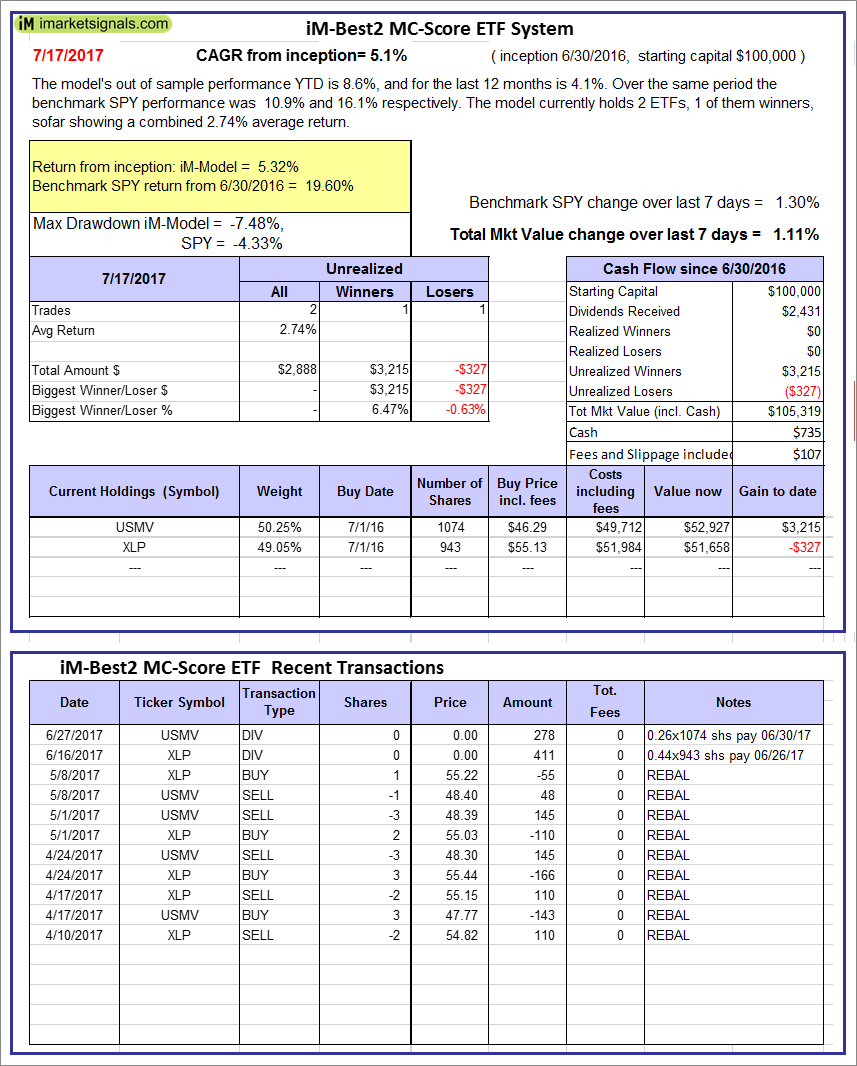 |
iM-Best2 MC-Score ETF System: The model’s out of sample performance YTD is 8.6%, and for the last 12 months is 4.1%. Over the same period the benchmark SPY performance was 10.9% and 16.1% respectively. Over the previous week the market value of the iM-Best2 MC-Score ETF System gained 1.11% at a time when SPY gained 1.30%. A starting capital of $100,000 at inception on 6/30/2016 would have grown to $105,319 which includes $735 cash and excludes $107 spent on fees and slippage. |
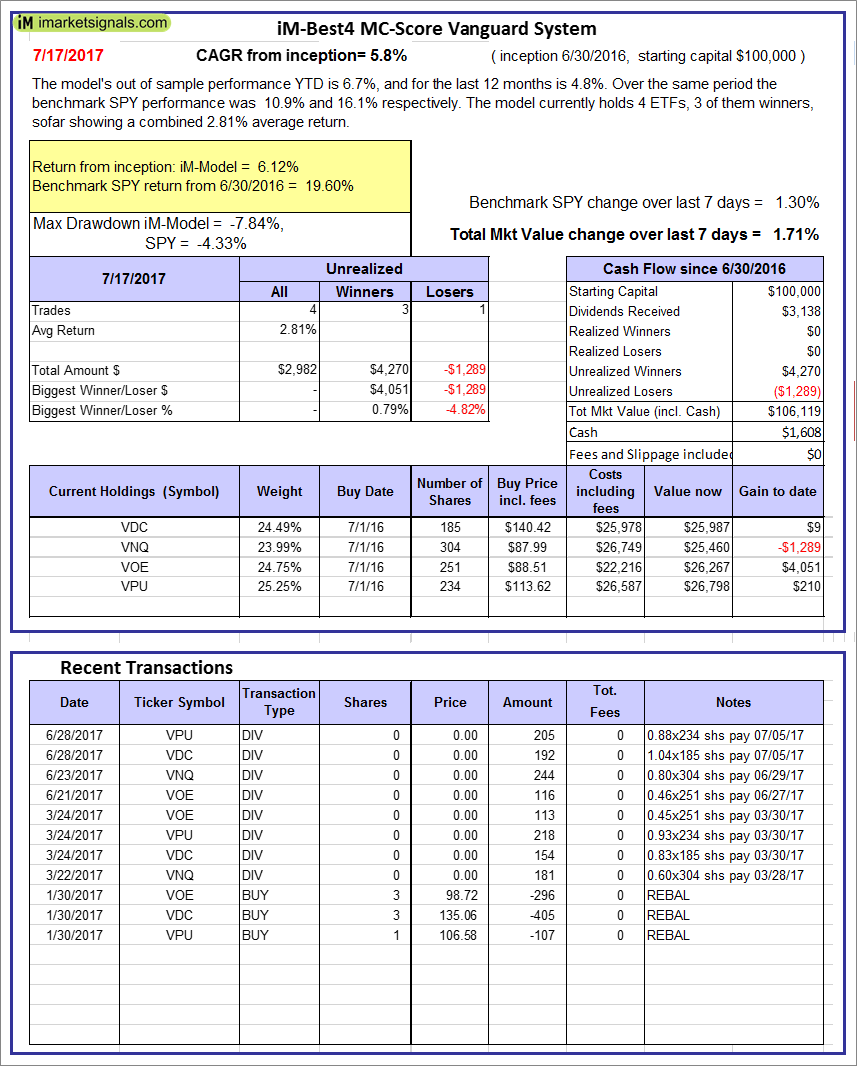 |
iM-Best4 MC-Score Vanguard System: The model’s out of sample performance YTD is 6.7%, and for the last 12 months is 4.8%. Over the same period the benchmark SPY performance was 10.9% and 16.1% respectively. Over the previous week the market value of the iM-Best4 MC-Score Vanguard System gained 1.71% at a time when SPY gained 1.30%. A starting capital of $100,000 at inception on 6/30/2016 would have grown to $106,119 which includes $1,608 cash and excludes $00 spent on fees and slippage. |
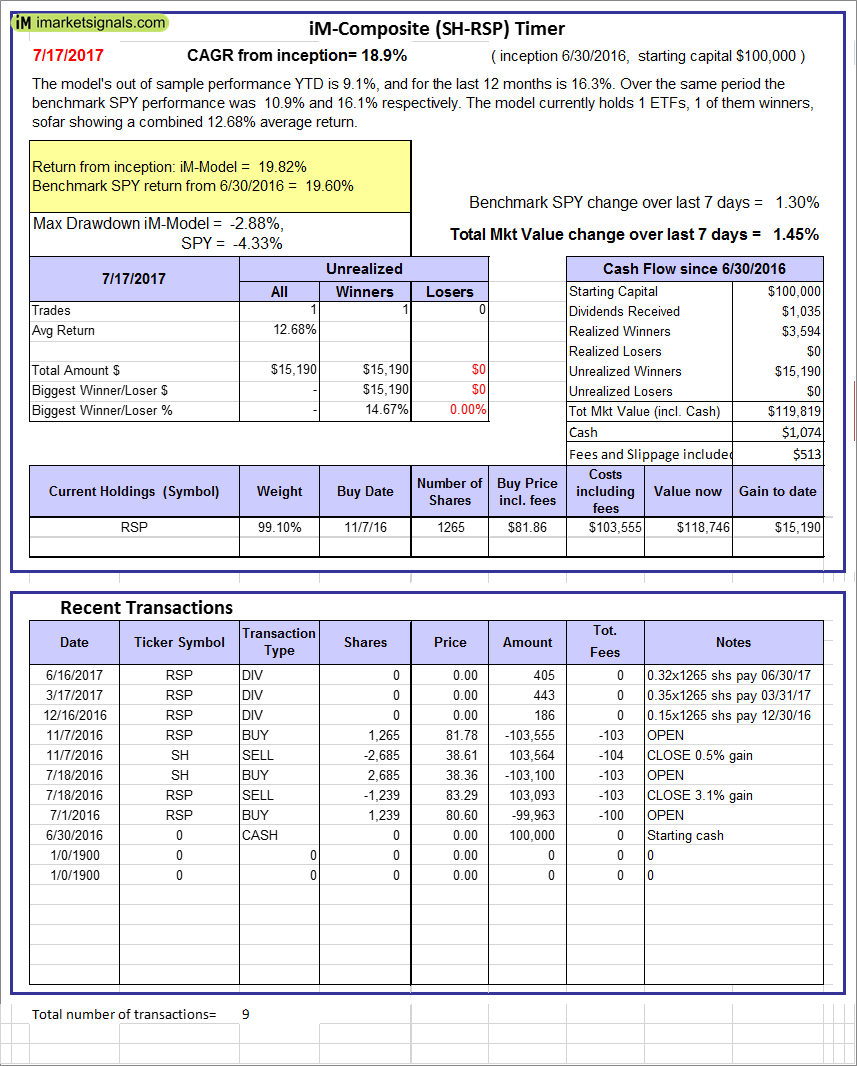 |
iM-Composite (SH-RSP) Timer: The model’s out of sample performance YTD is 9.1%, and for the last 12 months is 16.3%. Over the same period the benchmark SPY performance was 10.9% and 16.1% respectively. Over the previous week the market value of the iM-Composite (SH-RSP) Timer gained 1.45% at a time when SPY gained 1.30%. A starting capital of $100,000 at inception on 6/30/2016 would have grown to $119,819 which includes $1,074 cash and excludes $513 spent on fees and slippage. |
 |
iM-Composite (SPY-IEF) Timer: The model’s out of sample performance YTD is 12.4%, and for the last 12 months is 17.7%. Over the same period the benchmark SPY performance was 10.9% and 16.1% respectively. Over the previous week the market value of the iM-Composite (SPY-IEF) Timer gained 1.30% at a time when SPY gained 1.30%. A starting capital of $100,000 at inception on 6/30/2016 would have grown to $120,938 which includes $137 cash and excludes $1,389 spent on fees and slippage. |
 |
iM-Composite(Gold-Stocks-Bond) Timer: The model’s out of sample performance YTD is 17.5%, and for the last 12 months is 21.7%. Over the same period the benchmark SPY performance was 10.9% and 16.1% respectively. Over the previous week the market value of the iM-Composite(Gold-Stocks-Bond) Timer gained 1.60% at a time when SPY gained 1.30%. A starting capital of $100,000 at inception on 6/30/2016 would have grown to $122,067 which includes $269 cash and excludes $1,955 spent on fees and slippage. |
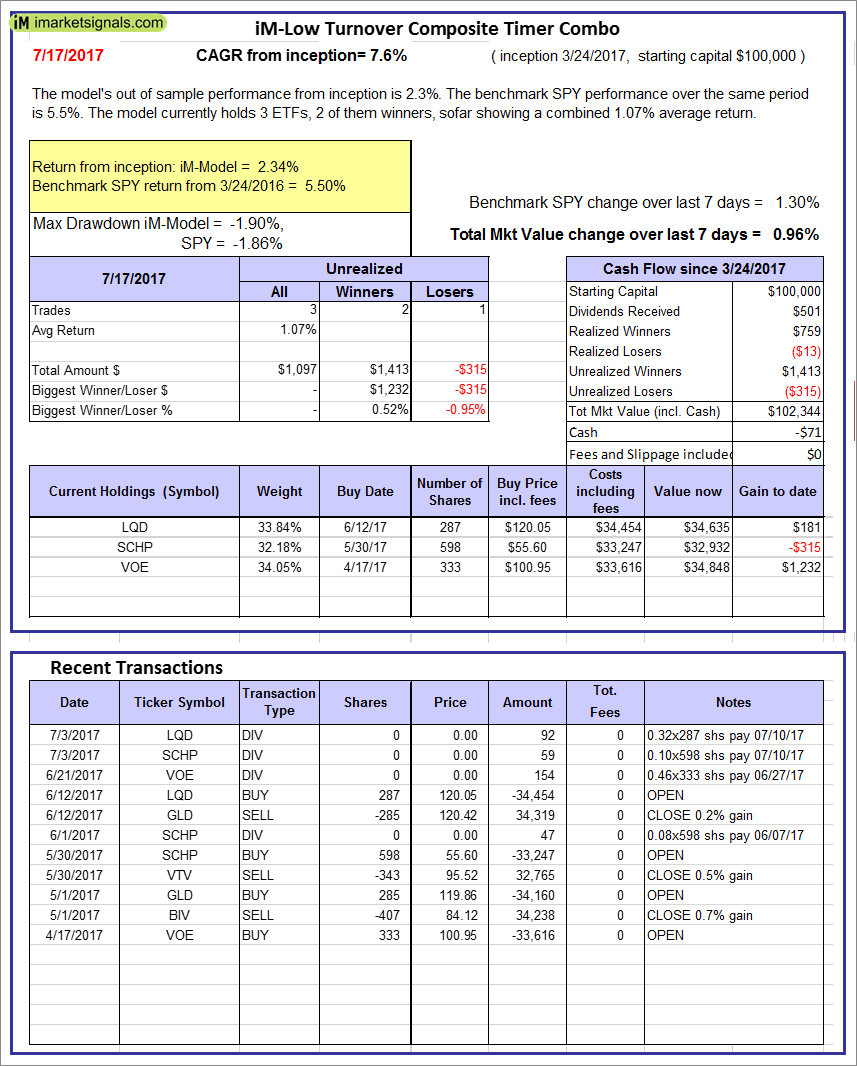 |
iM-Low Turnover Composite Timer Combo: The model’s out of sample performance from inception is 2.3%. The benchmark SPY performance over the same period is 5.5%. Over the previous week the market value of the iM-Low Turnover Composite Timer Combo gained 0.96% at a time when SPY gained 1.30%. A starting capital of $100,000 at inception on 3/24/27 would have grown to $102,344 which includes -$71 cash and excludes $00 spent on fees and slippage. |
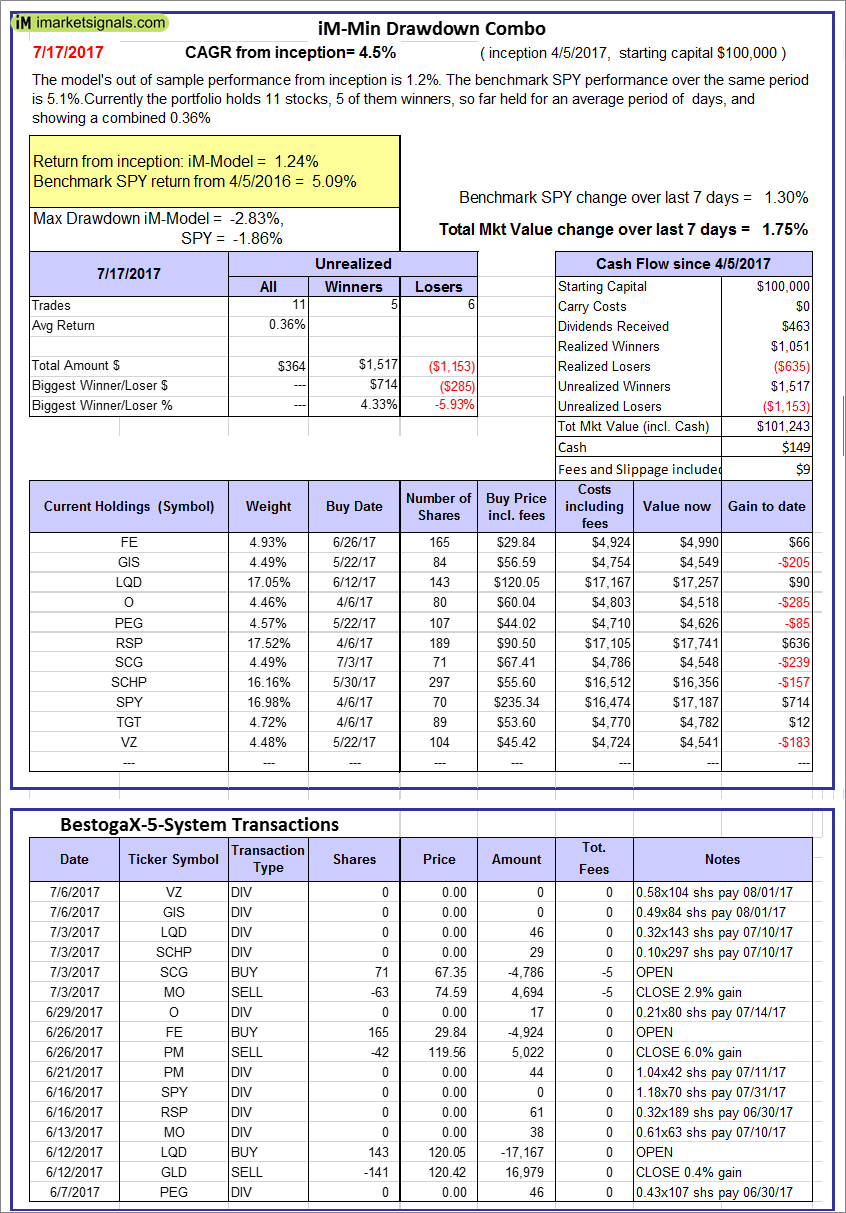 |
iM-Min Drawdown Combo: The model’s out of sample performance from inception is 1.2%. The benchmark SPY performance over the same period is 5.1%. Over the previous week the market value of the iM-Min Drawdown Combo gained 1.75% at a time when SPY gained 1.30%. A starting capital of $100,000 at inception on 4/5/2017 would have grown to $101,243 which includes $149 cash and excludes $09 spent on fees and slippage. |
 |
iM-5ETF Trader (includes leveraged ETFs): The model’s out of sample performance YTD is 11.8%, and since inception 14.9%. Over the same period the benchmark SPY performance was 10.9% and 17.3% respectively. Over the previous week the market value of the iM-5ETF Trader (includes leveraged ETFs) gained 2.78% at a time when SPY gained 1.30%. A starting capital of $100,000 at inception on 10/30/2016 would have grown to $137,272 which includes $552 cash and excludes $1,030 spent on fees and slippage. |
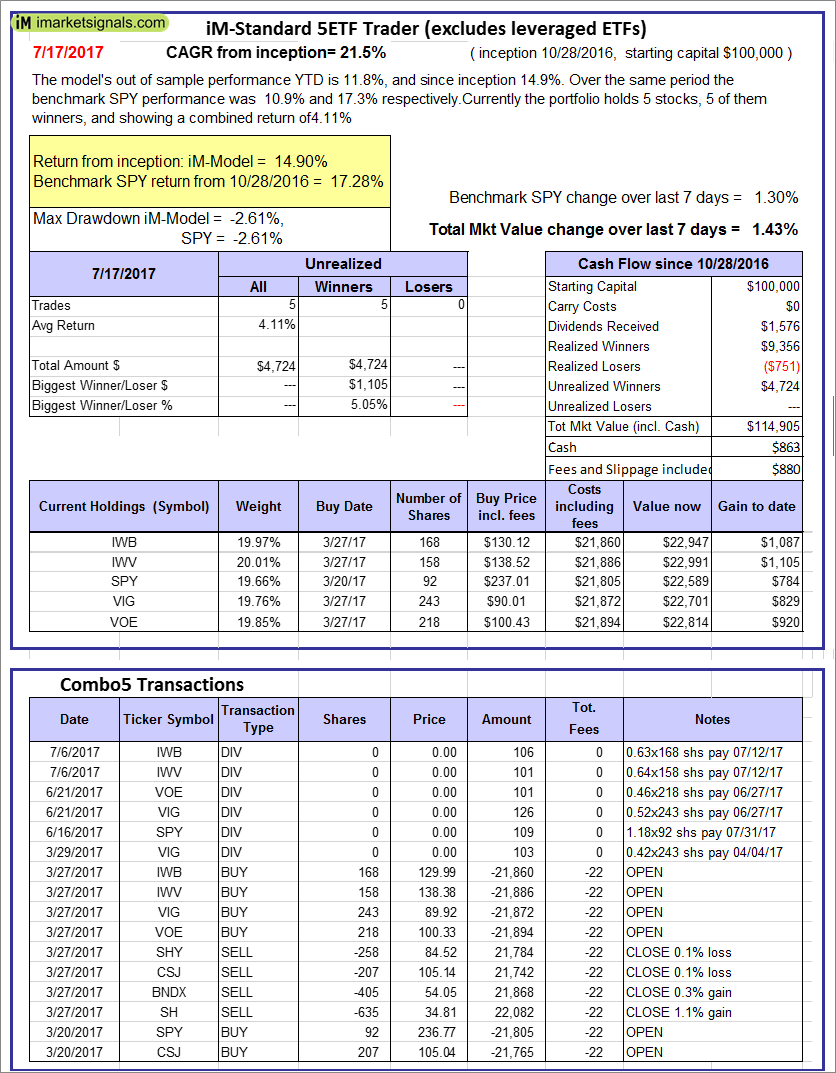 |
iM-Standard 5ETF Trader (excludes leveraged ETFs): The model’s out of sample performance YTD is 11.8%, and since inception 14.9%. Over the same period the benchmark SPY performance was 10.9% and 17.3% respectively. Over the previous week the market value of the iM-Standard 5ETF Trader (excludes leveraged ETFs) gained 1.43% at a time when SPY gained 1.30%. A starting capital of $100,000 at inception on 10/30/2016 would have grown to $114,905 which includes $863 cash and excludes $880 spent on fees and slippage. |
iM-Best Reports – 7/17/2017
Posted in pmp SPY-SH
Leave a Reply
You must be logged in to post a comment.