
- This combination model aims to provide reasonable returns with low drawdowns during all market conditions.
- There are six equal weight component models from Combo6, (five of which are from Combo5 and the BESTOGA3), which are then hedged 25% with the Best10(Short Russell3000), the seventh component model.
Simulated performance of component models
Please refer to the relevant model descriptions for performance curves of the six equal weight component models of Combo6 and the Best10(Short Russell3000).
Simulated Performance of Combo7
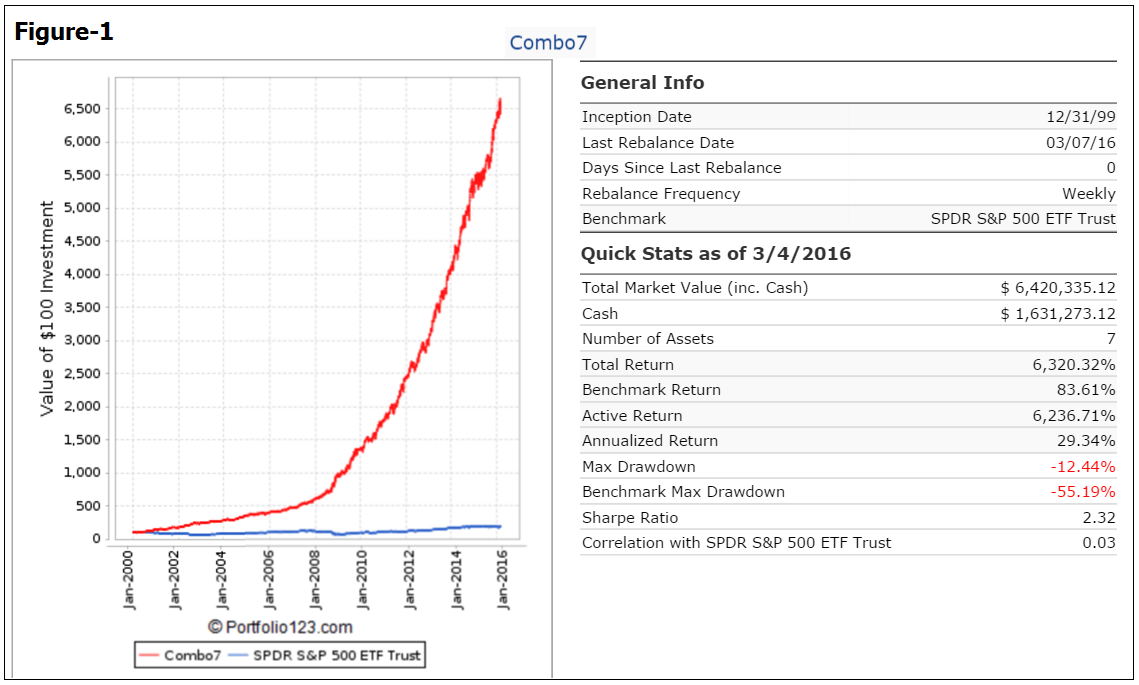
The simulated trading performance of the system from Jan-2000 to Mar-2016 is shown in Figure-1 below. The annualized return would have been 29.3% with maximum drawdown of -12.4%, which includes dividends received/paid and trading costs.
The simulated trading performance of the system from Feb-2014 to Mar-2016 is shown in Figure-2 below. The total return would have been 57.8% with maximum drawdown of -5.1%.
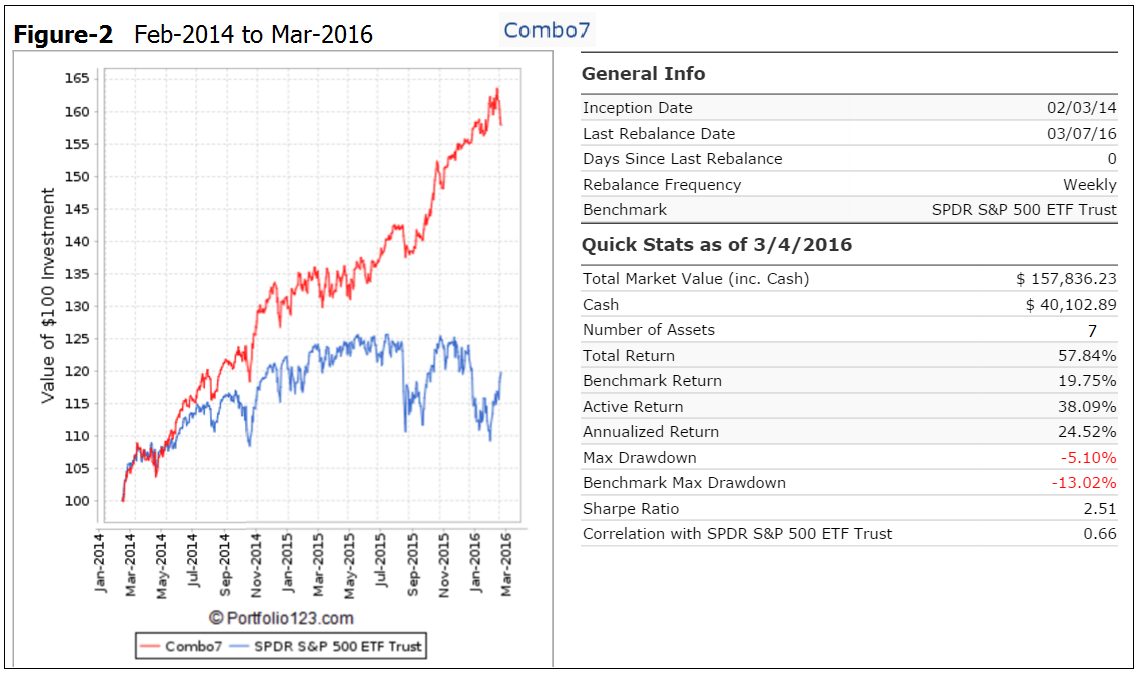
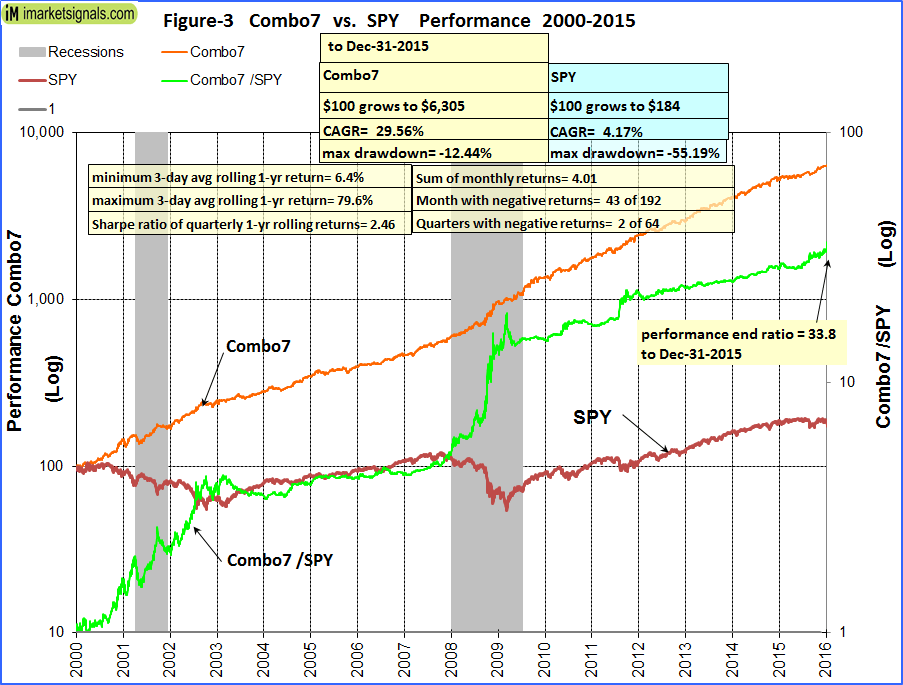
Figure-3 shows performance from Jan-2000 to Dec-2015. The green graph is the performance ratio of Combo7 to SPY. A rising slope of this graph indicates when Combo7 outperformed SPY; Combo7 produced about 34 times the value to December 2015 which one would have had from a buy-and-hold investment in SPY over the same period.
Annual Returns
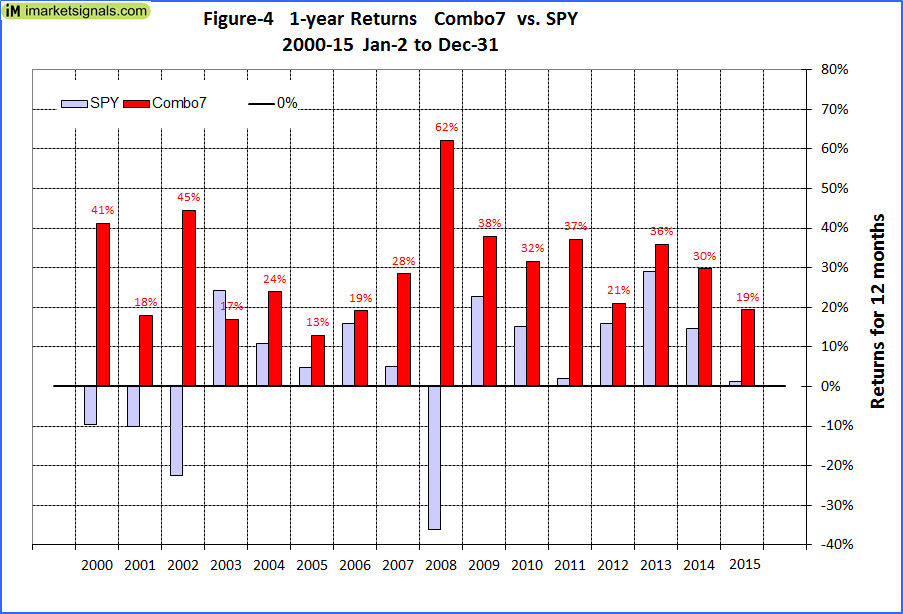
Calendar year performance shown in Figure-4 ranged from a maximum of 62% for 2008 to a minimum of 13% for 2005. There would never have been a loss over any calendar year. Only for 2003 did the model show a lower return than the benchmark SPY.
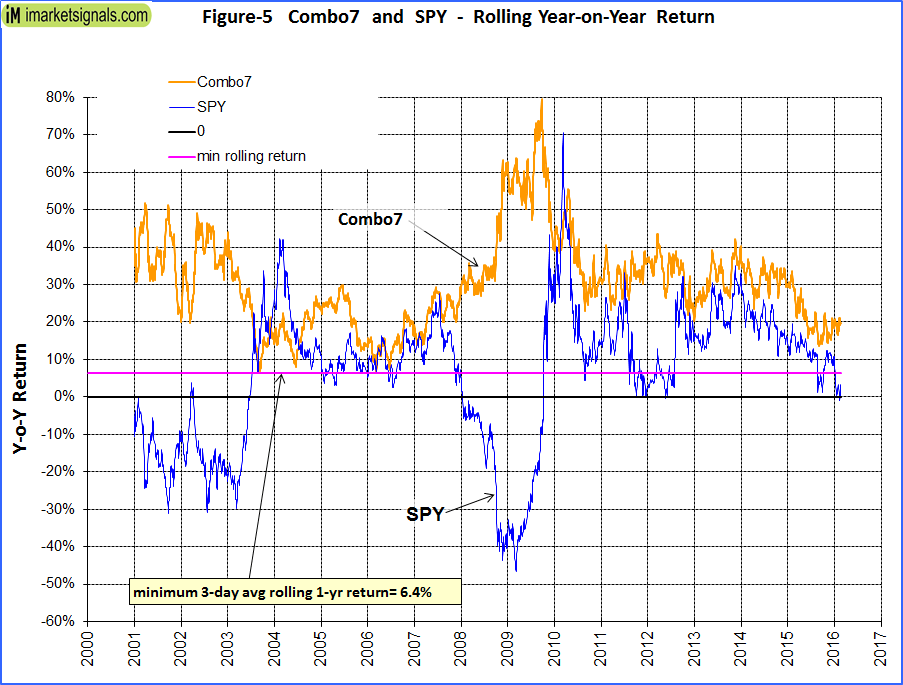
Rolling 1-year returns
Figure 5 shows the rolling 1-year returns starting each trading day from 2000. The minimum return over 12 months would have been 6.4% and the maximum about 80%.
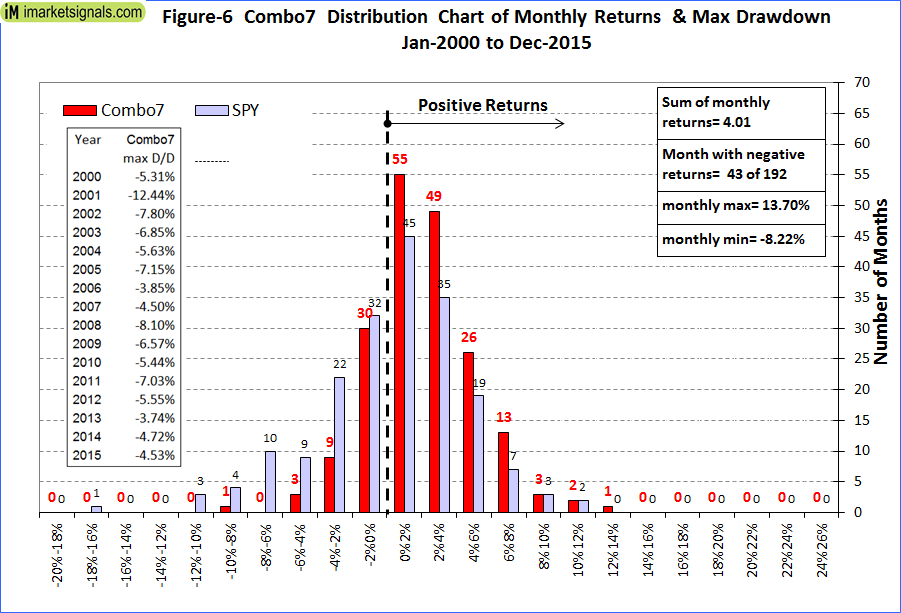
Distribution of Monthly Returns and Max Drawdowns
Figure 6 shows the distribution of monthly returns. There were a total of 192 months in the period under consideration. Combo7 produced positive returns during 149 months and only 43 months had negative returns. SPY had 81 months of negative returns.
Also shown are the maximum drawdowns during each calendar year. The highest D/D of -12.4% occurred in 2001.
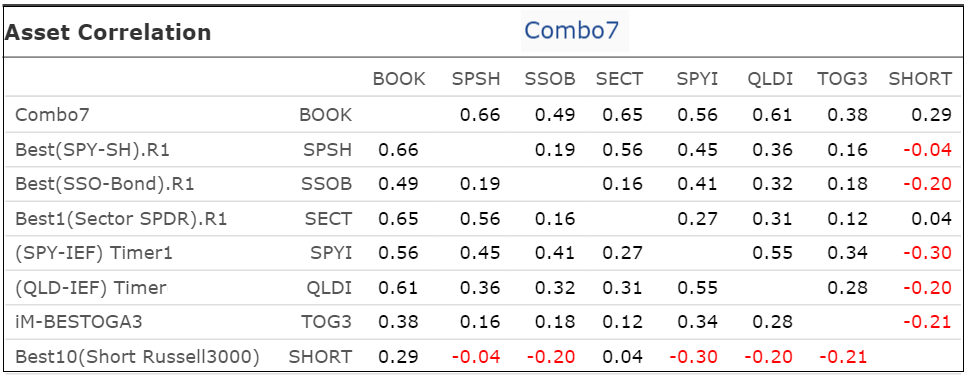
Correlation between component models
The correlation between the component models is fairly low, with 1.0 signifying 100% correlation. The Short model has mostly negative correlations with the other models.
Following the Model
Since all component models of Combo7 are available live at iMarketSignals, a separate detailed and dedicated weekly update will not be made, however its performance can be monitored in the weekly performance tables.
Note: The algorithm of Best10(Short Russell3000) has a 15% stop-loss provision. However, the models are rebalanced weekly and trades are assumed to be done on the first trading day of the week, usually on Mondays. Theoretically a short position could lose 15% on a Tuesday, but the system would only sell it the following Monday. By that time the loss could be much higher than 15%. Thus in real live-trading it would be prudent to have automatic stop-loss provisions in place.
Disclaimer
One should be aware that all results for the Combo7 system are from a simulation and not from actual trading.
All results are presented for informational and educational purposes only and shall not be construed as advice to invest in any assets. Out-of-sample performance may be much different. Backtesting results should be interpreted in light of differences between simulated performance and actual trading, and an understanding that past performance is no guarantee of future results. We can make no claims about future performance of this combination model, which may include significant potential for losses. All investors should make investment choices based upon their own analysis of the asset, its expected returns and risks, or consult a financial adviser. The designer of this model is not a registered investment adviser.
Georg,
Could you do this work up using the 5 slot large cap short model?
Thamks
According to the bottom right box in Figure 3 above, the model is 75% Combo6 and 25% Best10 Short. What would the returns, max DD etc. be if the model was 100% Combo6 with the 25% Best10 Short being put on using 25% margin?
Can you also please list the Win Rate, Turnover and Average Days Held.
Admittedly the allocation percentages shown on Figure-3 are confusing. The allocation of Combo 6 in Combo 7 is 100%, with 25% Best10 Short on margin.
We use Portfolio 123 for our simulations. At P123 there is no direct provision to model a long/short portfolio. However, there is a workaround to do this. In a combo the P123 algorithm allocates 100% of the money to all models with the percentages stipulated by the user. Thus for Combo7 with the short model at 25%, the algorithm allocates 25% of the funds to the short model and 75% to the six long models. Since we short on margin, 100% of the cash should be allocated to the long models. One has to therefore first leverage the long models by a factor of 1.333 (100/75) before placing them into the combo.
We have verified this in an excel spreadsheet which rebalances monthly between the long and shorts and found that this is an acceptable method. You can read a discussion of this on P123 forum:
https://www.portfolio123.com/mvnforum/viewthread_thread,7669#39100
So at the end of the day an investment in the “im combo 7” would actually look like this ?
$100 invested in Combo 6 = Combo 5 (5 ETF’s) & BESTOGA3 (3 stocks)
hedged by:
$25 invested in BEST10 (10 stocks short in Russell 3000)
No, that is not correct.
$100 is invested in Combo6, which is all long the market. One would then need to borrow stocks worth $25 to sell. So the cash needed is only $100.