
- This combination model aims to provide reasonable returns with low drawdowns during all market conditions.
- There are six equal weight component models in Combo6, five of which are from Combo5 and the BESTOGA3 is the sixth component model.
Simulated performance of component models
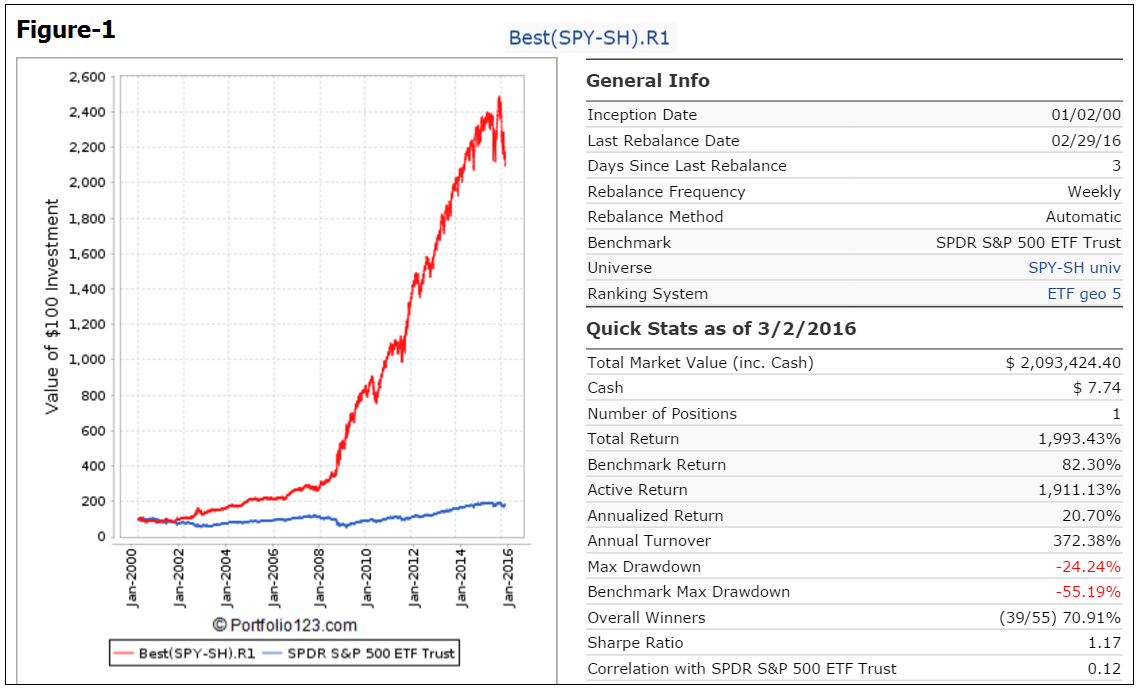
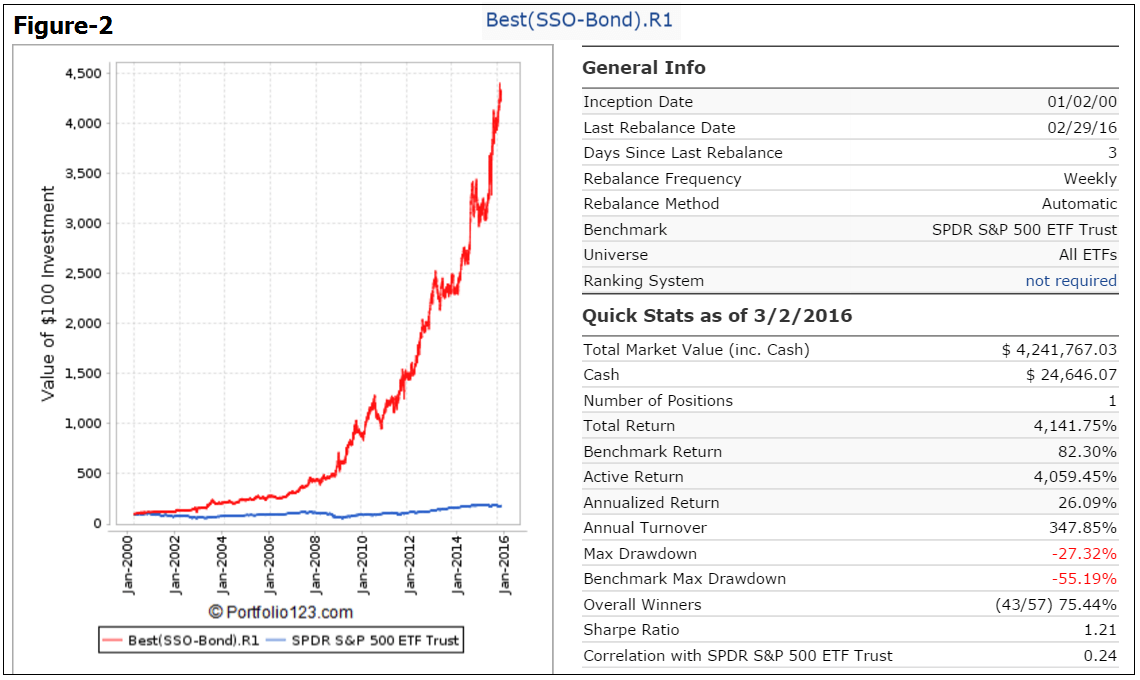
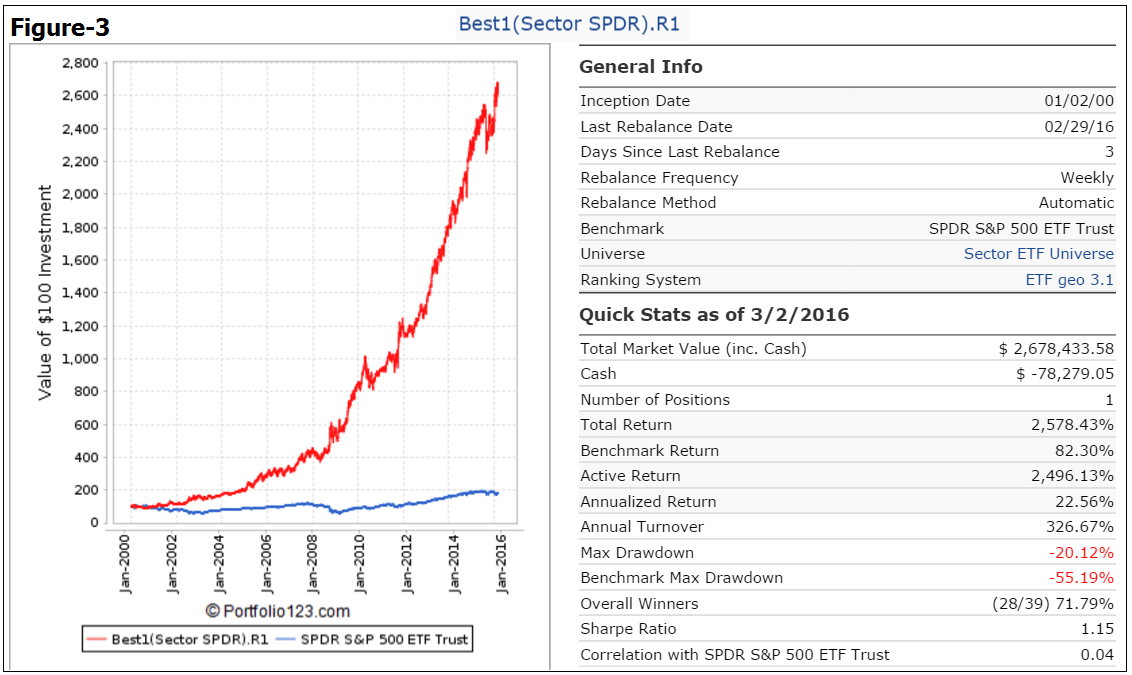
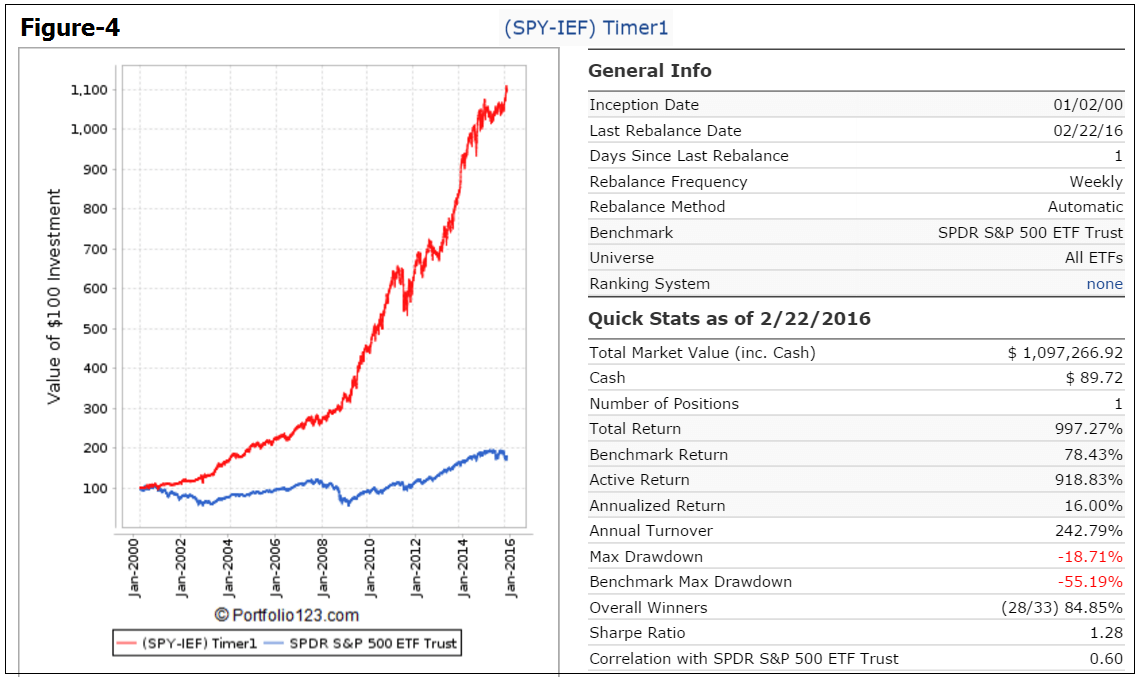
The performance curves of the six equal weight component models of Combo6 are shown below.
(Figure-1) Best(SPY-SH).R1 ,
(Figure-2) Best(SSO-Bond).R1,
(Figure-3) Best1(Select SPDR).R1 ,
(Figure-4) (SPY-IEF) Timer1,
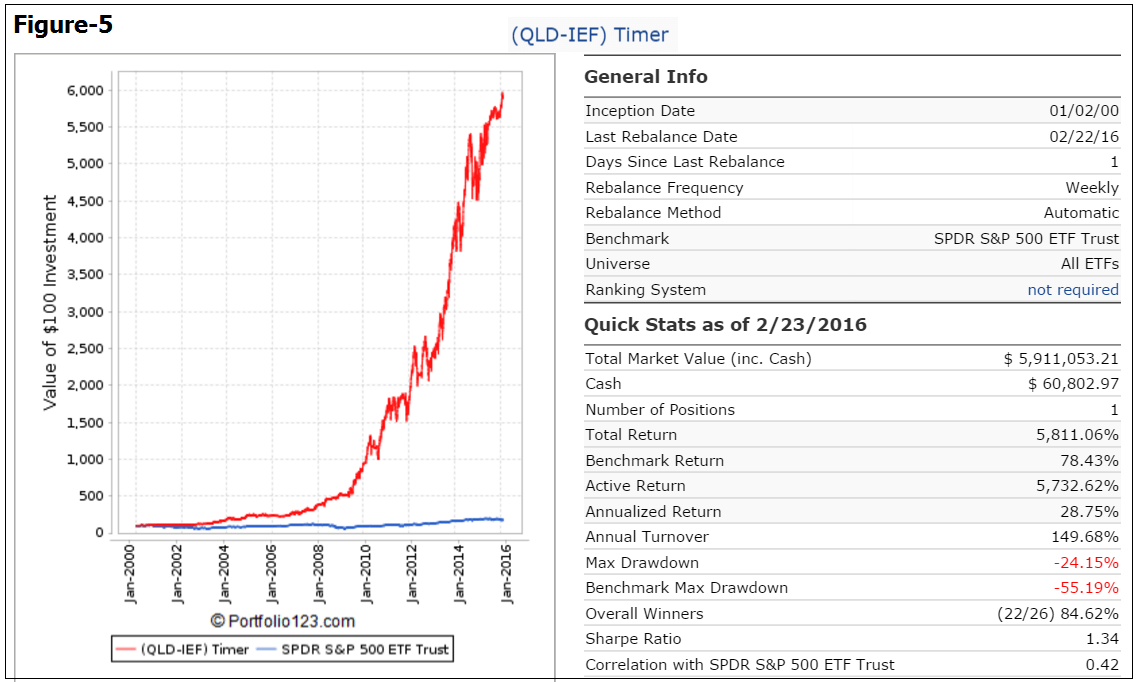
(Figure-5) (QLD-IEF) Timer, and
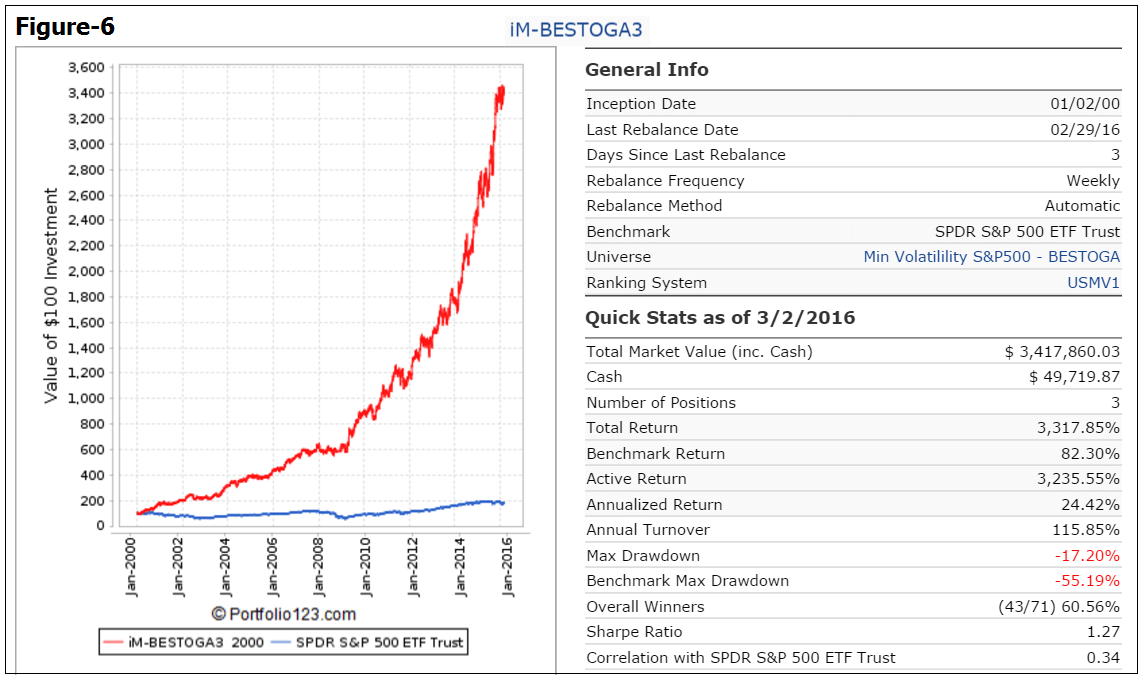
(Figure-6) BESTOGA3.
Simulated Performance of Combo6
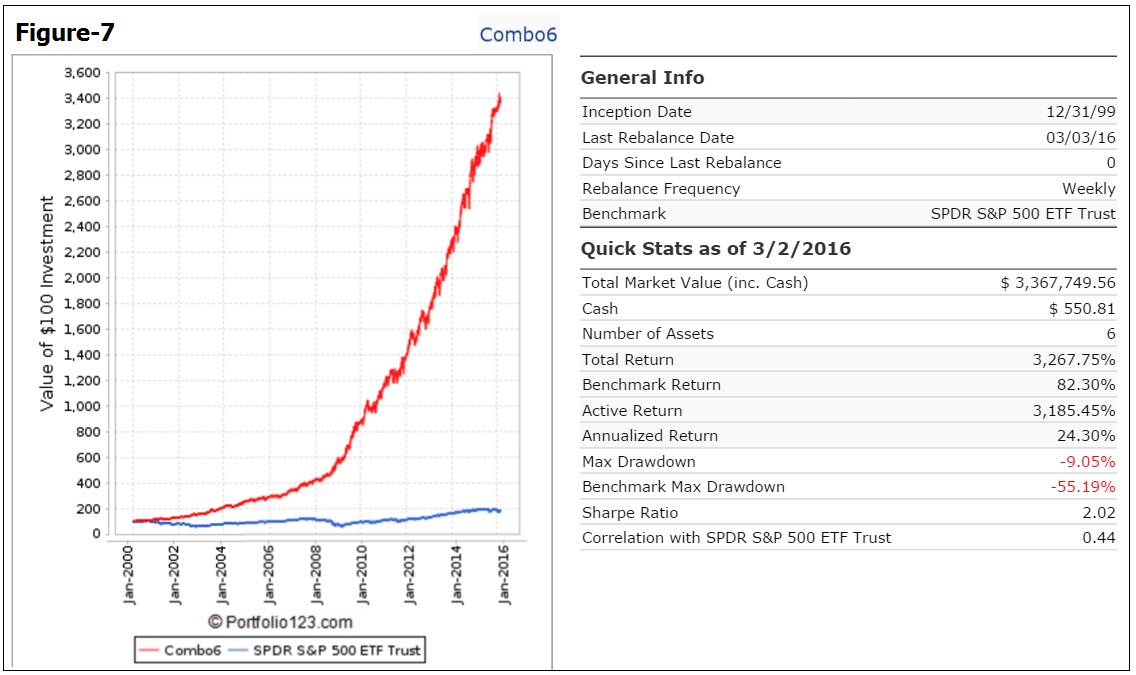
The simulated trading performance of the system from Jan-2000 to Mar-2016 is shown in Figure 7 below. The annualized return would have been 24.3% with maximum drawdown of -9.1%. All values are with dividends reinvested.
The simulated trading performance of the system from Feb-2014 to Mar-2016 is shown in Figure 8 below. The total return would have been 52.8% with maximum drawdown of -6.1%.
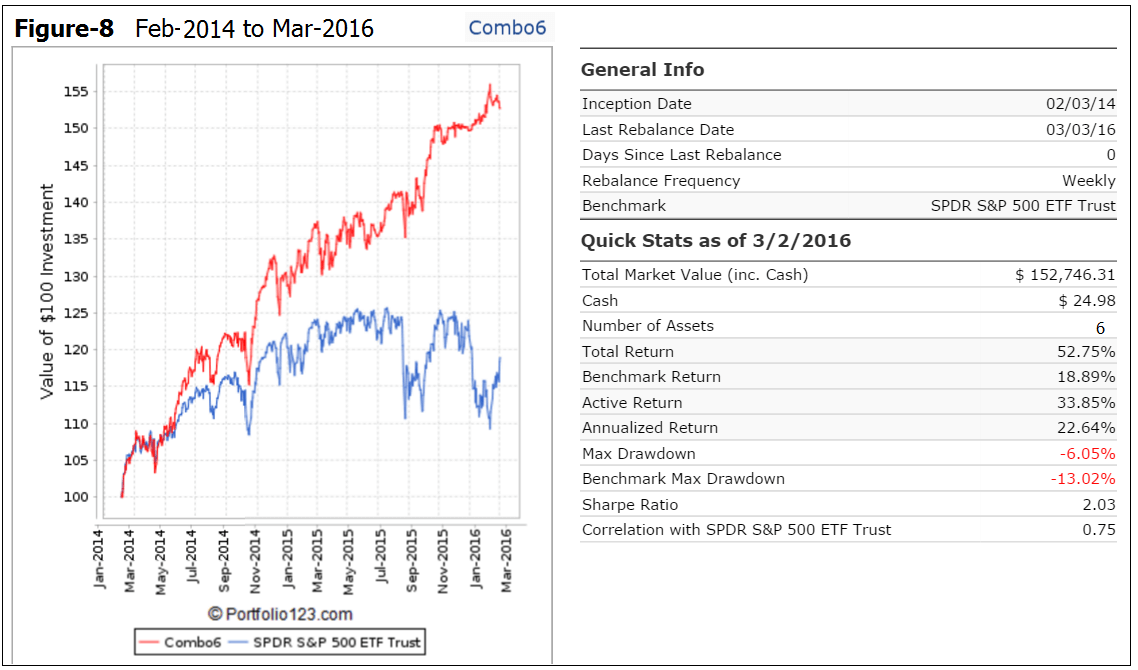
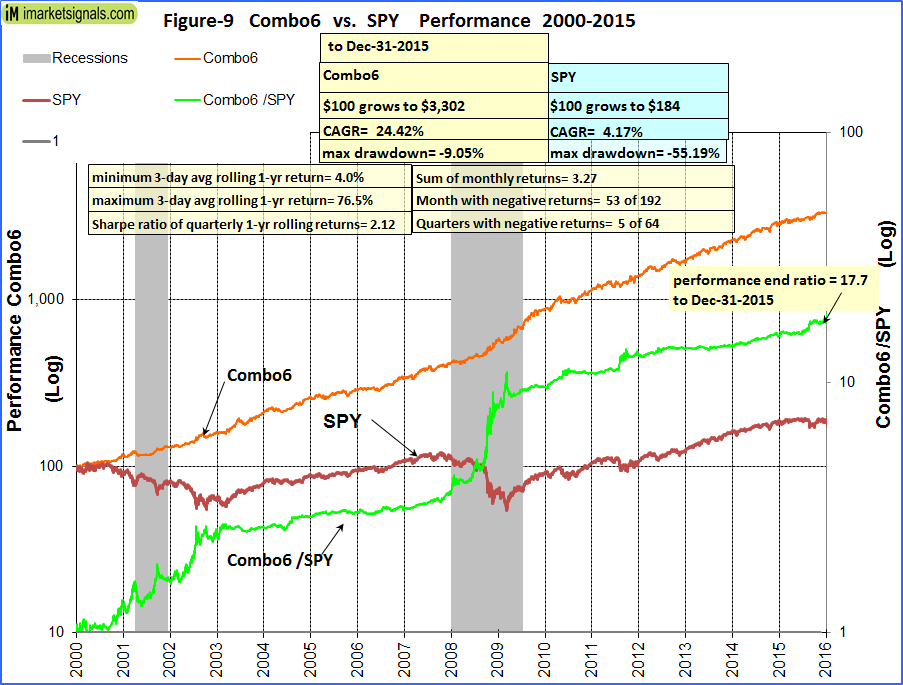
Figure-9 shows performance from Jan-2000 to Dec-2015. The green graph is the performance ratio of Combo6 to SPY. A rising slope of this graph indicates when Combo6 outperformed SPY; Combo6 produced about 18 times the value to December 2015 which one would have had from a buy-and-hold investment in SPY over the same period.
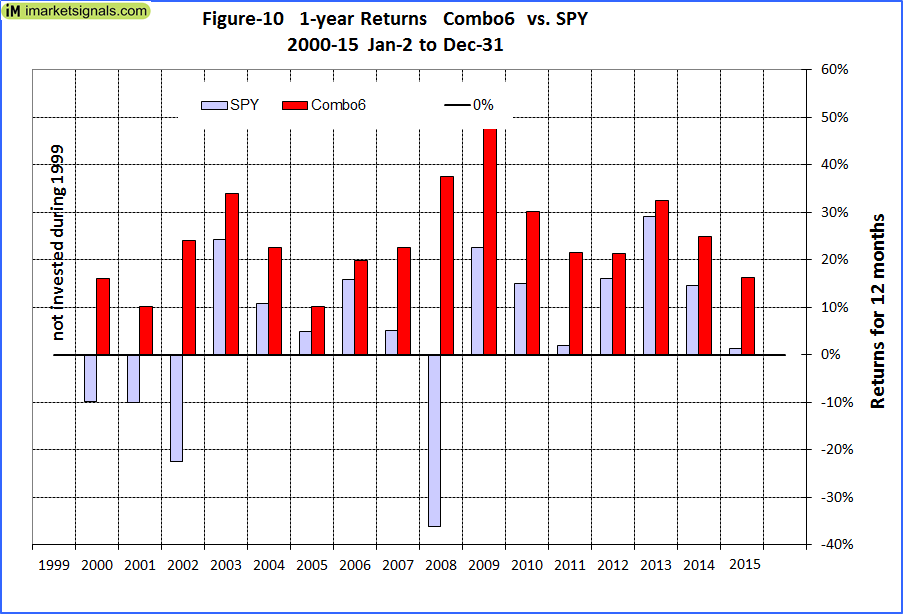
Annual Returns
Calendar year performance, shown in Figure-10, ranged from a maximum of 48% for 2009 to a minimum of 10% for 2001 and 2005. There would never have been a loss over any calendar year.
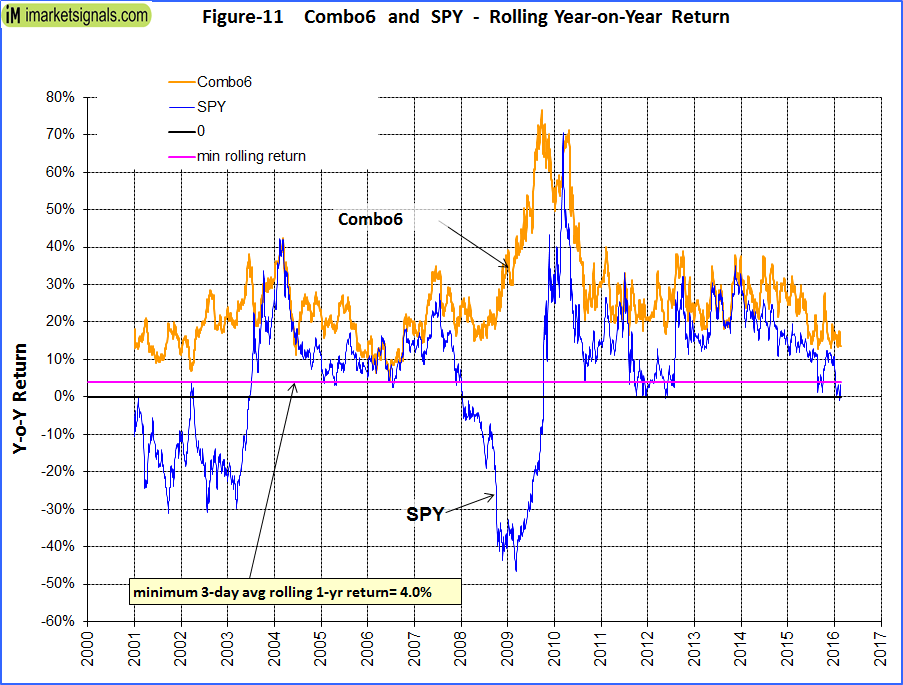
Rolling 1-year returns
Figure 11 shows the rolling 1-year returns starting each trading day from 2000. The minimum return over 12 months would have been 4% and the maximum about 80%.
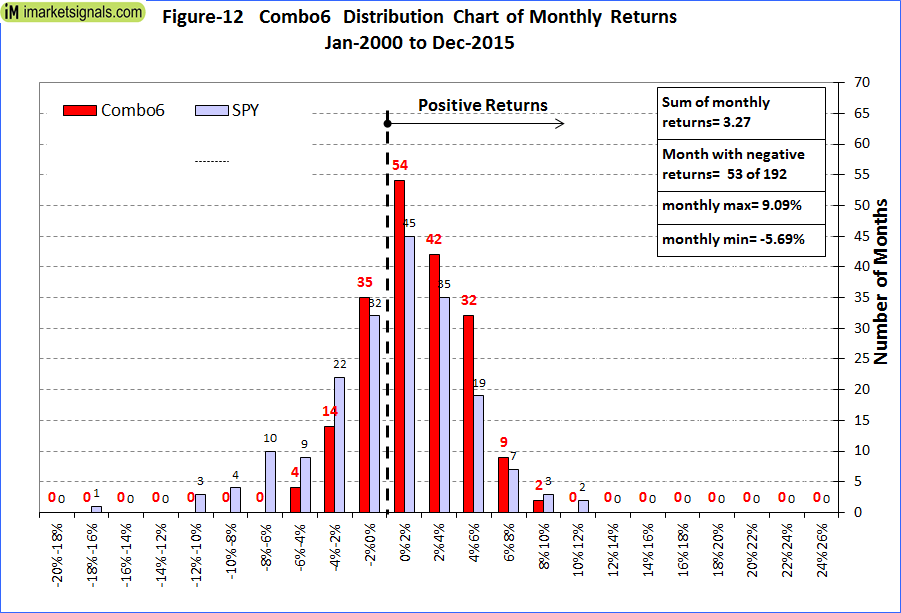
Distribution of Monthly Returns
Figure 12 shows the distribution of monthly returns. There were a total of 192 months in the period under consideration. Combo6 produced positive returns during 139 months and only 53 months had negative returns. SPY had 81 months of negative returns.
Correlation between component models
The correlation between the component models is fairly low, with 1.0 signifying 100% correlation.

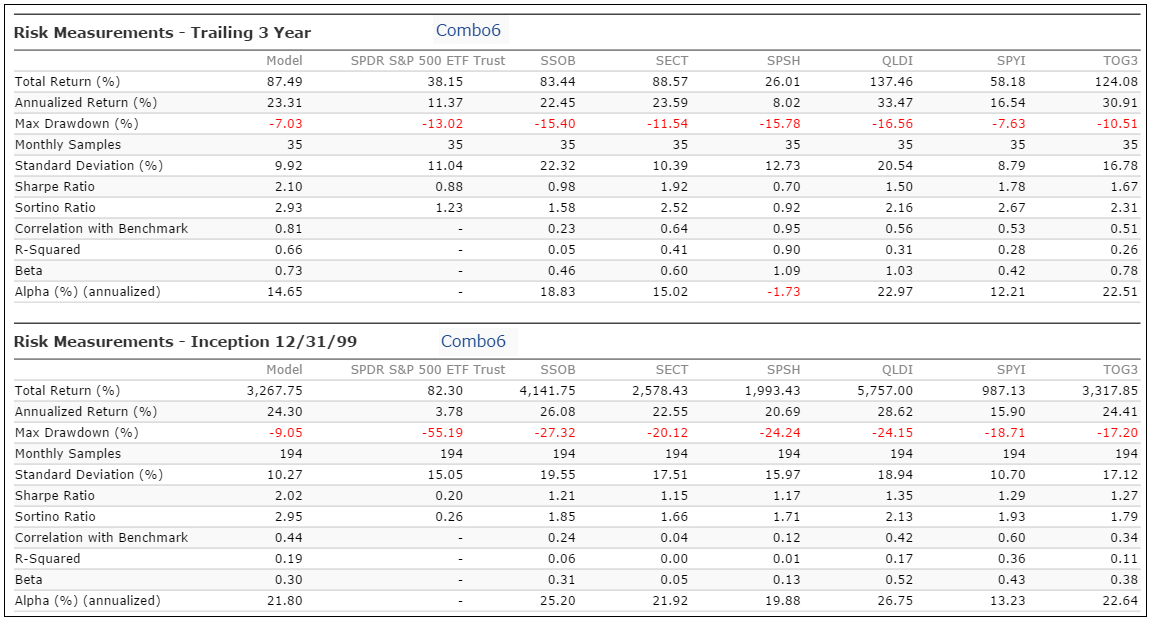
Risk Measurements
The table below highlights the advantage of combining models. For example, the maximum drawdowns from inception range from -17.2% to -27.3% for the six component models. But when combined the drawdown becomes only -9.1%.
Following the Model
Since all component models of Combo6 are available live at iMarketSignals, a separate detailed and dedicated weekly update will not be made, however its performance can be monitored in the weekly performance tables.
Disclaimer
One should be aware that all results for the Combo6 system are from a simulation and not from actual trading.
All results are presented for informational and educational purposes only and shall not be construed as advice to invest in any assets. Out-of-sample performance may be much different. Backtesting results should be interpreted in light of differences between simulated performance and actual trading, and an understanding that past performance is no guarantee of future results. We can make no claims about future performance of this combination model, which may include significant potential for losses. All investors should make investment choices based upon their own analysis of the asset, its expected returns and risks, or consult a financial adviser. The designer of this model is not a registered investment adviser.
Just want to make sure I am reading the allocation correctly ? 6 equal weighted holdings would be as follows..currently @ 16.67% each would be :
SH
SSO
XLV
1/2 IEF & 1/2 SPY
1/2 IEF & 1/2 QLD
MO,PM & TAP
Is this correct for 3-14-2016 ?
On 3/13/2016 we emailed the following signal for Combo5
iM-Combo5
As SH and SSO are opposing positions, Combo5 effectively holds 40% IEF, and 20% each SPY, XLV and 20% cash.
2x IEF,
1x SSO,
As, ProShares Short S&P500 (SH) seeks daily investment results that correspond to the inverse (-1x) of the daily performance of the S&P 500, the ProShares Ultra S&P500 (SSO) seeks daily investment results that correspond to two times (2x) the daily performance of the S&P 500, both before before fees and expenses. Therefore, it is prudent not to hold simultaneously SH and SSO, but rather to hold SPY and cash.
The holdings for BESTOGA3 are: MO, PM and TAP.
iM-Combo6 is 83.3% Combo5 and 16.7% BESTOGA-3, or 6 equal weighted holdings 5 of which are those from the components of Combo5 and the sixth the Bestoga3 model as a whole.
Bestog3
Combo6
PM
6xIEF
I was expecting a QLD position ?
QLD-IEF is in IEF, and (SPY-IEF)Timer1 is in IEF, hence 40% IEF
Anton…I am confused. In your 3/13 notification, the SPY-IEF timer switched from 100% IEF to 50% SPY and 50%IEF. If that is the case, how can Combo6 be at 40% IEF? Wouldn’t it be 30% IEF (if the QLD-SPY model is still at 100% IEF)
I would like to request that the QLD-IEF timer signals be published separately so that we can know how to add up the different components ourselves in order to avoid possible errors.
Thanks!
Anton,
I did not see your response to macor8’s question.
I also feel, the allocation effective March 14th would be 40% IEF, only if the SPY-IEF was 100% in IEF, which is not the case since March 14th. It is 50% SPY & 50% IEF.
Can you please clarify whether this was a math error on your part?
By the way, you folks have made the same math error in March 21st signal email and post here. This continues to be incorrect because you are not updating 1 out of the 5 components i.e., the SPY-IEF component.
Thanks
It is not an error.
The components of Combo5 are listed in the model description. Please note that the (SPY-IEF)Timer1 of Combo5 is a single model, and is not the same as the iM-Best(SPY-IEF)Market Timer which is a combo of three market timing models.
Anton,
This is a great combination of strategies.
What time period did the maximum drawdown of 9.05% occur in Combo6?
Was it in 2008?
Thanks.
It was in 2011. In 2008 the simulation shows a max D/D of -5.8%.
Thanks Georg. This clearly proves your point, that the best MAR ratio is being derived by combining more and more of your component strategies together. It is also interesting that the max. drawdown shifted from 2010 in Combo5 to 2011 in Combo6. And for 2008, the max. drawdown of 5.8% for Combo6 is lower than 6.97% for Combo5.
Combo6 has overall a better CAGR and lower max. drawdown than the already fabulous results of Combo5.
Would you consider sharing a Master Excel spreadsheet of monthly returns & drawdowns of all strategies with “Gold” & above subscriber levels? I think this will help all your fans get involved in assisting you with coming up with future Combos. I would be willing to participate for sure.
RV
Hi Georg –
What happened to the real performance in 2016 for Combo5 & 6? What were the main reasons for not performing like the backtest?
The Combo5 did not come even close to its benchmark performance AND it also did only 10% of the back-tested performance (2% annual return in 2016 vs. 20% plus back-tested).
Even when combined with Bestoga 3 for a Combo 6, the performance still lagged significantly from back-tests and against the S&P 500.
Most of your market timers were showing being long and in the market, but Combo5 stayed underinvested in the market and overinvested in IEF throughout 2016.
I noticed all of the Best12(USMV)- Q1-Q4-Investor models did well in 2016. I don’t know what the drawdowns were. Is there a way for you to back-test a new Combo by putting in say Best12(USMV)- Q3-Investor at 25% and 75% in Combo6 for a new Combo7b? If the CAGR and drawdown improve, then you could publish this new combo or at least by providing the backtest, you could enable us to make an informed decision of how to invest in 2017.
It was quite frustrating to get less than 3% returns in a year like 2016 with Combo6 even though the drawdown was very small. :-)
I know you cannot provide investment advice. But I was wondering if you could comment on how you are investing in your personal accounts? I am assuming you utilize some of the signals in the subscription to manage your own money.
Thanks for all the good work. Look forward to a better 2017.
Regards,
RV
RV,
All models can underperform for a while. Backtest performance is not a guarantee of future performance. As you pointed out correctly the component models of Combo5 were holding IEF for long periods in 2016 which resulted in no gain since the combo went live in Feb 2016.
Also the Bestoga3 stocks did not match the performance of SPY. Therefore the combination Combo5 and Bestoga3 prduced disappointing results.
The Best12(USMV) models have been live since July 2014 and they cannot be backtested from an earlier date because they take their stock holdings from the ETF USMV. There is no historic information on the holdings of USMV available.
Obviously I use the signals from the various models for my own investment decisions.
Best,
Georg