
- This model selects periodically up to 10 stocks of the Russell 3000 index to sell short. It is intended to run in combination with long portfolios.
- Stocks having a market-cap less than $800-million and those having a 10-week average daily total amount traded (price x volume) of less than $6,000,000 are not sold short.
- Stocks from the GICS sub-industries: Distillers & Vintners, Brewers, Tobacco, Casinos & Gaming, and Biotechnology are also excluded from being selected.
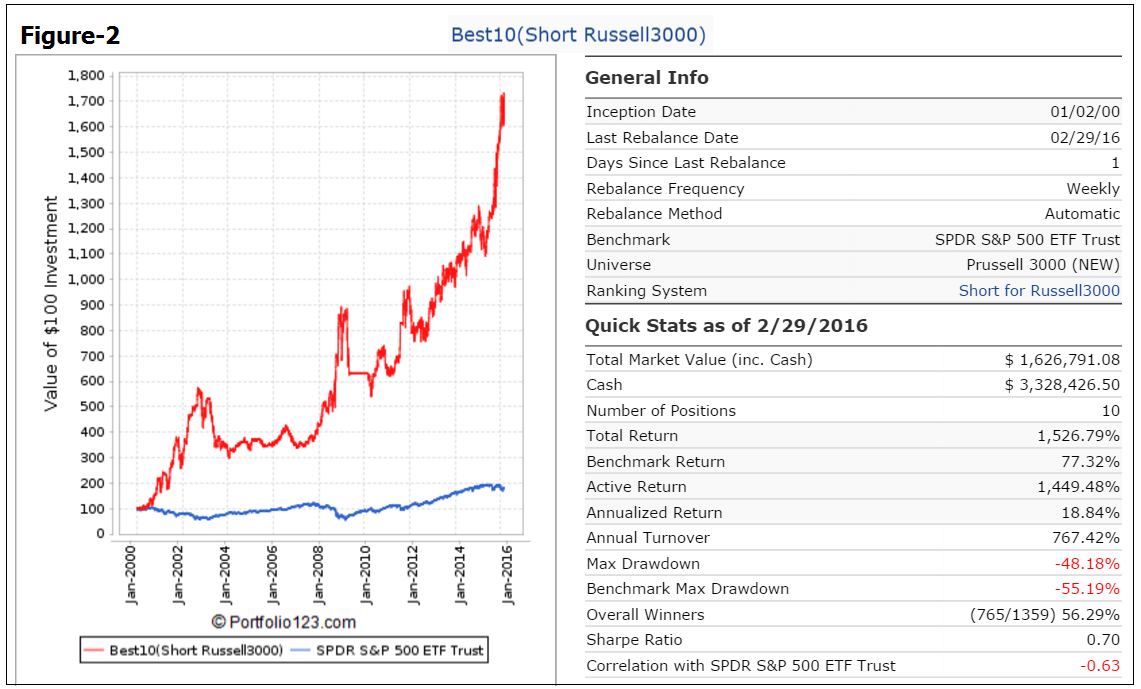
- Simulated performance on its own over a 16 year backtest period shows an annualized return of 18.8% with a maximum drawdown of -48%.
Ranking System
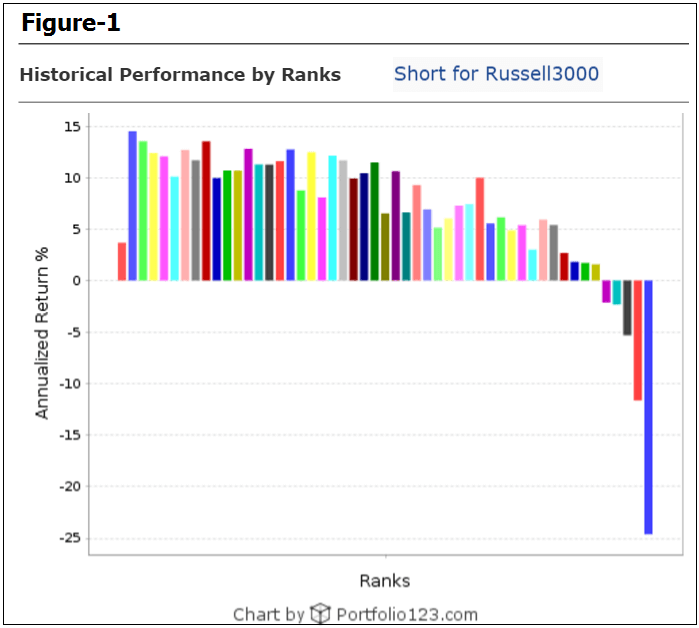
All stocks in the Russell 3000 index are ranked.
Figure-1 shows performance for 50 “rank-buckets”, in rank increments of 2. It is apparent that stocks with a rank 98-100 produces the highest losses of about -25%. However, stocks with ranks higher than 90 all show negative performance as well.
Some Rules
The model holds optimally 10 stocks, each position having a nominal weight of 10%.
Stock to be sold short must have a closing price higher than $5.00, and also to assure reasonable liquidity stocks must have a market-cap greater than $800-million and 10-week average daily total amount traded (price x volume) of more than $6,000,000.
Positions are covered when the rank becomes less than 98, or when the weight of a position exceeds 14%, or when the weight of a position declines to less than 8%. Also there is a stop-loss of -15% in the rules.
Simulated Performance
The simulated trading performance of the system from Jan-2000 to Feb-2016 is shown in Figure 1 below. The annualized return would have been 18.8% with maximum drawdown of -48.2%. The model performed well over the last three years despite prevailing up-market conditions to mid-2015.
Trading assumptions:
- Commission: $1.00
- Slippage: 0.20% of Total Trade Amount
- Margin Carry Cost: 3.0%
- Min Maintenance Margin: 40.0%
Holdings
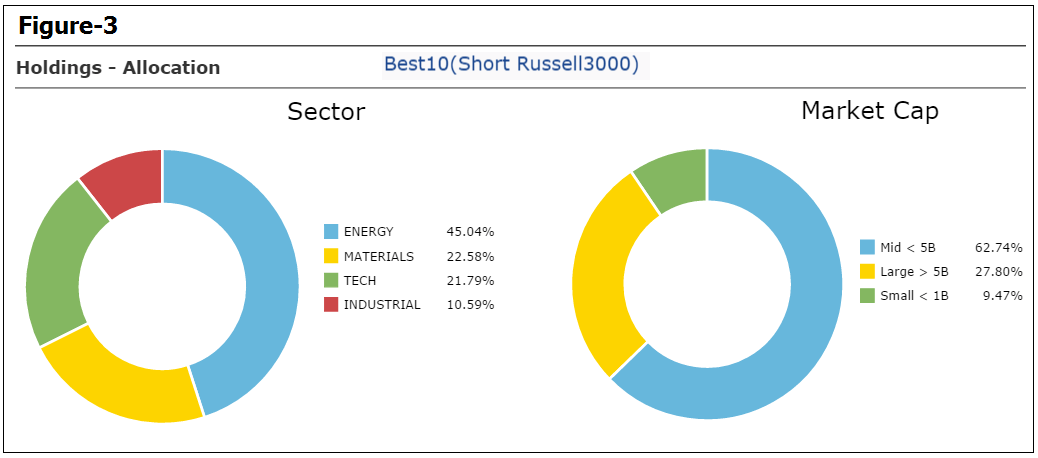
The market-cap and sector allocation of current holdings is shown in Figure-3. The model selects mainly mid- and large-cap stocks. At the end of Feb-2016 stocks in the energy sector had the most weight of about 45%.
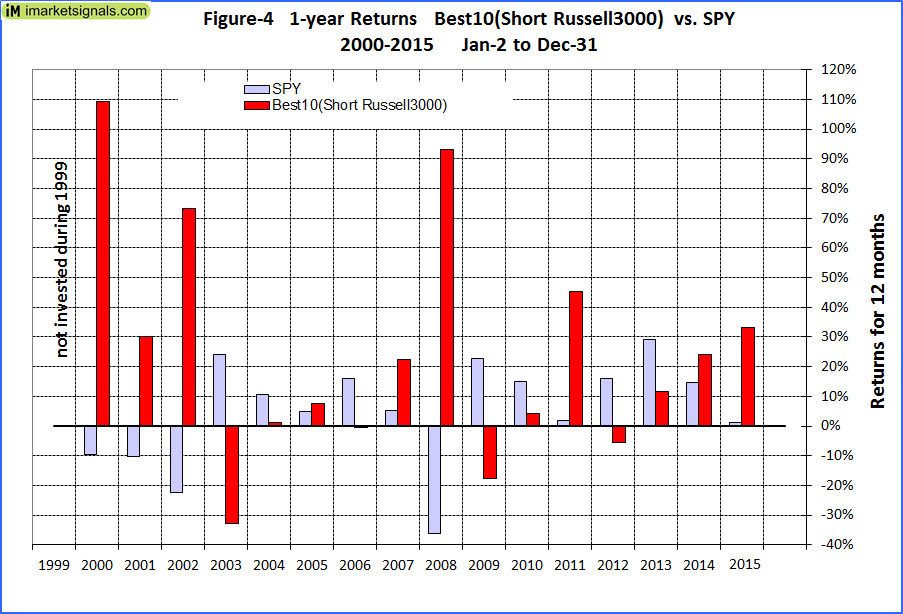
Annual Returns
Calendar-year returns are shown in Figure-4. The model did best when returns for SPY were negative or small.
Following the Model
This model can be followed live at iMarketSignals (requires Gold subscription), where it will be updated weekly together with our other trading- and macro models.
Note: The algorithm of Best10(Short Russell3000) has a 15% stop-loss provision. However, the models are rebalanced weekly and trades are assumed to done on the first trading day of the week, usually on Mondays. Theoretically a short position could lose 15% on a Tuesday, but the system would only sell it the following Monday. By that time the loss could be much higher than 15%. Thus in real live-trading it would be prudent to have automatic stop-loss provisions in place.
Disclaimer
One should be aware that all results for the Best10(Short Russell3000) system are from a simulation performed on the online stock trading simulation platform Portfolio 123, not from actual trading.
All results are presented for informational and educational purposes only and shall not be construed as advice to invest in any assets. Out-of-sample performance may be much different. Backtesting results should be interpreted in light of differences between simulated performance and actual trading, and an understanding that past performance is no guarantee of future results. We can make no claims about future performance of this model, which may include significant potential for losses. All investors should make investment choices based upon their own analysis of the asset, its expected returns and risks, or consult a financial adviser. The designer of this model is not a registered investment adviser.
This is fantastic. Can you tell me more specifically, the dates of the equity highs in 2002-03 and 2008-09?
Tom C
Sep-2002 and Mar-2003
Dec-2008 and Mar-2009
Is it possible for you to post performance figures when this short model it is run with the long models at various percentages short?
For example a chart that shows:
Return, Max DD, Sharpe, 1 yr rolling return of each iMarketSignals long model when paired with this short model at 50% and 100% short.
We will show this in a future report.
Greetings,
Can you please explain the differences between this model and the iMBest large cap short model, besides the obvious. I’m curious why one would use one over the other especially as it relates to the combo5 combo6, variants.
Thanks,
Jon
The Best(Short) Large-Cap System only selects large-cap stocks and there are many periods when it cannot find 5 stocks to sell short. The Best10 Shorts from the Russell 3000 appears to find all 10 stocks more often because mid-caps are also included in the universe.
The downside of this model may be a liquidity problem if there are too many investors following this model.
We will test how they affect performance when paired with different long model combinations.
When you run the performance of the combinations using the Best10 Shorts model with the long models, please include the Best8 MinVol Tax Efficient. Thanks.
I noticed in this model that two of the biggest draw-downs (in 2003 and 2009) occurred during periods where the new SH-Cash Standard Timer seemed to have already closed its SH position and went back to cash.
Yet this Best10 short model has been successful staying short during the 5-year period where the Standard Timer was in cash from 2010-2015.
Is there anyway to combine aspects of both models to show the performance if the Best10 short model would follow the rules of the Standard Timer and close all short positions under specific conditions that imply the market is coming off a major bottom and all stocks are likely to rise. For instance a rule that the Best10 system would follow any signals the Standard Timer produces that tell it to close short positions within 18 months of the end of an NBER recession period as sort of a washout period. And then after that period it would revert to following its own signals to short the 10 lowest ranked stocks?
I really like the idea of this model as a hedge against some of the long Combo models, but the 48+% max DD is scary!
Thanks,
Ryne