
- The Trailing Twelve Months Income Available to Common Stocks (TTMIACS) of the S&P500 is tightly correlated to the S&P 500.
- TTMIACS has been declining since Feb-2015 when its 10-week moving average crossed its 40-week moving average to the downside.
- Exiting the stock market according to this indicator would have avoided major losses in 2001 and 2008.
- According to this indicator, a downwards potential remains in the S&P 500 with a possible low of 1660 in the next three months.
The Trailing Twelve Months Income Available to Common Stocks (TTMIACS) is defined as income before extraordinary items and discontinued operations less preferred dividends. This data is mainly updated every quarter during the earnings season, with little change in between.
Over the backtest period from 1999 to 2015 there have only been three occurrences when the 10-week moving average TTMIACS moved convincingly below its 40-week moving average. Stocks cannot indefinitely continue to advance when the income to common stockholders declines. After the signals in May-2001 and Dec-2007 the market lost 35% and 50%, respectively, and these signals were near the beginning of the respective NBER recessions. The third signal occurred end of Feb-2015.
In our November 2015 article we wrote “According to this indicator a major decline of the stock market should follow.” Now we try to answer by how much the S&P 500 is overvalued.
For the period 1/3/2000 to the present, the S&P500 and the TTMIACS are correlated to 83.5%, which is an extremely high statistical match.
Figure 1 charts SPY and TTMIACS, the later is scaled so that the error between SPY and a scaled TTMIACS is minimized. On the premise that a fixed ratio between S&P 500 and the TTMIACS exists, then the conclusion is reached that the S&P 500 is currently overvalued, as was the case in 2000 prior to the 2001 recession.
Applying this fixed ratio to the current value of the 10wk moving average of TTMIAC indicates a downward potential of the S&P 500 with a possible low of 1660 in the next three months.
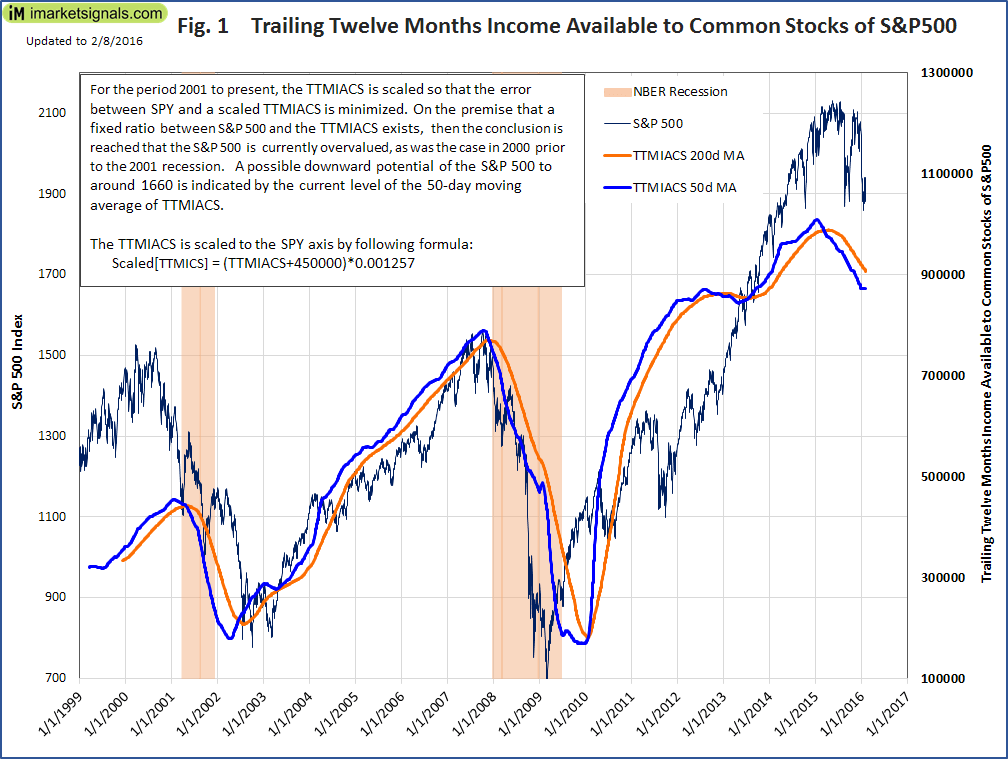
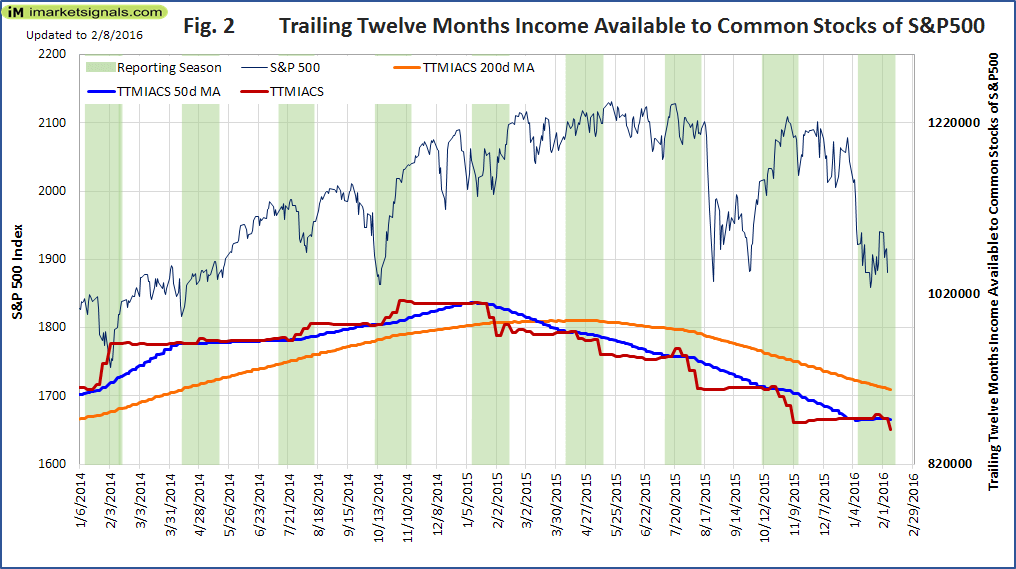
Figure 2 details the last 26 months with the earning seasons shaded and charting the weekly changes of TTMIACS and its smoothed components, the vertical relation of the S&P500 and TTTMIACS for the two charts (Figs.1 and 2) are the same. The latest available data shows that the downward trend of TTMIACS continues, but not as steep as in the past quarters.
Anton, thanks for the interesting article. I was wondering why the combo three is not reflecting this bearish perspective? Best of regards
I really liked the line in the original post, “Stocks cannot continue to advance when the income to common stockholders declines.”
At some point TTMIACS should turn. Maybe later this year as Energy improves.
Is there a chance you can track this on a regular basis. I understand it doesn’t change too often.
We will track this chart during every earning season, i.e. quarterly.
Hi Anton, where can we find the updates for Q1 and Q2 2016? Thanks!
Any chance you could see what the TTMICAS is doing without the energy sector? Might improve the picture some.