
We try to understand the signals of our models, and if the models behave against expectations, we investigate the reason for this. We share our investigation why we had to issue a correction last week (2/1/2016) and had to delay publishing the signals for Monday (2/8/2016).
Our Best(SPY-SH) and Best(SSO-TLT) models are also subscription models at Portfolio 123. There are a number of rules in the algorithms, which use the SP500 Current Year EPS Estimate (#SPEPSCY) from portfolio123.com which P123 defines as:
For the formulas below “Sum” represents a sum for each stock in the SP500. NA’s are accounted for with and adjustment factor (which is not shown for simplicity).
#SPEPSCY: Calculated using the Current Year Consensus Estimates for the S&P500
stocksnum = Sum { CurFYEPSMean (i) * Shares (i) }
den = Sum { MktCap (i) }
#SPEPSCY = ( S&P500 Close * (num/dem) )
We are investigating why the Best(SPY-SH) and Best(SSO-TLT) models had produced different signals on Sunday (1/31/2016) and Monday last week, with these same signals as last Sunday being generated yesterday (2/7/2016)
Last week, 2/1/2016, the Monday valueof #SPEPSCY was slightly lower than the Sunday value, which caused the models not to change.
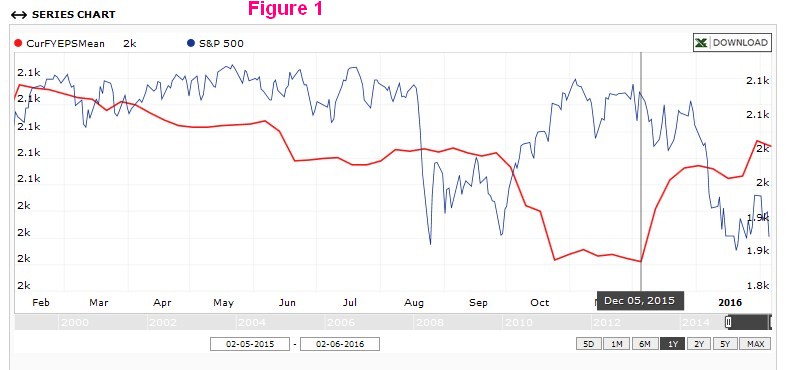
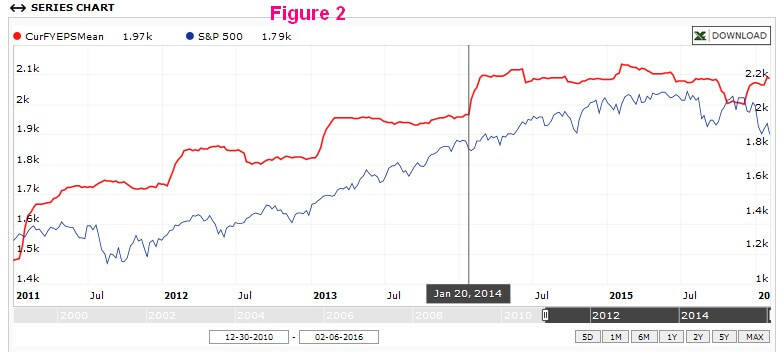
Extracting the CurFYEPSMean series from P123 we note, for now, an unexplained rise in this value from December 5 to December 31, 2015 ( see Figure 1). This December rise is atypical; charting over a 5 year period one can clearly distinguish that major changes in CurFYEPSMean occur during the reporting seasons, periods of 3 to 5 weeks beginning about two weeks into each quarter, (see Figure 2).
If the December 2015 rise is erroneous data, then we can categorically state that the Best(SPY-SH) and Best(SSO-TLT) should not be switching to the long market positions now or in the near future. (The Best(SPY-SH) model switches from SH to SPY on 2/8/2016 with above data)
We have informed Portfolio123 of our concerns and are awaiting their explanation.
Please take above into consideration in your ongoing investment decisions for these models.
Georg/Anton:
My recollection is that this is the third such announcement/error triggered by P123 in the last half year. I have great respect for your work, yet it appears to have been “polluted” by poor data inputs. Is there a consideration to reconstructing your algorithm on a competitors site/data feed?
Respectfully Yours.
This is not a P123 problem, it is the data they receive. Financial Data is monopolized by Standard and Poor — Compustat and Capital IQ belong to S&P. The same problems would exist on other platforms. We are of the opinion that trading blindly to the signals of models can lead to undesired result, human analysis is still required.
This comes from P123:
“NY & CY estimates are completely misleading when used in a time series chart, specially around Jan & Feb when most companies change calendar years. Recall what they represent: the estimate for a fiscal year. As the fiscal year ends, NY becomes CY with the inevitable jump in values. This jump seems to strongly indicate an upward revisions, but for the few that understand what’s going on.”
Where CY = Current Year
and NY = New Year.
I need more clarification on what your position is regarding this issue, and what you mean by,
“We are of the opinion that trading blindly to the signals of models can lead to undesired result, human analysis is still required.”
I do my own additional analysis on markets and signals, however I rely on the signals you provide as a starting point, which is why I subscribe. I recognize that your signals won’t correctly anticipate market moves every time, however my confidence in following your signals is based on your research and the testing you’ve done. If the data is not reliable, or if we now doubt the reliability, does it call into question the reliability of the research and testing?
Can you be more clear in what you mean by the above statement?
We are not controlling the data. It would appear that the Jan and Feb values of estimated S&P500 earnings for current year exhibit what appears to be strong upward revisions, when apparently the higher values are due to the change of fiscal year.
During up-market periods this does not detrimentally affect the model, but during flat- and down-market periods this makes the model go long the market.
We cannot change the algorithm in “mid-stream”, so we issued this alert to followers of the model.
Also we are not financial advisers, so we cannot provide guidance as to whether switching to SPY is now advisable or not, but we believe that people should have some understanding why this signal was generated by the model.
Irrespective of this alert, we will continue to report performance according to the signals from the model.
It seems that you need a rolling 12 month earnings forecast rather than the CY and NY forecast that results in a discontinuous earnings estimate.
I can only say that I am very frustrated at this latest issue..I rely on you to give the correct “bottom line” information based on your algo’s…Since they are yours and your only it should be up to you to guide/recommend your customers in the correct decision based upon your information. To tell me that “I am on my own” now is very confusing !
Agree with mets1. “We are of the opinion that trading blindly to the signals of models can lead to undesired result, human analysis is still required” isn’t really possible in this case since we don’t have all of the information which determines your model recommendation, therefore, we are not able to do an analysis of whether the model is correct or incorrect. We rely on your interpretation and do appreciate your comments to guide us.
Please see our reply to brentgoheen further up. We believe our message was pretty comprehensive and the responsible thing to do. It would not have been fair to subscribers to not mention our concern with the data which generated the most recent signal.
That is as far as we can go under the circumstances. Please note that we are not providing financial advice. All our models are based on math and backtesting. So far over the 1-year OOS performance of the Best(SPY-SH) is +32.5% while SPY lost 9.3% over the same period.
Thank you for looking into this situation further.
1) Does this mean P123 has now explained the rise in this value to your satisfaction and that you and p123 both agree the data is accurate?
2) Have you come to the conclusion that after your further analysis you think the rise is accurate data, then the model switch SH to SPY can be made with confidence?
I appreciate you clarifying as I’m not entirely sure what P123 is saying.
Thank you
1) In our opinion P123 has not explained the rise in this value to our satisfaction, but we can’t disagree with the data as we do not have any better information.
2) We think that our message conveyed was that we do not believe that the rise is due to an upward revision of the data. The earnings trend of the S&P500 is lower.
Are you going to see if modifying the S&P500 eps estimates based on the quarterly eps estimates would be the way to go? I saw the discussion in P123.
I don’t know whether P123 will revise the series again. They have done twice already in the last two years.
Perhaps you should switch to a rolling four quarters / 5-8 quarters forward estimate rather than CY / NY?
Due to the inconsistency of the SPEPCY data at the beginning of the calendar year we have amended Combo3.
Going forward we will not replicate the signals from the P123 subscription models as they can only be revised every six months. We have set up new component models for Combo3 with the required rule changes.
The performance and signals of Combo3 will be retroactively changed from 2/8/2016 to reflect those changes.
I don’t know what you mean by the statement you made above:
“We have set up new component models for Combo3 with the required rule changes. The performance and signals of Combo3 will be retroactively changed from 2/8/2016 to reflect those changes.”
I don’t see that the signals have been changed (at least not on the homepage). Does that mean SPY/SH has returned to SH? The above statement is completely confusing to me.
It would be helpful if you explained things more fully than these terse, obtuse statements you make.
The website will be updated on Feb-15. There will also be a new posting showing performance of new Combo3-iM.
Component model Best(SPY-SH)-iM will continue to hold SH as of 2/8/2016.
The part I’m most confused about is: “We have set up new component models for Combo3 with the required rule changes.”
When you release the new posting can you please explain what that means, more specifically? I’m not trying to be contrarian – but I honestly have no idea what that means.
Thanks for your quick replies – it helps.
With the data from P123 still unresolved,perhaps until the next reporting season, it would seem prudent in my judgement to move to a cash position for Combo users rather than long /short SPY. Another alternative would be a revised model.
Current Model Parameters
The trading rules use volatility, risk premium, earnings estimates together with moving average cross-overs and includes the following parameters:
CBOE Volatility Index – VIX,
S&P500 Risk Premium – which is the difference between the Current Estimated Earnings Yield of the S&P500 and the Treasury 10-yr Note Yield,
Current Year Earnings Per Share Estimate of the S&P500,
and the daily price of SPY.
It would be interesting to see how the model would perform if the Curr YR
Earnings/share (P123) were removed and TTMIACS added. With the weighting to be determined by backtesting. Stepping back for a moment from the pure math
model, it would seem logical that if TTMIACS, McGrader and the 10 month SMA
signal cash or short, depending on one’s aggressiveness, and the fact that around reporting periods the data is fuzzy, this warrants at a minimum a cash position, welcome any and all thoughts.
George,
How many other models may be affected or infected with possible erroneous data? i.e. Sector model, SPY/IEF ,MC Grader
All models affected by the fuzzy SPEPCY data have been changed. This has not effected a change to the Timer and Grader models.
It’s been my belief that when dealing with estimates these kind of data issues are inevitable, I look to confirm estimate models with other indicators. I prefer indicators that are based on price action to confirm models the use estimates. For example on this site the 3 month HI-Low index is a good indicator for getting out of the market but no indicator is perfect.
As you say, no indicator is perfect. Problem when following the Hi-Lo timing model on its own is that returns, although better than buy-an-hold, are still modest in comparison to what we would like to see.
Agreed
There have been down markets in the past and why would the change from CY to NY cause a problem only this time around?
Any news from P123 about this?
So this data is NOT used in the best sector portion of the combo 3?
It only affects the SPY/SH and SSO/TLT?
Also, can you update us on any response from P123?