
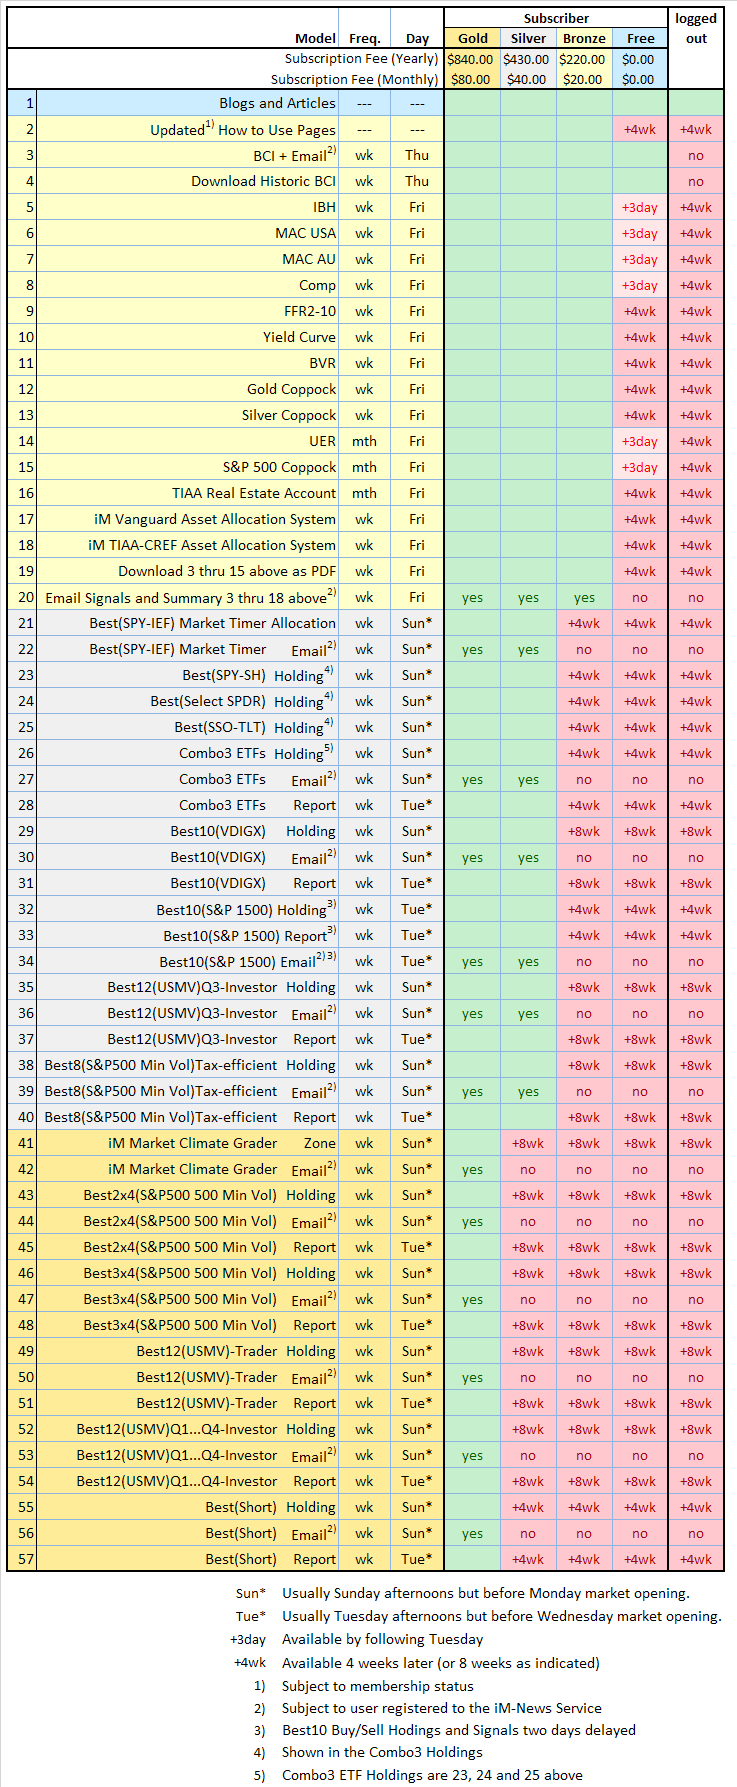
 We offer three categories of membership – bronze, silver and gold at $20, $40 and $80 per month respectively, or discounted on a per year basis. The table to the left (just click on it) lists what you can access depending on the membership level you choose. All information not listed will remain free, however selected key articles could in future be restricted to a paid membership category.
Please select your membership level here.
Please tick/untick boxes to select the emails you wish to receive:
Friday’s Weekly Update
Thursday’s Business Cycle Index (paused)
Most Recent Updates
Model Performance Tables: Jun 30, 2026
iM-Business Cycle Index Jun 4, 2026
Weekly Macro Signals: Jun 5, 2026
iM System Performance May 8, 2026
Monthly Update: May 8, 2026
June 30, 2026
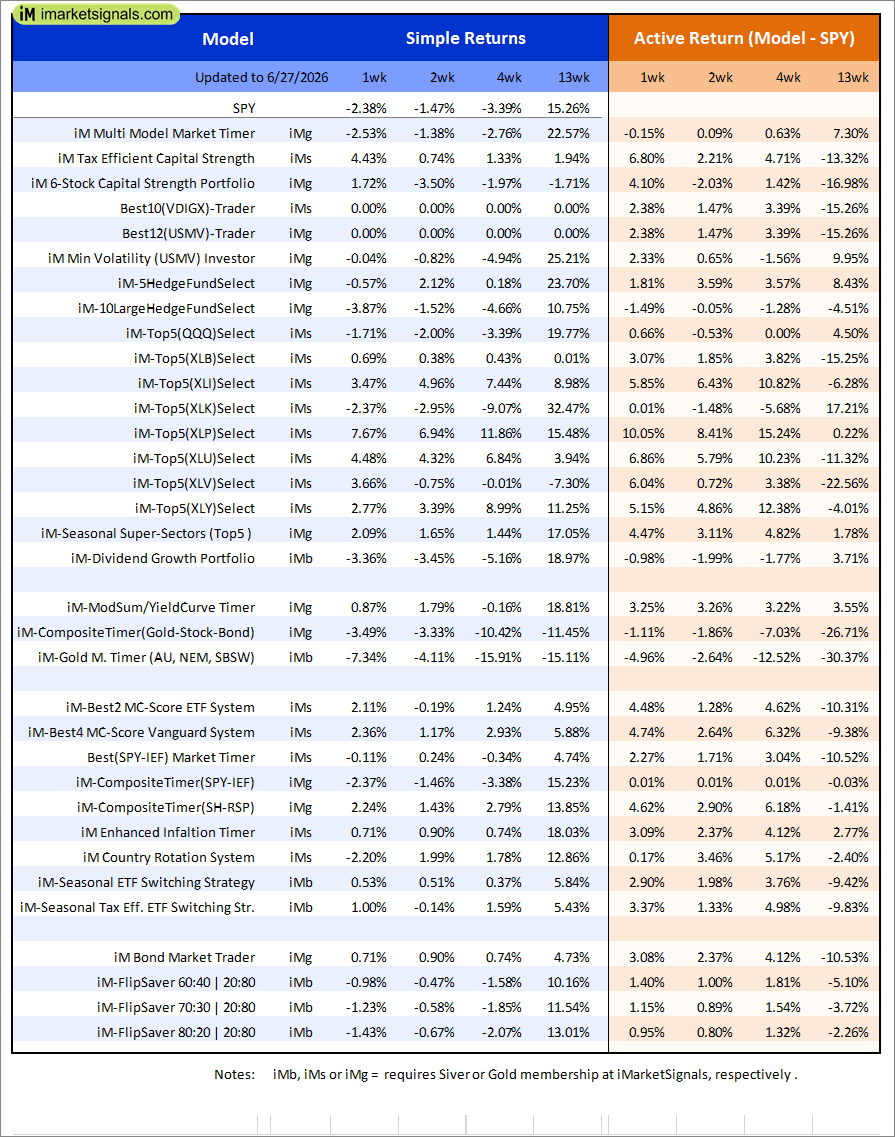 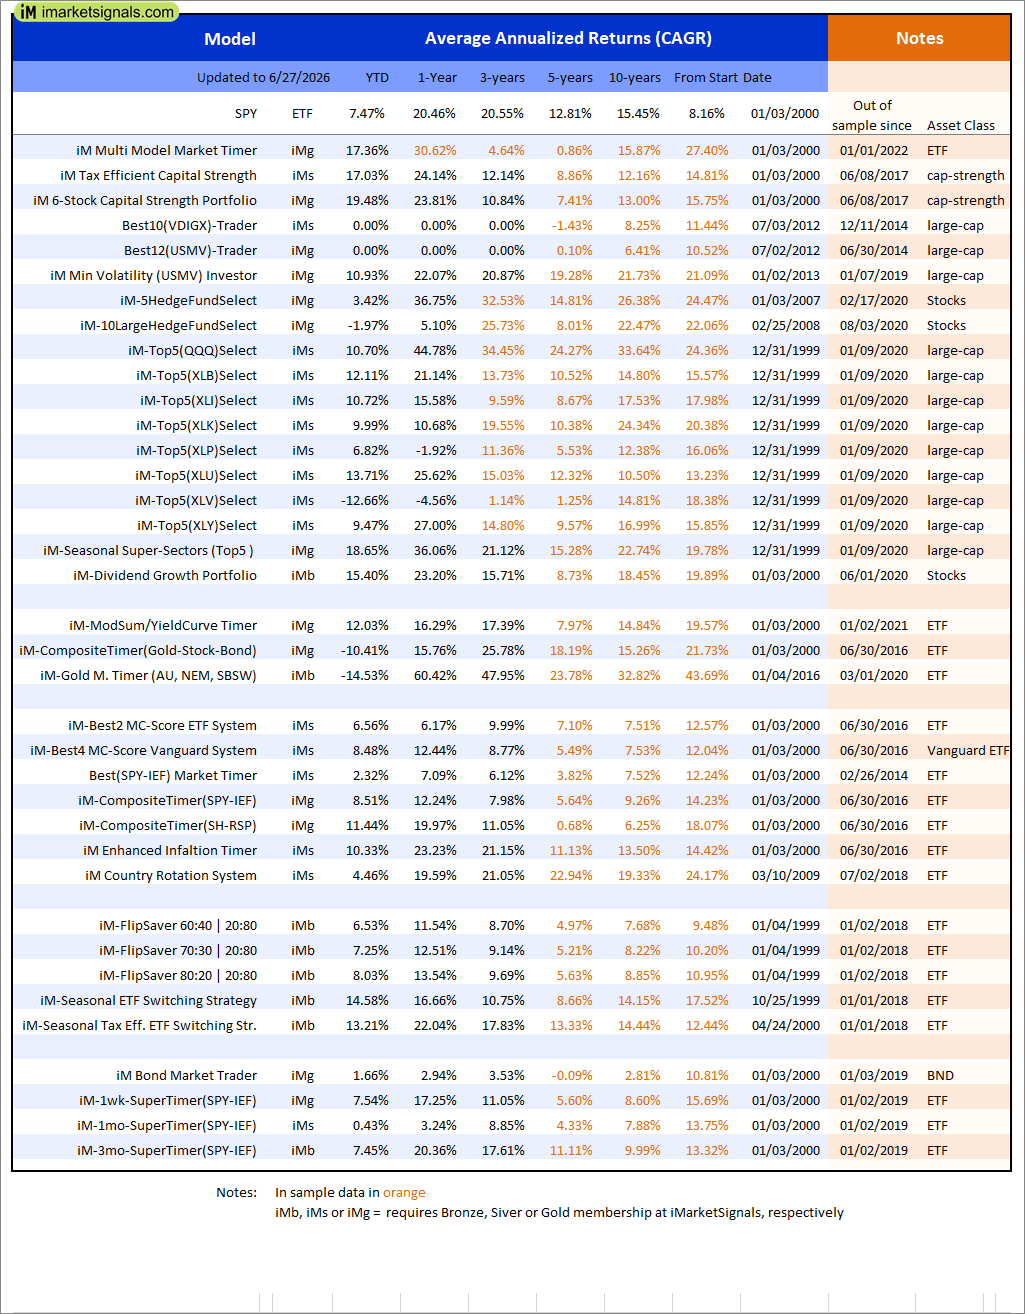 |
Out of sample performance summary of our models for the past 1, 2, 4 and 13 week periods. The active active return indicates how the models over- or underperformed the benchmark ETF SPY. Also the YTD, and the 1-, 3-, 5- and 10-year annualized returns are shown in the second table |
 |
iM-Inflation Attuned Multi-Model Market Timer: The model’s out of sample performance YTD is 0.0%, and for the last 12 months is 11.0%. Over the same period the benchmark SPY performance was 9.2% and 21.8% respectively. Over the previous week the market value of the iM-Inflation Attuned Multi-Model Market Timer gained 1.35% at a time when SPY gained -0.46%. A starting capital of $100,000 at inception on 3/24/2017 would have grown to $153,076,628 which includes $3,098,197 cash and excludes $4,103,439 spent on fees and slippage. |
|
|
iM-Conference Board LEIg Timer: The model’s performance YTD is 14.3%, and for the last 12 months is 7.3%. Over the same period the benchmark SPY performance was 20.1% and 9.4% respectively. Over the previous week the market value of the iM-Conference Board LEIg Timer gained 0.14% at a time when SPY gained -0.46%. A starting capital of $100,000 at inception on 4/5/2017 would have grown to $741,279 which includes $6,308 cash and excludes $769 spent on fees and slippage. |
| iM-FlipSaver 60:40 | 20:80 – 2017: The model’s out of sample performance YTD is 7.6%, and for the last 12 months is 12.8%. Over the same period the benchmark E60B40 performance was 6.0% and 14.8% respectively. Over the previous week the market value of iM-FlipSaver 80:20 | 20:80 gained 0.22% at a time when SPY gained 0.04%. A starting capital of $100,000 at inception on 7/16/2015 would have grown to $193,043 which includes $1,855 cash and excludes $5,611 spent on fees and slippage. | |
| iM-FlipSaver 70:30 | 20:80 – 2017: The model’s out of sample performance YTD is 8.6%, and for the last 12 months is 14.0%. Over the same period the benchmark E60B40 performance was 6.0% and 14.8% respectively. Over the previous week the market value of iM-FlipSaver 70:30 | 20:80 gained 0.12% at a time when SPY gained 0.04%. A starting capital of $100,000 at inception on 7/15/2015 would have grown to $202,828 which includes $1,656 cash and excludes $5,884 spent on fees and slippage. | |
| iM-FlipSaver 80:20 | 20:80 – 2017: The model’s out of sample performance YTD is 9.5%, and for the last 12 months is 15.2%. Over the same period the benchmark E60B40 performance was 6.0% and 14.8% respectively. Over the previous week the market value of iM-FlipSaver 80:20 | 20:80 gained 0.02% at a time when SPY gained 0.04%. A starting capital of $100,000 at inception on 1/2/2017 would have grown to $212,649 which includes $1,455 cash and excludes $6,148 spent on fees and slippage. | |
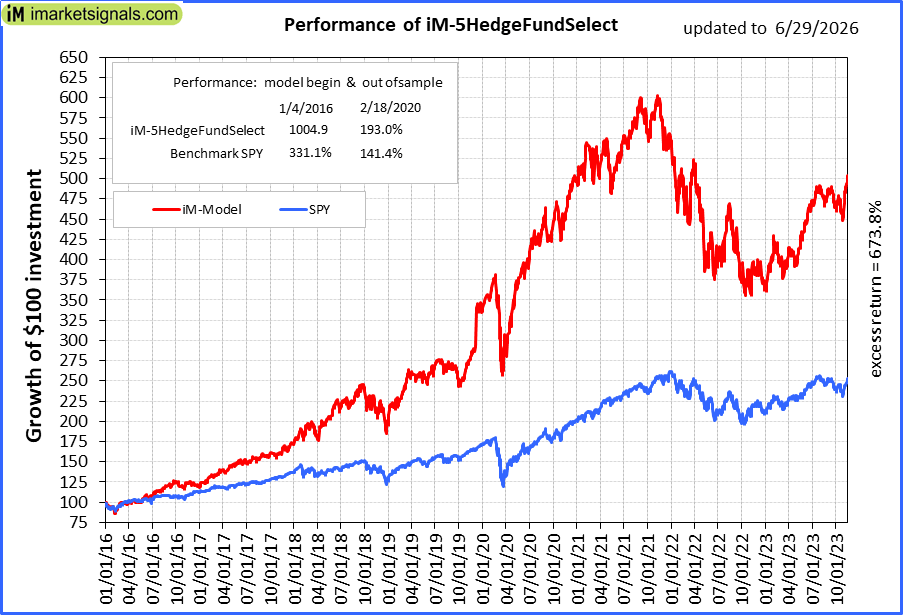 |
iM-5HedgeFundSelect: Since inception, on 1/5/2016, the model gained 1004.93% while the benchmark SPY gained 331.13% over the same period. Over the previous week the market value of iM-5HedgeFundSelect gained 0.37% at a time when SPY gained -0.46%. A starting capital of $25,000 at inception on 1/5/2016 would have grown to $276,233 which includes $2,887 cash and excludes $3,440 spent on fees and slippage. |
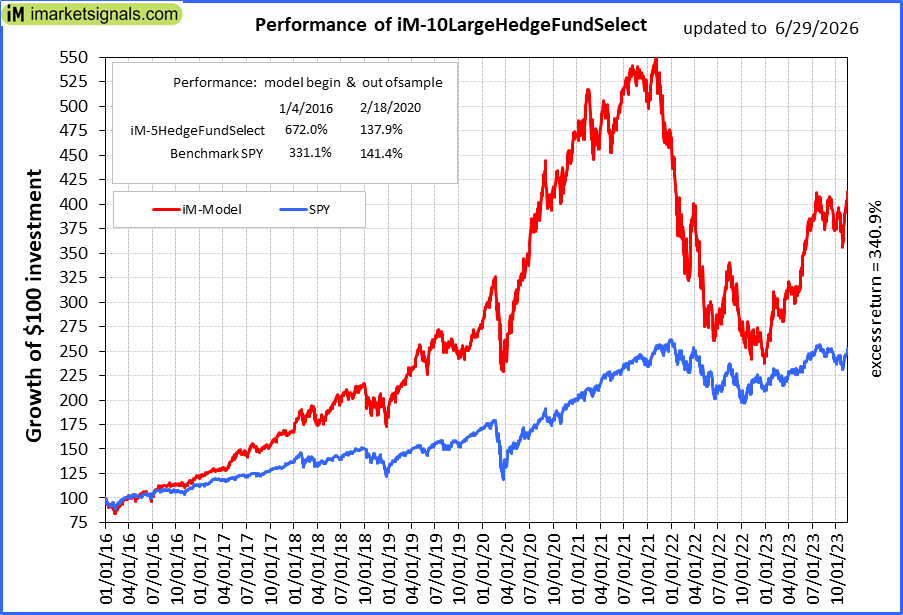 |
iM-10LargeHedgeFundSelect: Since inception, on 1/5/2016, the model gained 672.04% while the benchmark SPY gained 331.13% over the same period. Over the previous week the market value of iM-10LargeHedgeFundSelect gained -0.76% at a time when SPY gained -0.46%. A starting capital of $25,000 at inception on 1/5/2016 would have grown to $182,561 which includes -$11,048 cash and excludes $1,998 spent on fees and slippage. |
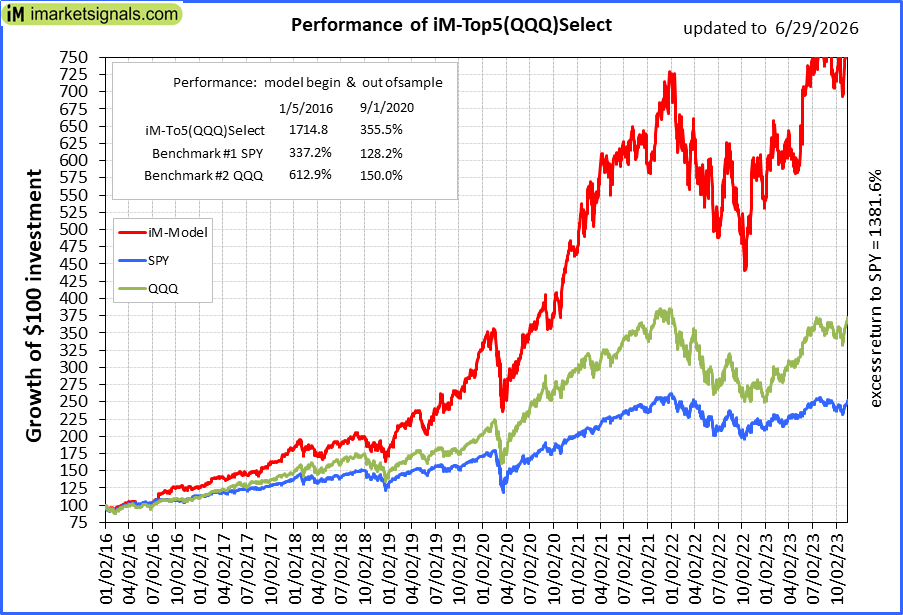 |
iM-Top5(QQQ)Select: Since inception, on 1/5/2016, the model gained 1712.73% while the benchmark SPY gained 331.13% over the same period. Over the previous week the market value of iM-Top5(QQQ)Select gained 0.64% at a time when SPY gained -0.46%. A starting capital of $100,000 at inception on 1/5/2016 would have grown to $1,812,729 which includes $69,864 cash and excludes $31,757 spent on fees and slippage. |
 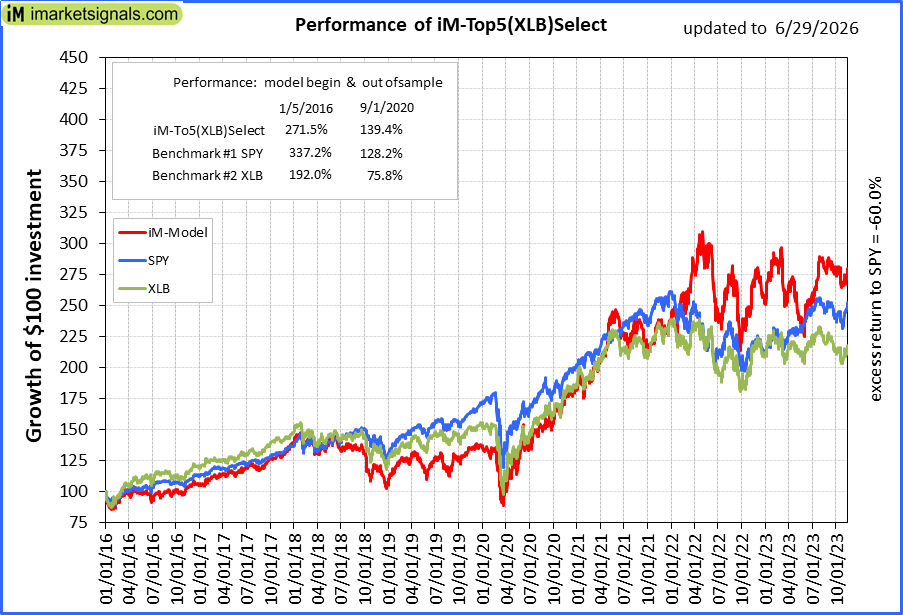 |
iM-Top5(XLB)Select: Since inception, on 1/5/2016, the model gained 271.09% while the benchmark SPY gained 331.13% over the same period. Over the previous week the market value of iM-Top5(XLB)Select gained -0.05% at a time when SPY gained -0.46%. A starting capital of $100,000 at inception on 1/5/2016 would have grown to $371,091 which includes $2,098 cash and excludes $17,890 spent on fees and slippage. |
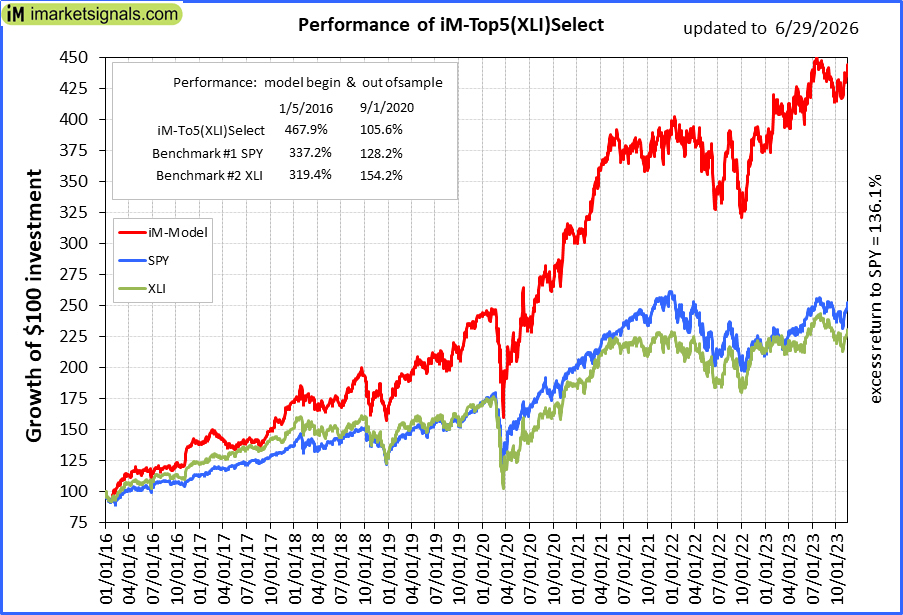 |
iM-Top5(XLI)Select: Since inception, on 1/5/2016, the model gained 467.24% while the benchmark SPY gained 331.13% over the same period. Over the previous week the market value of iM-Top5(XLI)Select gained 3.21% at a time when SPY gained -0.46%. A starting capital of $100,000 at inception on 1/5/2016 would have grown to $567,238 which includes $57,564 cash and excludes $9,414 spent on fees and slippage. |
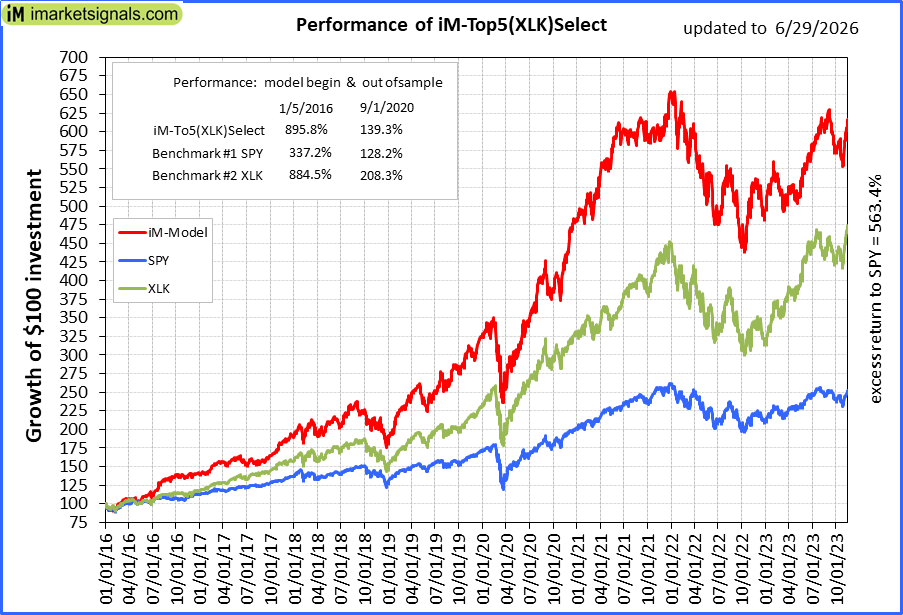 |
iM-Top5(XLK)Select: Since inception, on 1/5/2016, the model gained 894.53% while the benchmark SPY gained 331.13% over the same period. Over the previous week the market value of iM-Top5(XLK)Select gained 0.77% at a time when SPY gained -0.46%. A starting capital of $100,000 at inception on 1/5/2016 would have grown to $994,532 which includes $4,964 cash and excludes $3,677 spent on fees and slippage. |
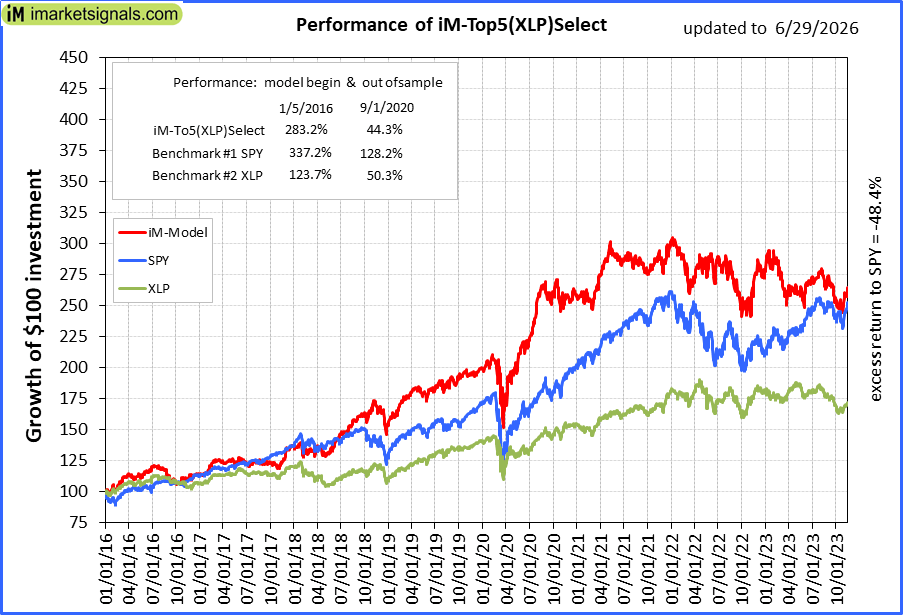 |
iM-Top5(XLP)Select: Since inception, on 1/5/2016, the model gained 282.78% while the benchmark SPY gained 331.13% over the same period. Over the previous week the market value of iM-Top5(XLP)Select gained 11.77% at a time when SPY gained -0.46%. A starting capital of $100,000 at inception on 1/5/2016 would have grown to $382,776 which includes $2,470 cash and excludes $3,339 spent on fees and slippage. |
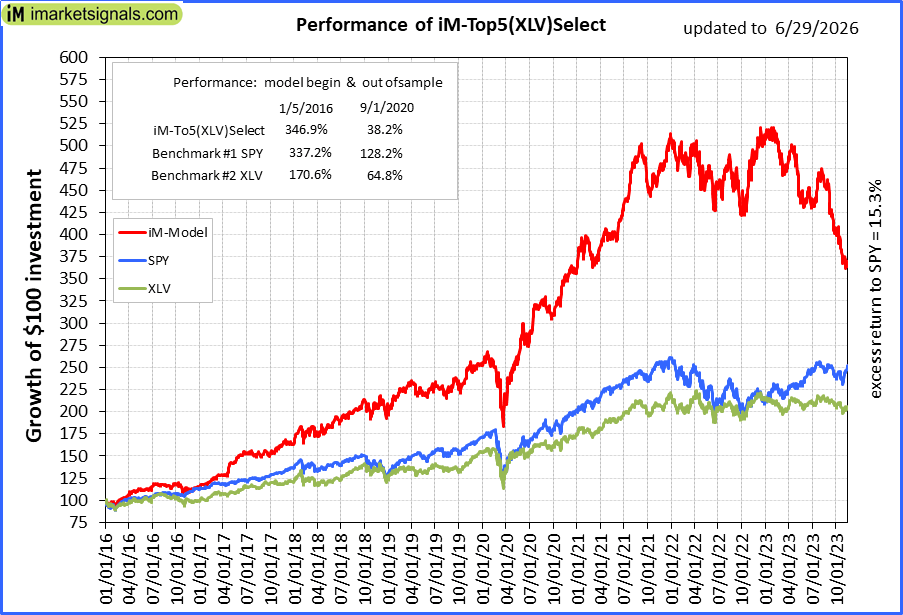 |
iM-Top5(XLV)Select: Since inception, on 1/5/2016, the model gained 346.46% while the benchmark SPY gained 331.13% over the same period. Over the previous week the market value of iM-Top5(XLV)Select gained 4.07% at a time when SPY gained -0.46%. A starting capital of $100,000 at inception on 1/5/2016 would have grown to $446,455 which includes $3,110 cash and excludes $20,008 spent on fees and slippage. |
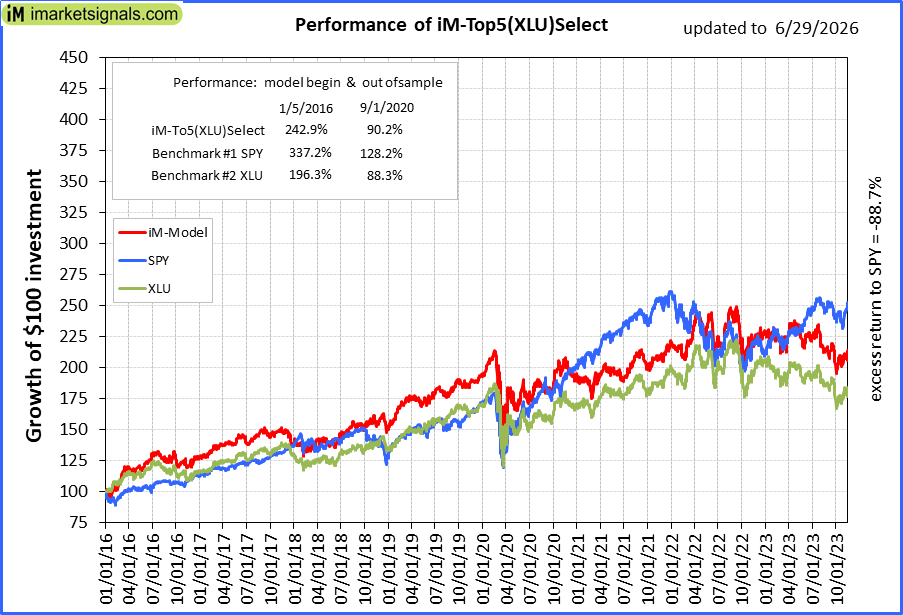 |
iM-Top5(XLU)Select: Since inception, on 1/5/2016, the model gained 242.48% while the benchmark SPY gained 331.13% over the same period. Over the previous week the market value of iM-Top5(XLU)Select gained 3.71% at a time when SPY gained -0.46%. A starting capital of $100,000 at inception on 1/5/2016 would have grown to $342,485 which includes $1,292 cash and excludes $18,957 spent on fees and slippage. |
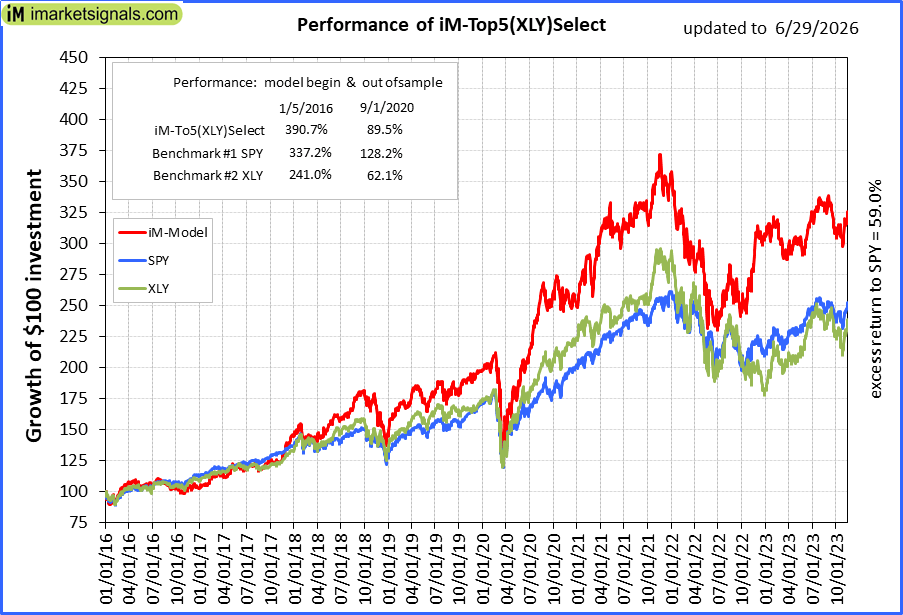 |
iM-Top5(XLY)Select: Since inception, on 1/5/2016, the model gained 390.11% while the benchmark SPY gained 331.13% over the same period. Over the previous week the market value of iM-Top5(XLY)Select gained 3.99% at a time when SPY gained -0.46%. A starting capital of $100,000 at inception on 1/5/2016 would have grown to $490,110 which includes $1,360 cash and excludes $8,404 spent on fees and slippage. |
|
|
iM-Seasonal Super-Sectors (Top5 combo) : Since inception, on 11/17/2020, the model gained 148.11% while the benchmark SPY gained 123.80% over the same period. Over the previous week the market value of iM-Seasonal Super-Sectors (Top5 combo) gained 4.31% at a time when SPY gained -0.46%. A starting capital of $100,000 at inception on 11/17/2020 would have grown to $248,109 which includes $5,144 cash and excludes $00 spent on fees and slippage. |
| iM-Dividend Growth Portfolio: The model’s out of sample performance YTD is 14.0%, and for the last 12 months is 21.4%. Over the same period the benchmark SPY performance was 9.2% and 21.8% respectively. Over the previous week the market value of the iM-Dividend Growth Portfolio gained -3.32% at a time when SPY gained -0.46%. A starting capital of $100,000 at inception on 6/30/2016 would have grown to $607,144 which includes $111,947 cash and excludes $15,265 spent on fees and slippage. | |
| iM-Gold Momentum Timer (AU, NEM, SBSW): The model’s out of sample performance YTD is -15.3%, and for the last 12 months is 71.5%. Over the same period the benchmark SPY performance was 9.2% and 21.8% respectively. Over the previous week the market value of iM-Gold Momentum Timer (AU, NEM, SBSW) gained -6.47% at a time when SPY gained -0.46%. A starting capital of $100,000 at inception on 6/30/2016 would have grown to -$41,686 which includes $255,870 cash and excludes Gain to date spent on fees and slippage. | |
|
|
iM-ModSum/YieldCurve Timer: The model’s out of sample performance YTD is 12.3%, and for the last 12 months is 16.9%. Over the same period the benchmark SPY performance was 9.2% and 21.8% respectively. Over the previous week the market value of iM-PortSum/YieldCurve Timer gained 1.12% at a time when SPY gained -0.46%. A starting capital of $100,000 at inception on 1/1/2016 would have grown to $430,237 which includes $1,897 cash and excludes $2,470 spent on fees and slippage. |
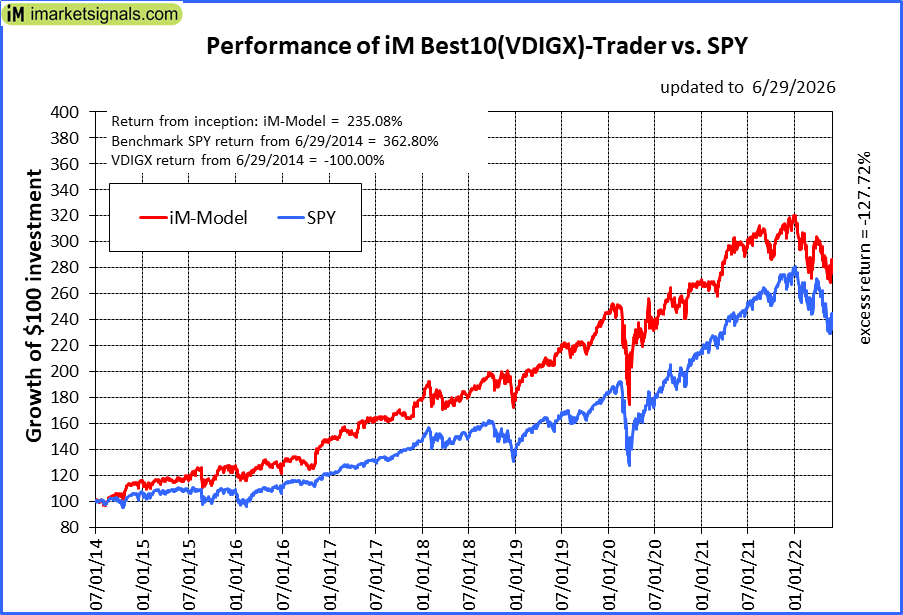 |
iM-Best10(VDIGX)-Trader: The model’s out of sample performance YTD is -10.0%, and for the last 12 months is -8.1%. Over the same period the benchmark SPY performance was 9.2% and 21.8% respectively. Since inception, on 7/1/2014, the model gained 235.08% while the benchmark SPY gained 362.80% and VDIGX gained -100.00% over the same period. Over the previous week the market value of iM-Best10(VDIGX) gained 4.59% at a time when SPY gained -0.46%. A starting capital of $100,000 at inception on 7/1/2014 would have grown to $335,076 which includes $725 cash and excludes $5,794 spent on fees and slippage. |
|
|
iM 6-Stock Capital Strength Portfolio: The model’s out of sample performance YTD is 19.1%, and for the last 12 months is 23.2%. Over the same period the benchmark SPY performance was 9.2% and 21.8% respectively. Over the previous week the market value of the iM 6-Stock Capital Strength Portfolio gained 0.27% at a time when SPY gained -0.46%. A starting capital of $100,000 at inception on 10/28/2016 would have grown to $305,936 which includes $5,727 cash and excludes $4,594 spent on fees and slippage. |
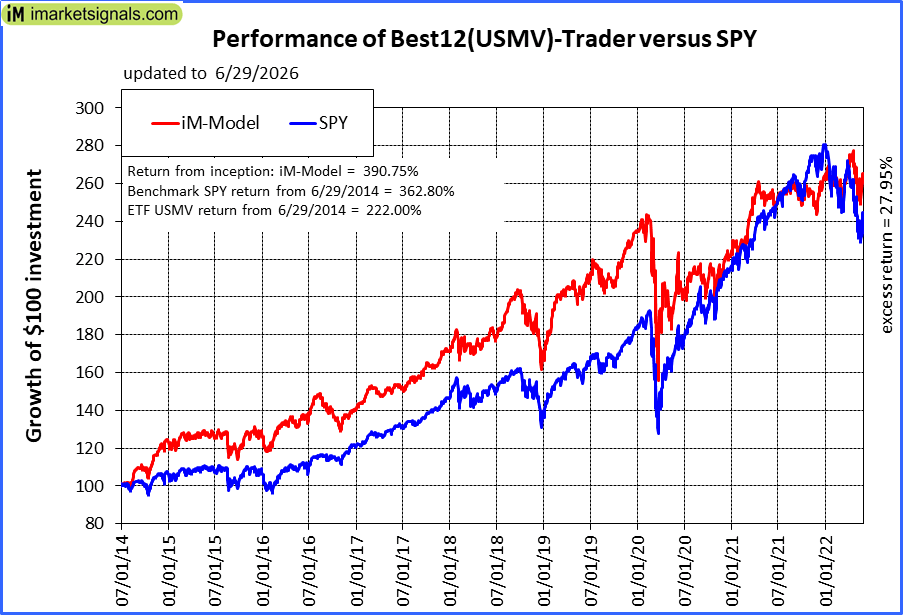 |
iM-Best12(USMV)-Trader: The model’s out of sample performance YTD is 14.9%, and for the last 12 months is 25.2%. Over the same period the benchmark SPY performance was 9.2% and 21.8% respectively. Since inception, on 6/30/2014, the model gained 390.75% while the benchmark SPY gained 362.80% and the ETF USMV gained 222.00% over the same period. Over the previous week the market value of iM-Best12(USMV)-Trader gained 2.89% at a time when SPY gained -0.46%. A starting capital of $100,000 at inception on 6/30/2014 would have grown to $490,748 which includes $4,549 cash and excludes $8,963 spent on fees and slippage. |
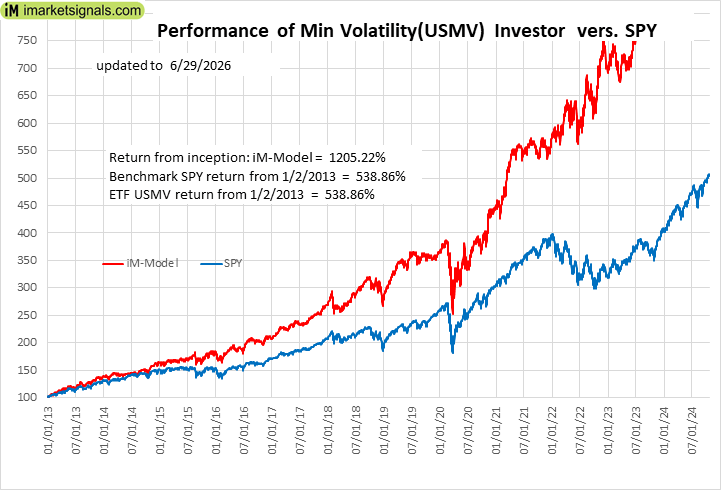 |
iM-Min Volatility(USMV) Investor (Tax Efficient): The model’s out of sample performance YTD is 9.7%, and for the last 12 months is 21.6%. Over the same period the benchmark SPY performance was 9.2% and 21.8% respectively. Since inception, on 1/3/2013, the model gained 1205.22% while the benchmark SPY gained 538.86% and the ETF USMV gained 538.86% over the same period. Over the previous week the market value of iM-Best12(USMV)Q1 gained -2.39% at a time when SPY gained -0.46%. A starting capital of $100,000 at inception on 1/3/2013 would have grown to $1,305,215 which includes -$2,642 cash and excludes $18,062 spent on fees and slippage. |
|
|
iM-Bond Market Trader (High-Yield Bond or 10-yr Treasury Bond): The model’s out of sample performance YTD is 1.7%, and for the last 12 months is 3.2%. Over the same period the benchmark BND performance was 1.2% and 4.5% respectively. Over the previous week the market value of the iM-Bond Market Trader (High-Yield Bond or 10-yr Treasury Bond) gained 1.12% at a time when BND gained 0.78%. A starting capital of $10,000 at inception on 1/3/2000 would have grown to $151,622 which includes $476 cash and excludes $2,977 spent on fees and slippage. |
|
|
iM-ModSum/YieldCurve Timer: The model’s out of sample performance YTD is 12.3%, and for the last 12 months is 16.9%. Over the same period the benchmark SPY performance was 9.2% and 21.8% respectively. Over the previous week the market value of iM-PortSum/YieldCurve Timer gained 1.12% at a time when SPY gained -0.46%. A starting capital of $100,000 at inception on 1/1/2016 would have grown to $430,237 which includes $1,897 cash and excludes $2,470 spent on fees and slippage. |
|
|
iM-Best2 MC-Score ETF System: The model’s out of sample performance YTD is 6.4%, and for the last 12 months is 6.0%. Over the same period the benchmark SPY performance was 9.2% and 21.8% respectively. Over the previous week the market value of the iM-Best2 MC-Score ETF System gained 2.30% at a time when SPY gained -0.46%. A starting capital of $100,000 at inception on 6/30/2016 would have grown to $200,264 which includes $2,002 cash and excludes $5,779 spent on fees and slippage. |
|
|
iM-Best4 MC-Score Vanguard System: The model’s out of sample performance YTD is 8.2%, and for the last 12 months is 11.9%. Over the same period the benchmark SPY performance was 9.2% and 21.8% respectively. Over the previous week the market value of the iM-Best4 MC-Score Vanguard System gained 1.98% at a time when SPY gained -0.46%. A starting capital of $100,000 at inception on 6/30/2016 would have grown to $197,910 which includes $7,005 cash and excludes $00 spent on fees and slippage. |
|
|
iM-Composite (SPY-IEF) Timer: The model’s out of sample performance YTD is 10.6%, and for the last 12 months is 14.7%. Over the same period the benchmark SPY performance was 9.2% and 21.8% respectively. Over the previous week the market value of the iM-Composite (SPY-IEF) Timer gained -0.45% at a time when SPY gained -0.46%. A starting capital of $100,000 at inception on 6/30/2016 would have grown to $239,411 which includes $1,550 cash and excludes $8,651 spent on fees and slippage. |
|
|
iM-Composite(Gold-Stocks-Bond) Timer: The model’s out of sample performance YTD is -11.6%, and for the last 12 months is 16.3%. Over the same period the benchmark SPY performance was 9.2% and 21.8% respectively. Over the previous week the market value of the iM-Composite(Gold-Stocks-Bond) Timer gained -4.16% at a time when SPY gained -0.46%. A starting capital of $100,000 at inception on 6/30/2016 would have grown to $356,908 which includes $113 cash and excludes $10,872 spent on fees and slippage. |
June 4, 2026
iM-Business Cycle Index
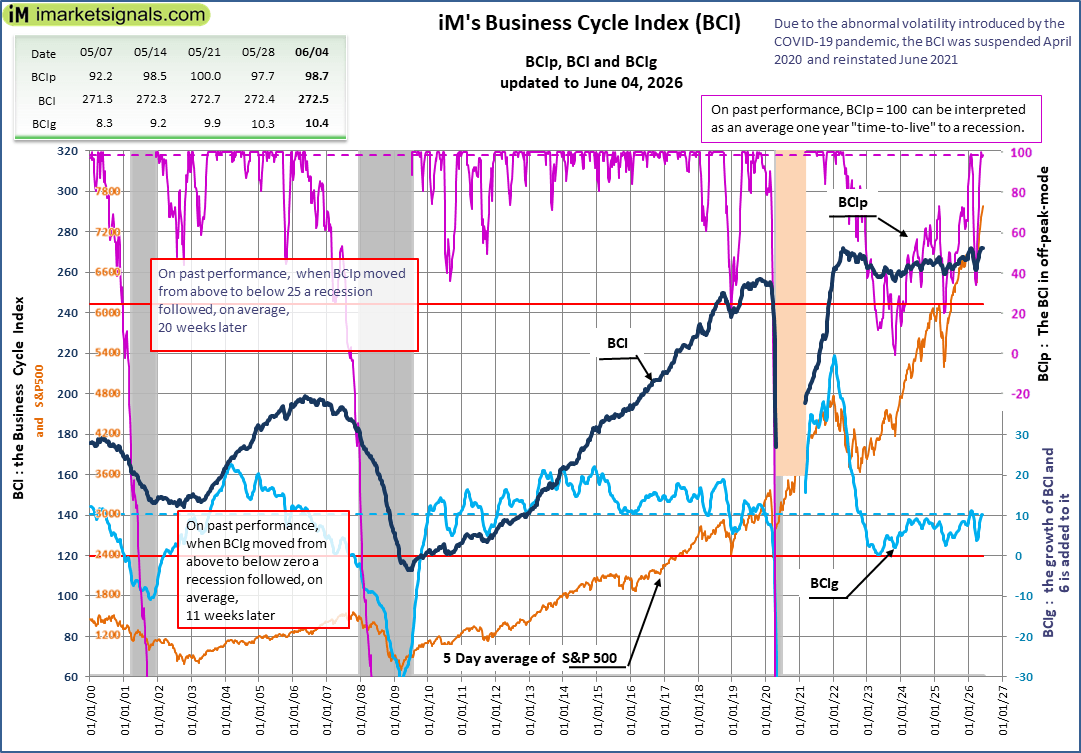
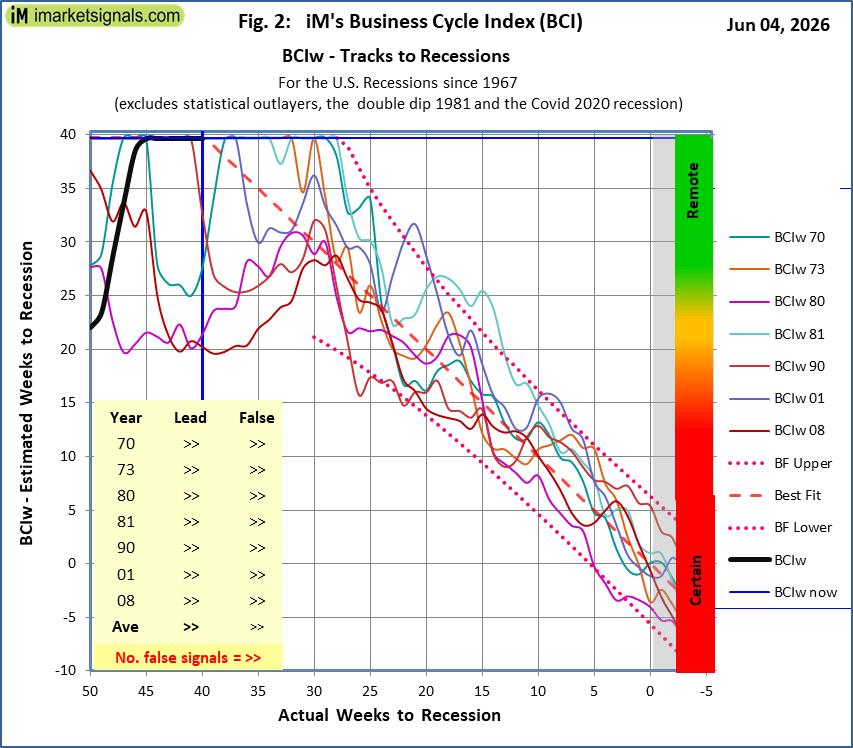 The BCI is not signalling a recession
June 5, 2026
Market Signals Summary:
The iM-Google Trend, the MAC-US, S&P 500 Coppock Indicator, CAPE-Cycle-ID are invested in the stock markets, whereas the the 3-Month Hi-Lo Index Index is dis-invested. The BCIg does not signal a recession as does the growth of the Conference Board’s Leading Economic Indicator. The Forward Rate Ratio between the 2 and 10 is no longer inverted and the curve is flattening The iM-Gold Timer and iM-Gold Coppock are invested in gold, whereas the iM-Silver Coppock is in cash.
Stock-markets:
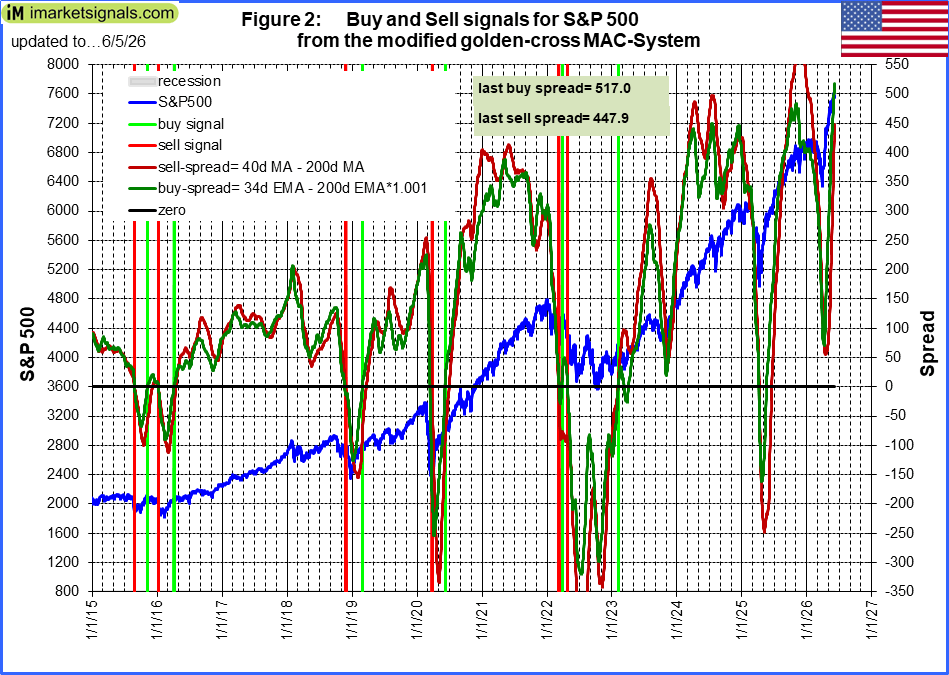 The MAC-US model is invested since mid June 2025,
.
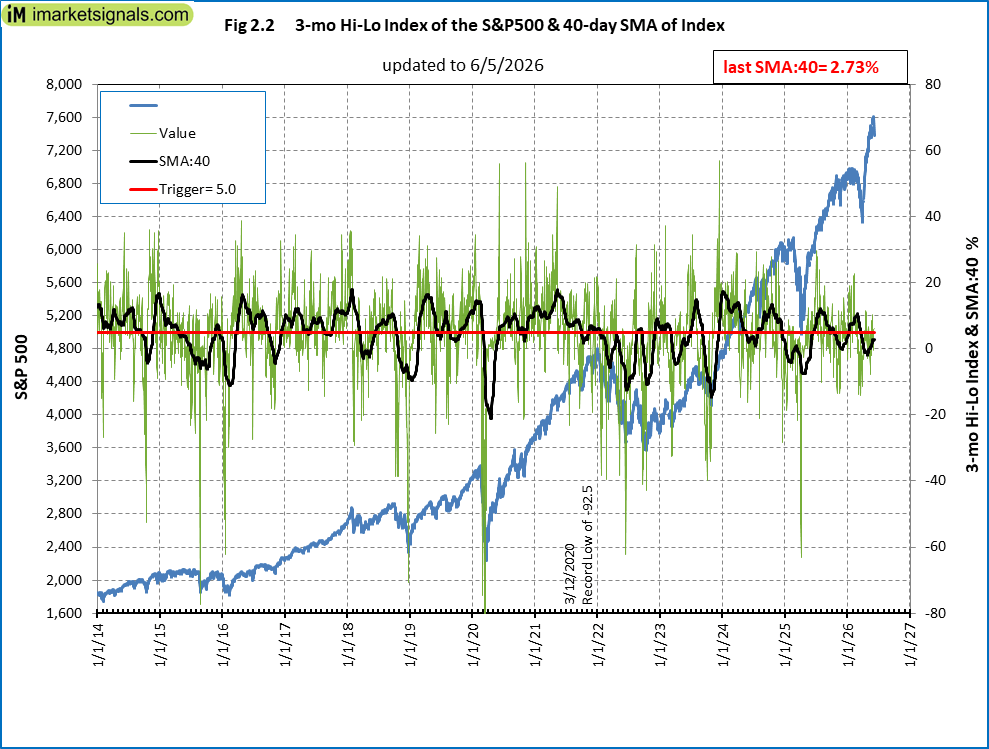 The 3-mo Hi-Lo Index Index of the S&P500 is at 2.73% (last week 2.42%) and is dis-invested from the markets.
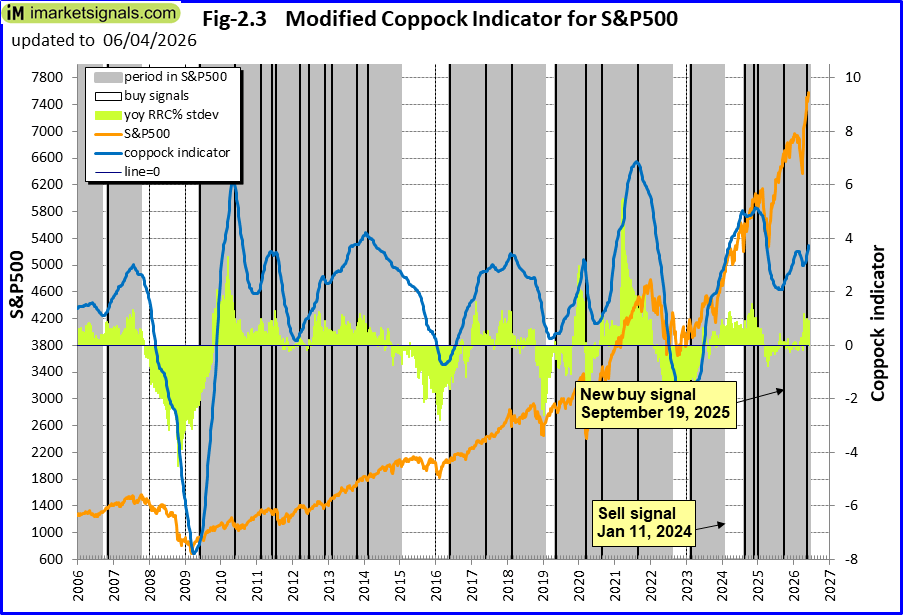 The Coppock indicator for the S&P500 invested the the US stock markets mid August 2024. This indicator is described here.
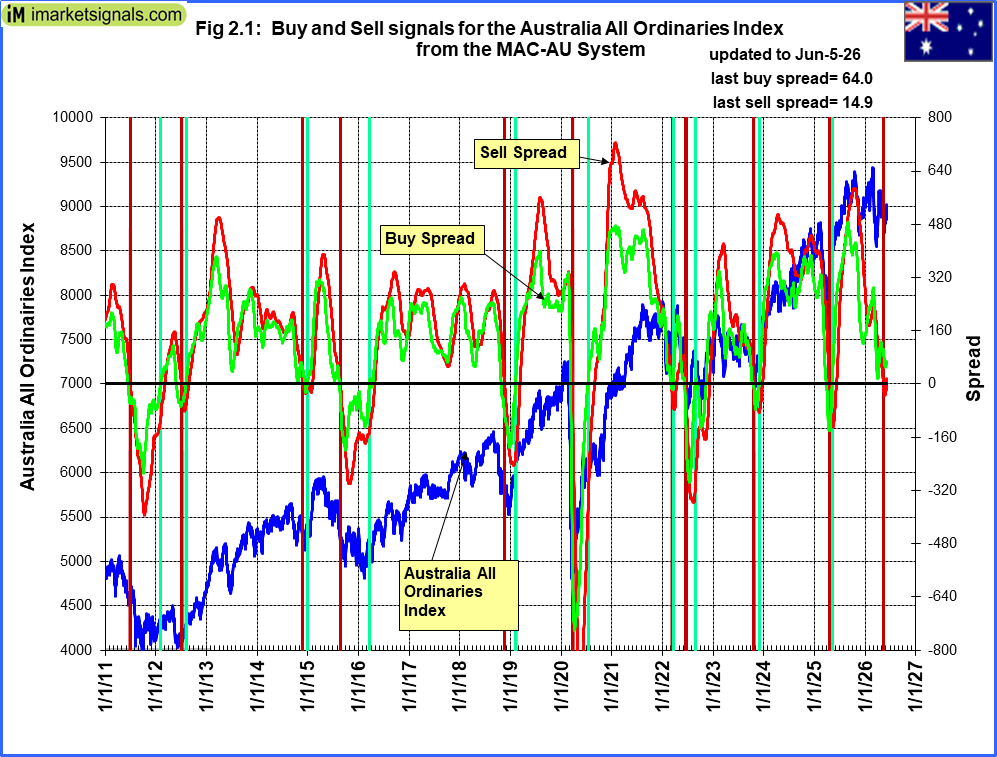 The MAC-AU model is dis-invested from the Australian stock market sine end April 2025.
This model and its application is described in MAC-Australia: A Moving Average Crossover System for Superannuation Asset Allocations.
Recession:
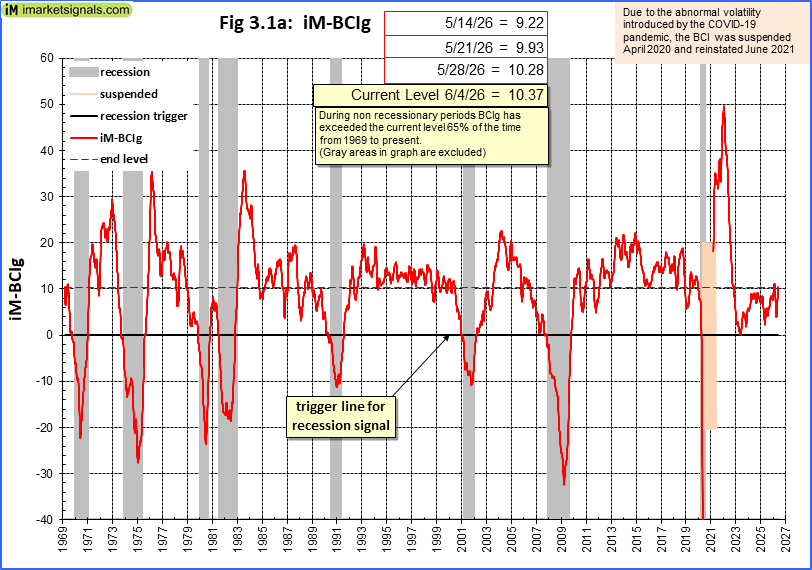 BCIg is not signaling a recession.
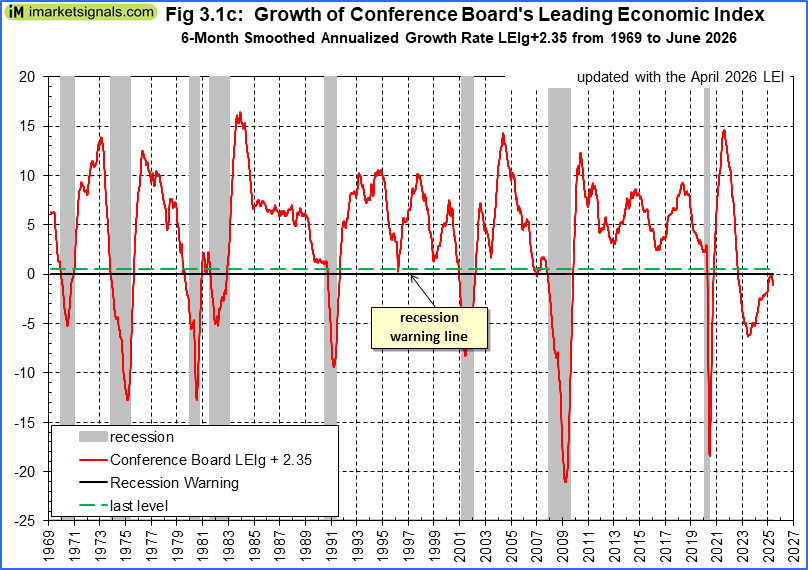 The growth of the Conference Board’s Leading Economic Indicator does not signal a recession, yet
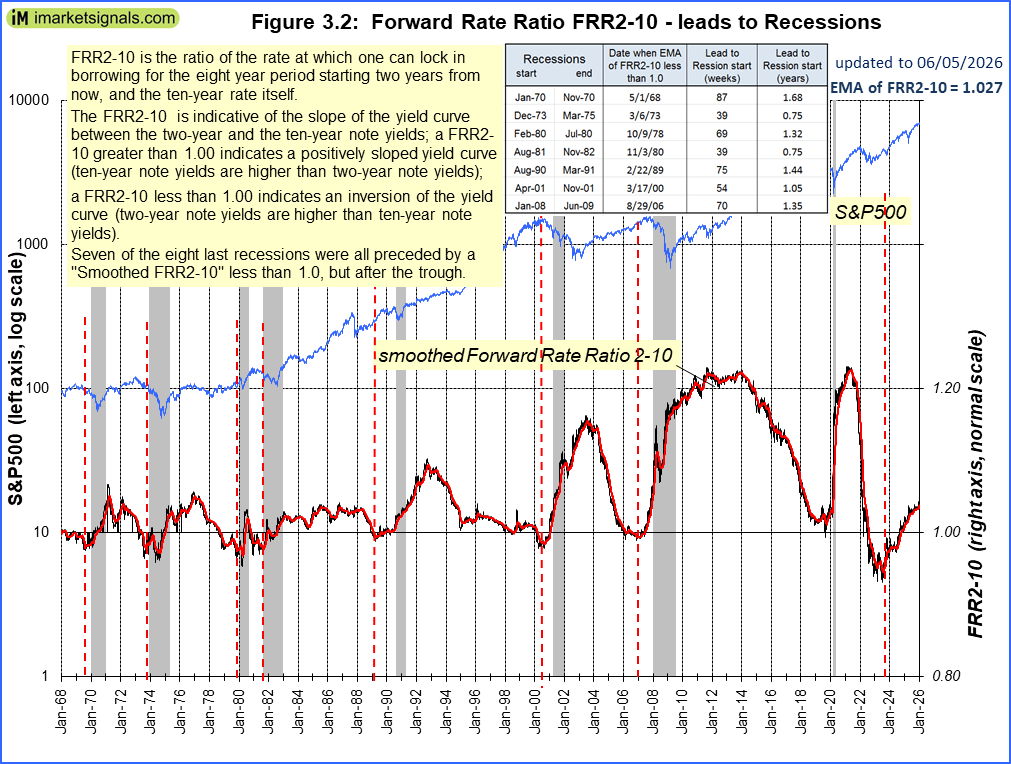 The Forward Rate Ratio between the 2-year and 10-year U.S. Treasury yields (FRR2-10) is no longer inverted and the curve is steepening.
A description of this indicator can be found here.
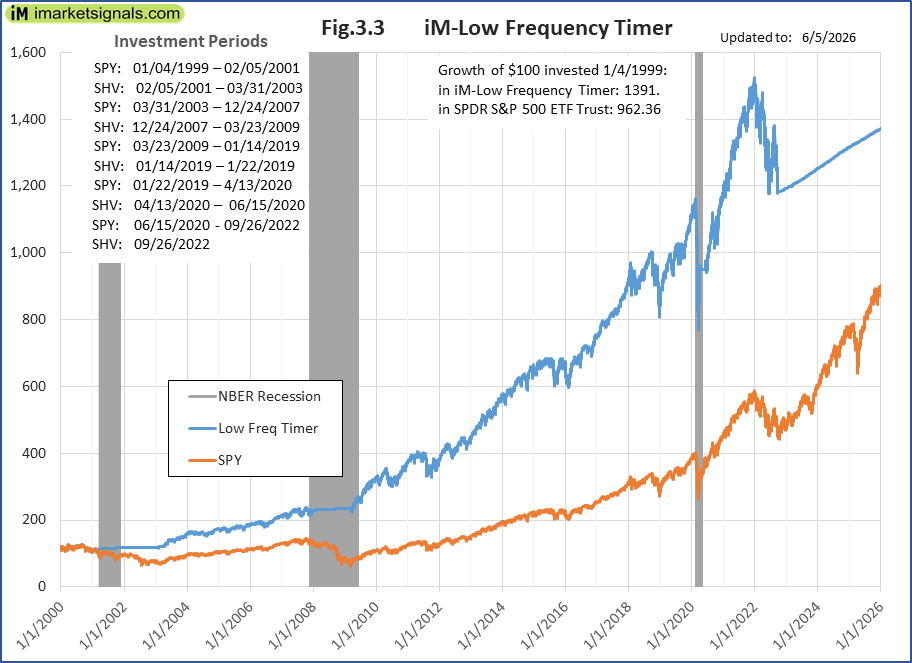 The iM-Low Frequency Timer switched to bonds on 9/26/2022.
A description of this indicator can be found here.
June 5, 2026
Bond-market:
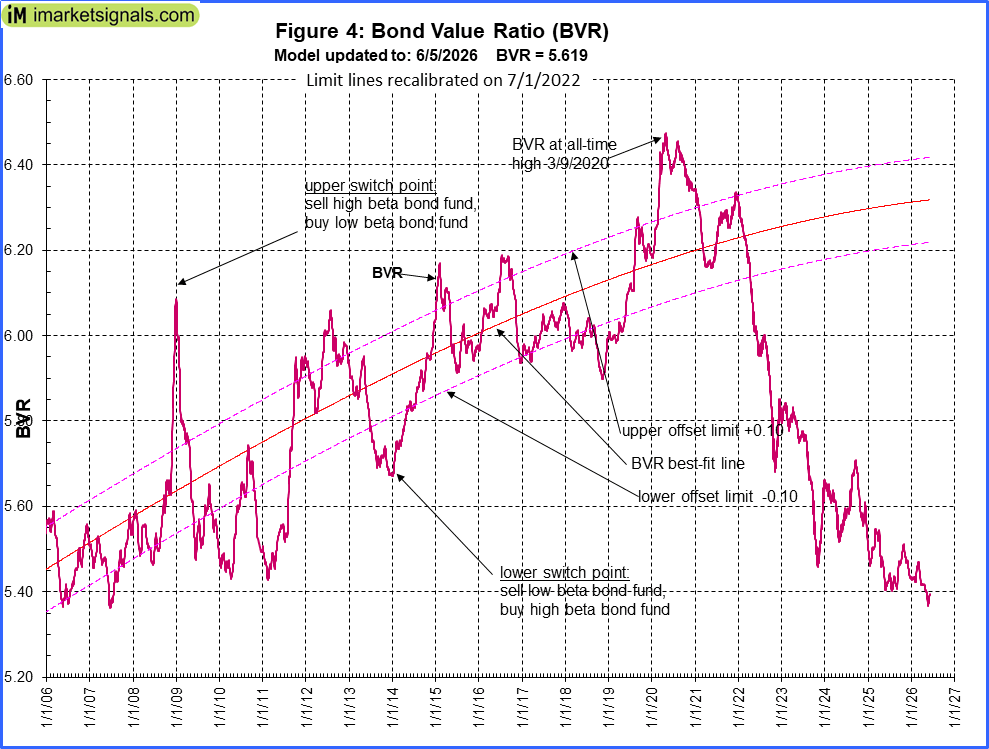 The BVR-model favors high beta bonds (long-bonds) and intermediate duration bonds when the BVR rises. The Bond Value Ratio as shown in Fig 4 is above last week’s value, and according to the model, only when BVR turns upward after having been lower than the lower offset-line should one consider long bonds again.
The Yield Curve:
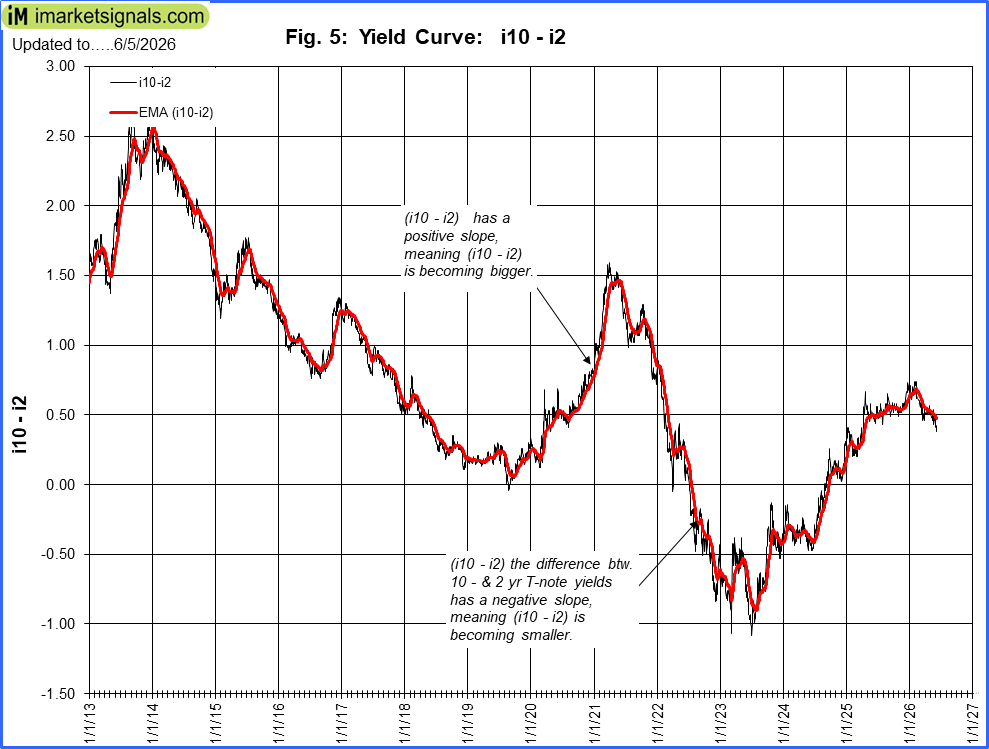 The yield curve model indicates the trend of the 10-year and 2-year Treasuries yield spread. Figure 5 charts (i10 – i2), the yield curve is below last week’s level.
Gold:
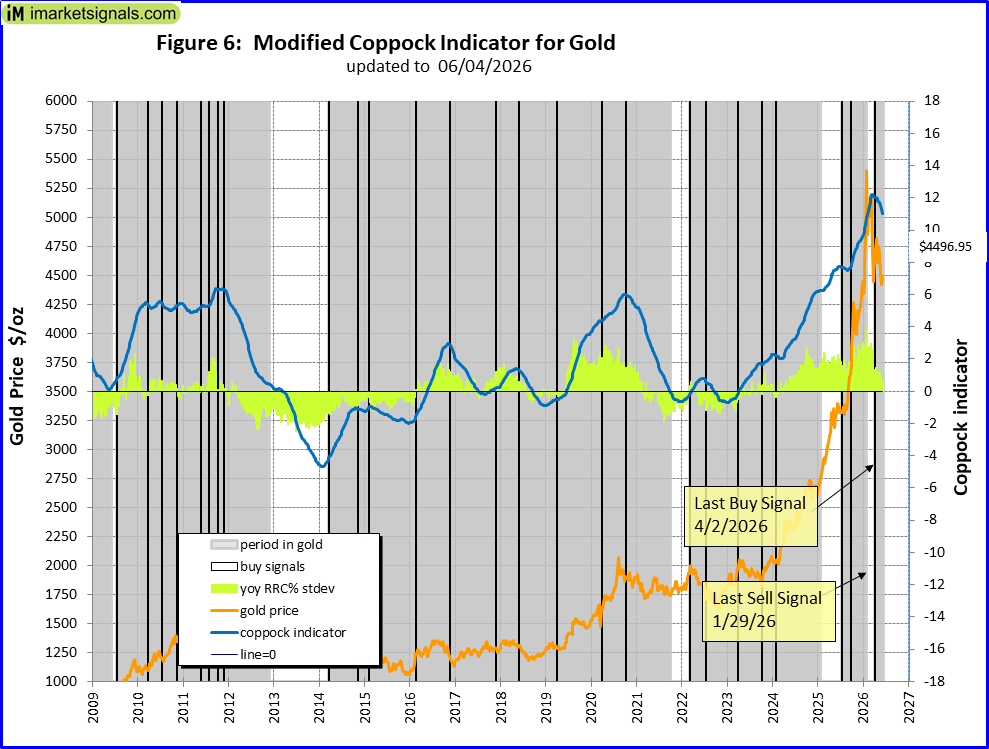 The modified Coppock Gold indicator, shown in Fig 6, generated a buy signal begin April and is invested in gold.
This indicator is described in Is it Time to Buy Gold Again? – Wait for the buy signal …….
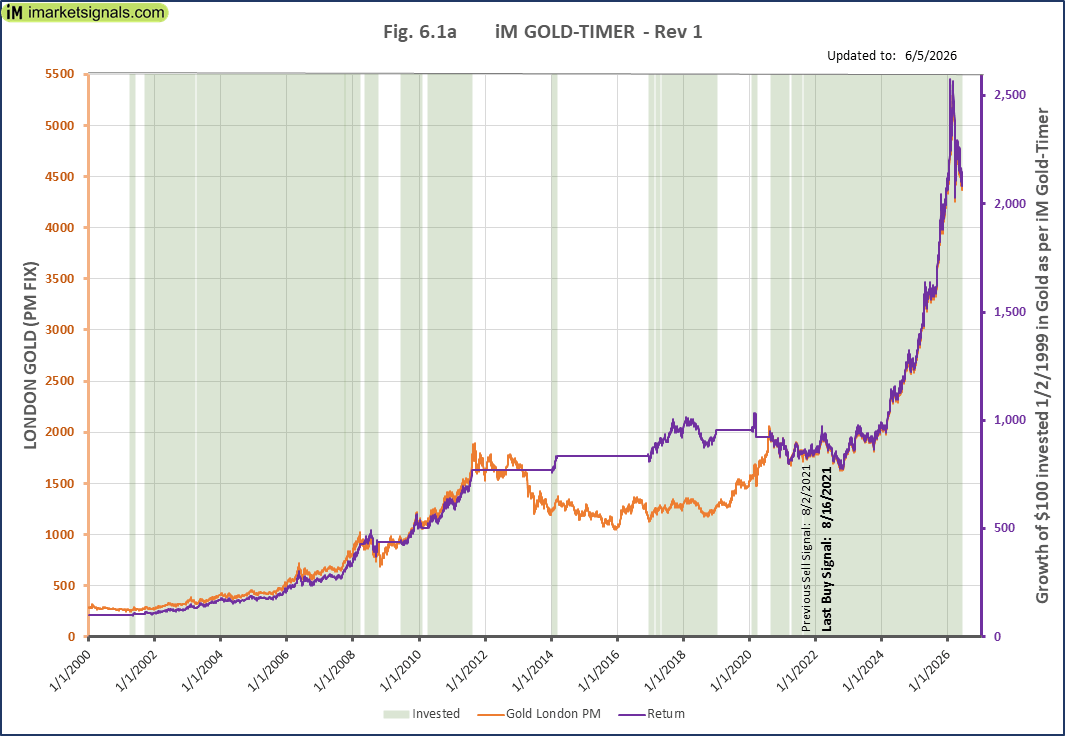 The iM GOLD-TIMER Rev-1 This model generated a new a buy signal mid August 2021 after being in cash for two weeks and thus invested in gold.
Silver:
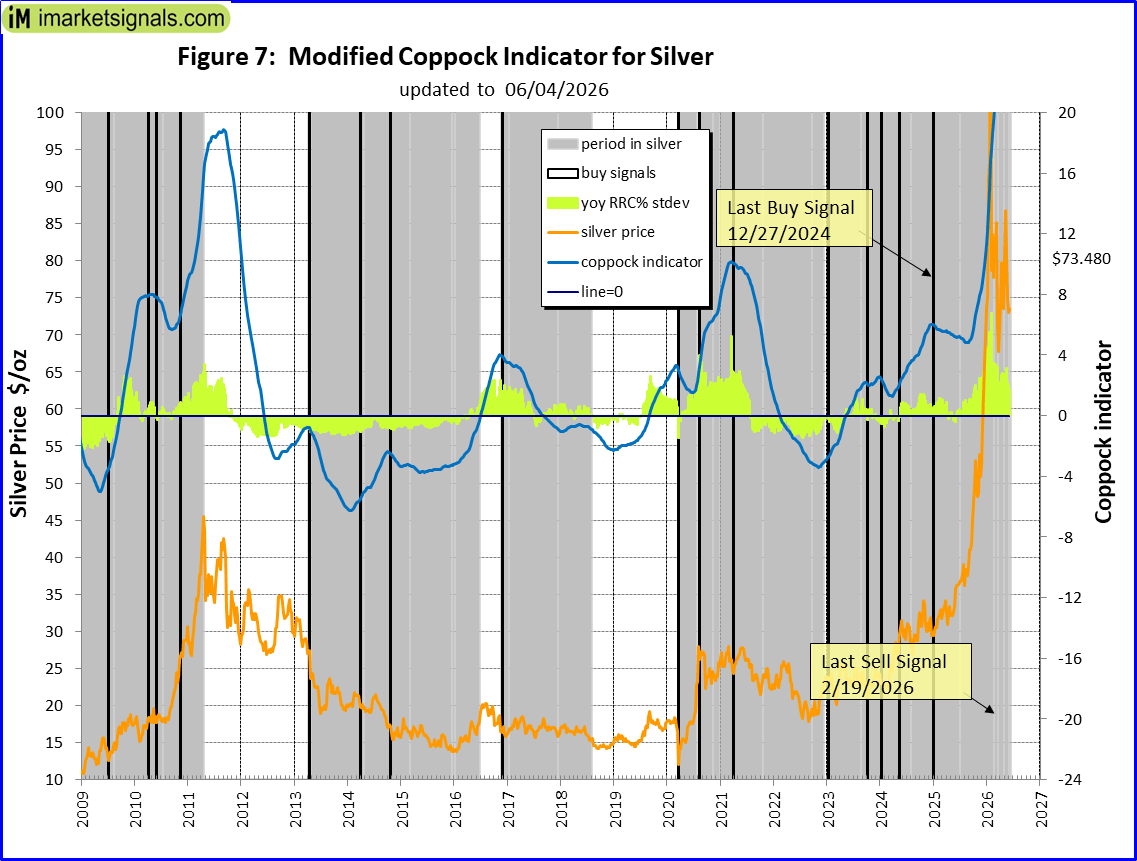 The modified Coppock Silver indicator shown in Fig 7. iM-coppock model generated is invested in Silver.
This indicator is described in Silver – Better Than Gold: A Modified Coppock Indicator for Silver.
iM Sytems, Performance Reports
May 8, 2026
iM-Best Systems Performance (R2G and others)
 Performance comparison of the iM-Best models hosted on P123 and on iMarketSignals.
iM-FlipSavers
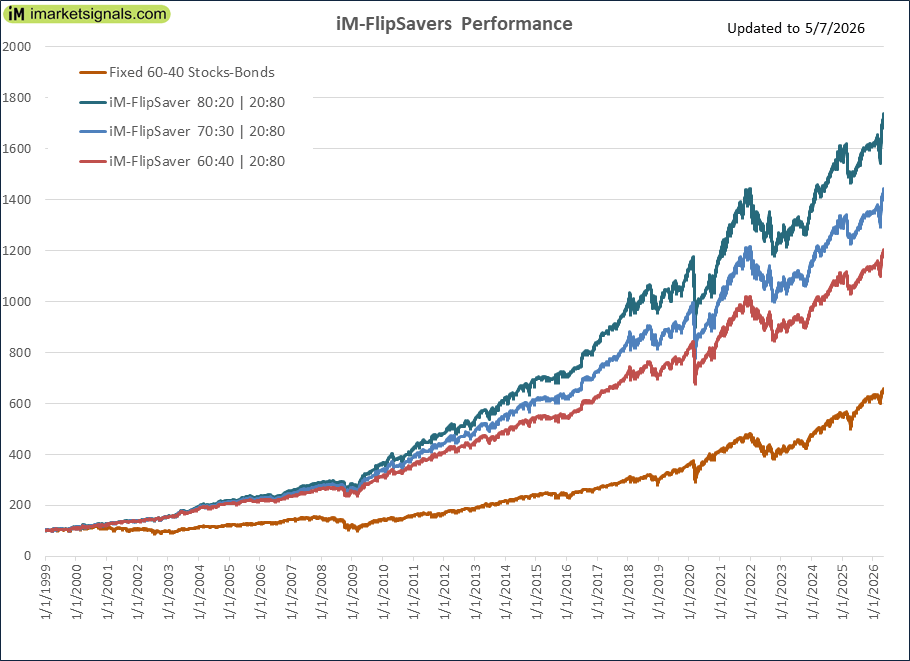 Performance graphs for iM-FlipSavers
iM-SuperTimer
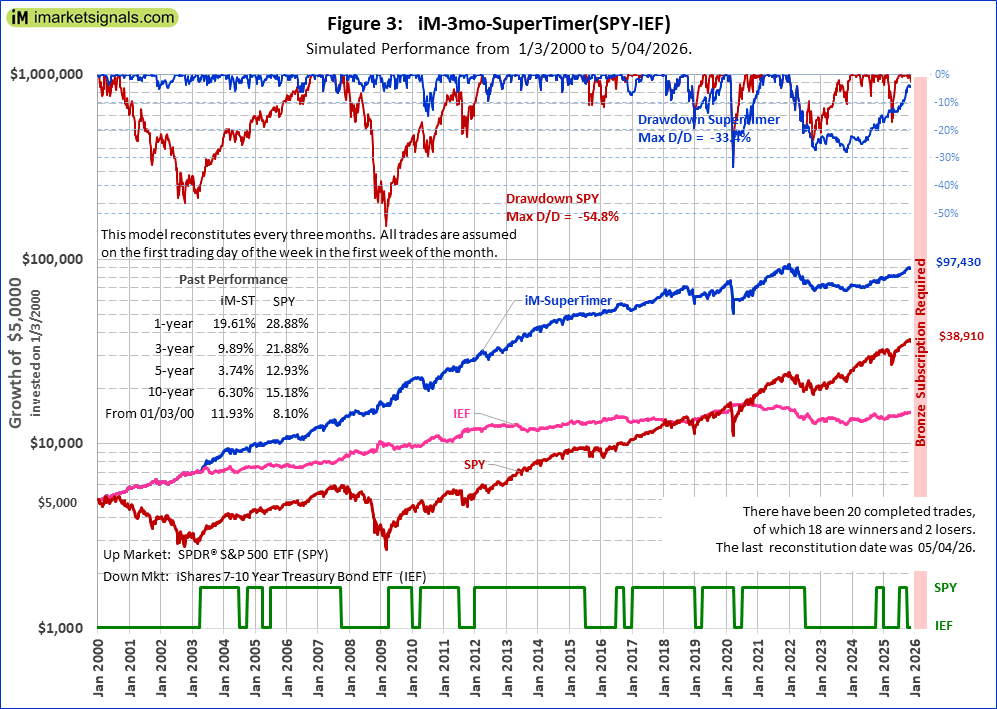 Performance graphs for iM-3mo-SuperTimer(SPY-IEF)
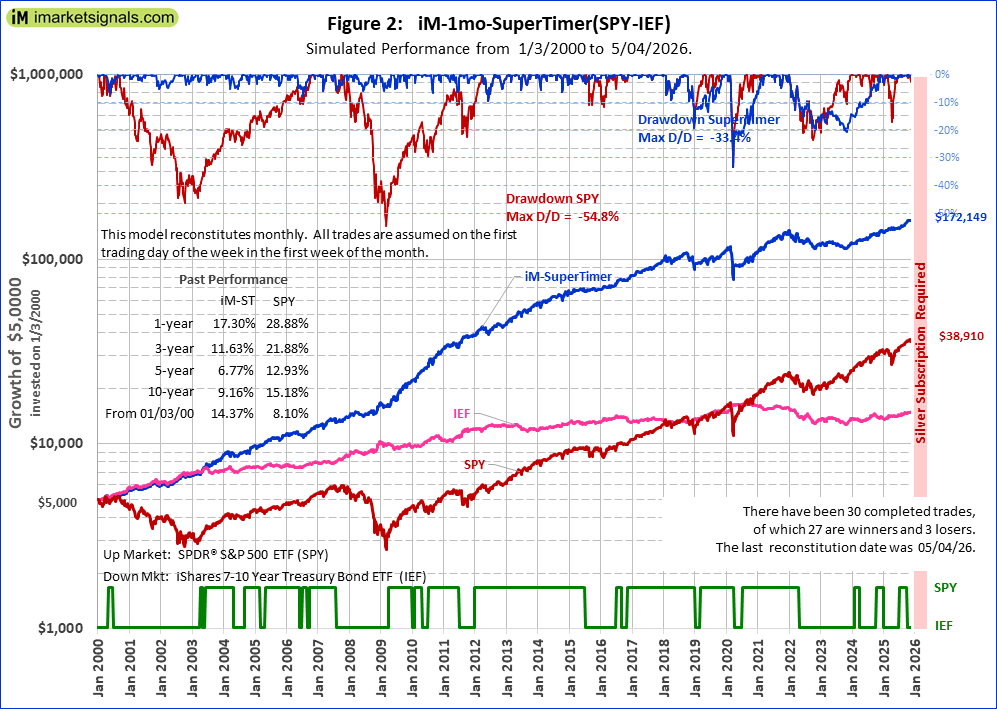 Performance graphs for iM-1mo-SuperTimer(SPY-IEF)
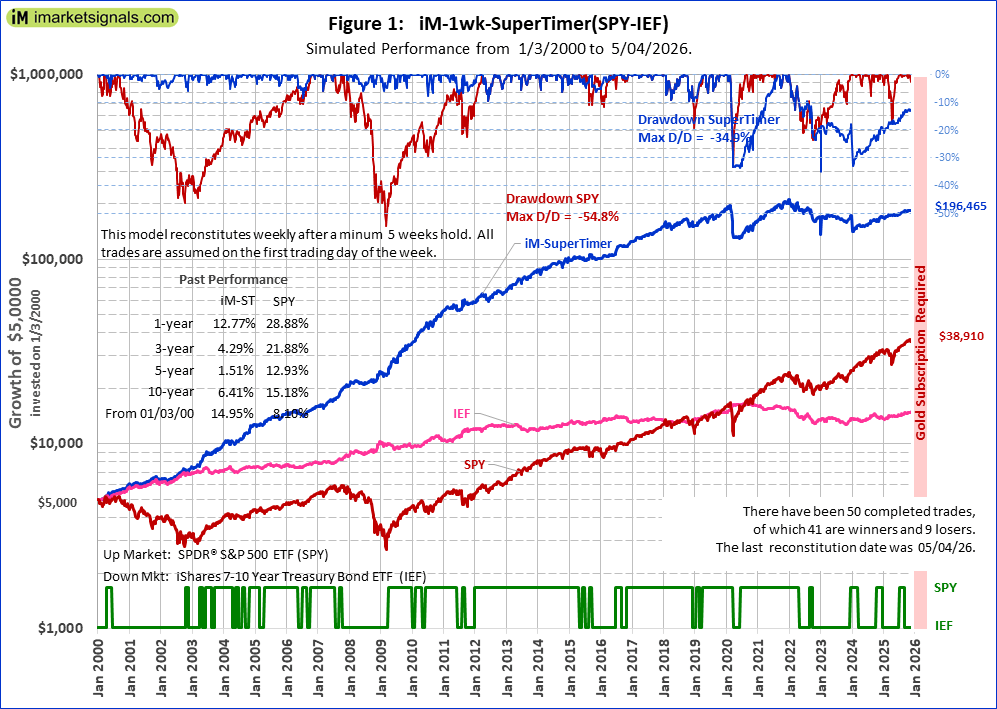 Performance graphs for iM-1wk-SuperTimer(SPY-IEF)
Monthly Updates
May 8, 2026
Unemployment
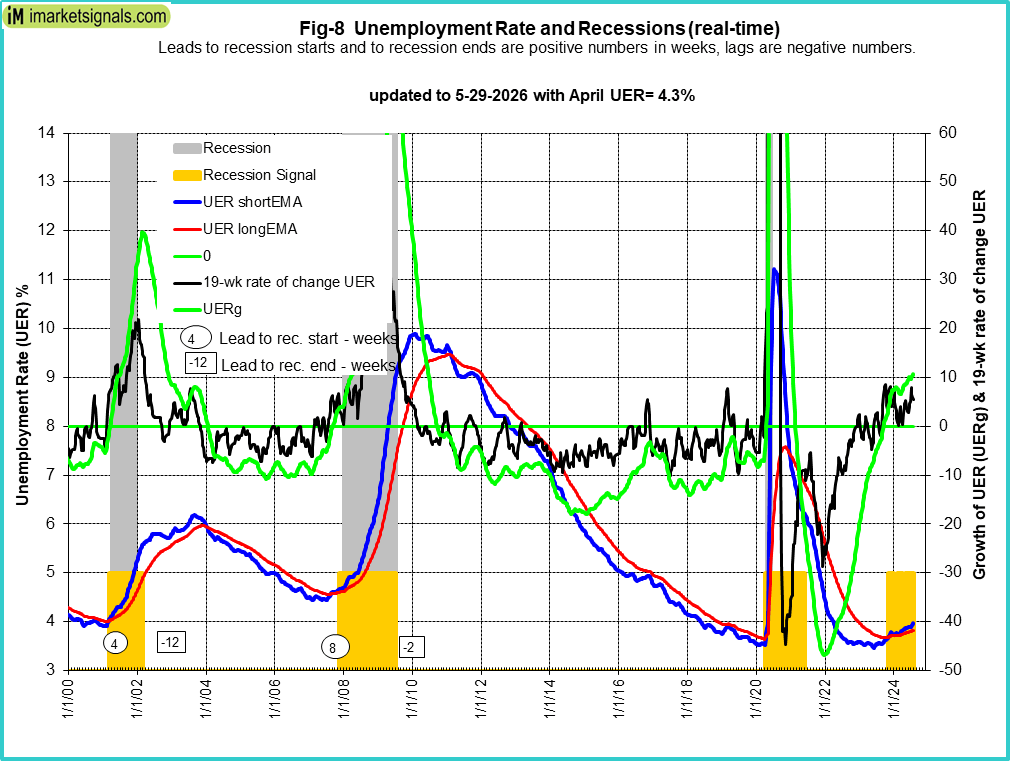
The 5/8/2026 BLS Employment Situation Report reports that the April 2026 unemployment rate remained unchanged at 4.3%.
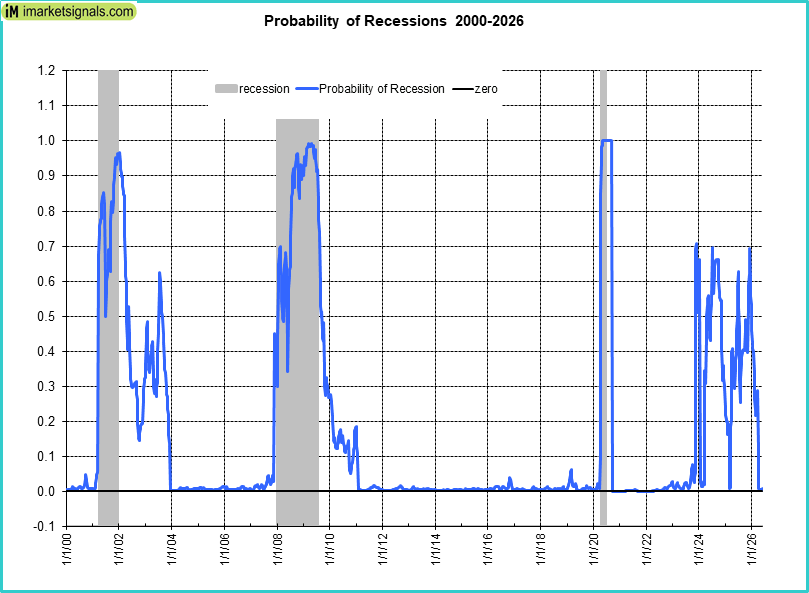
Our UER model does signal a recession with a near zero recession probability of (see graph).
CAPE-Cycle-ID
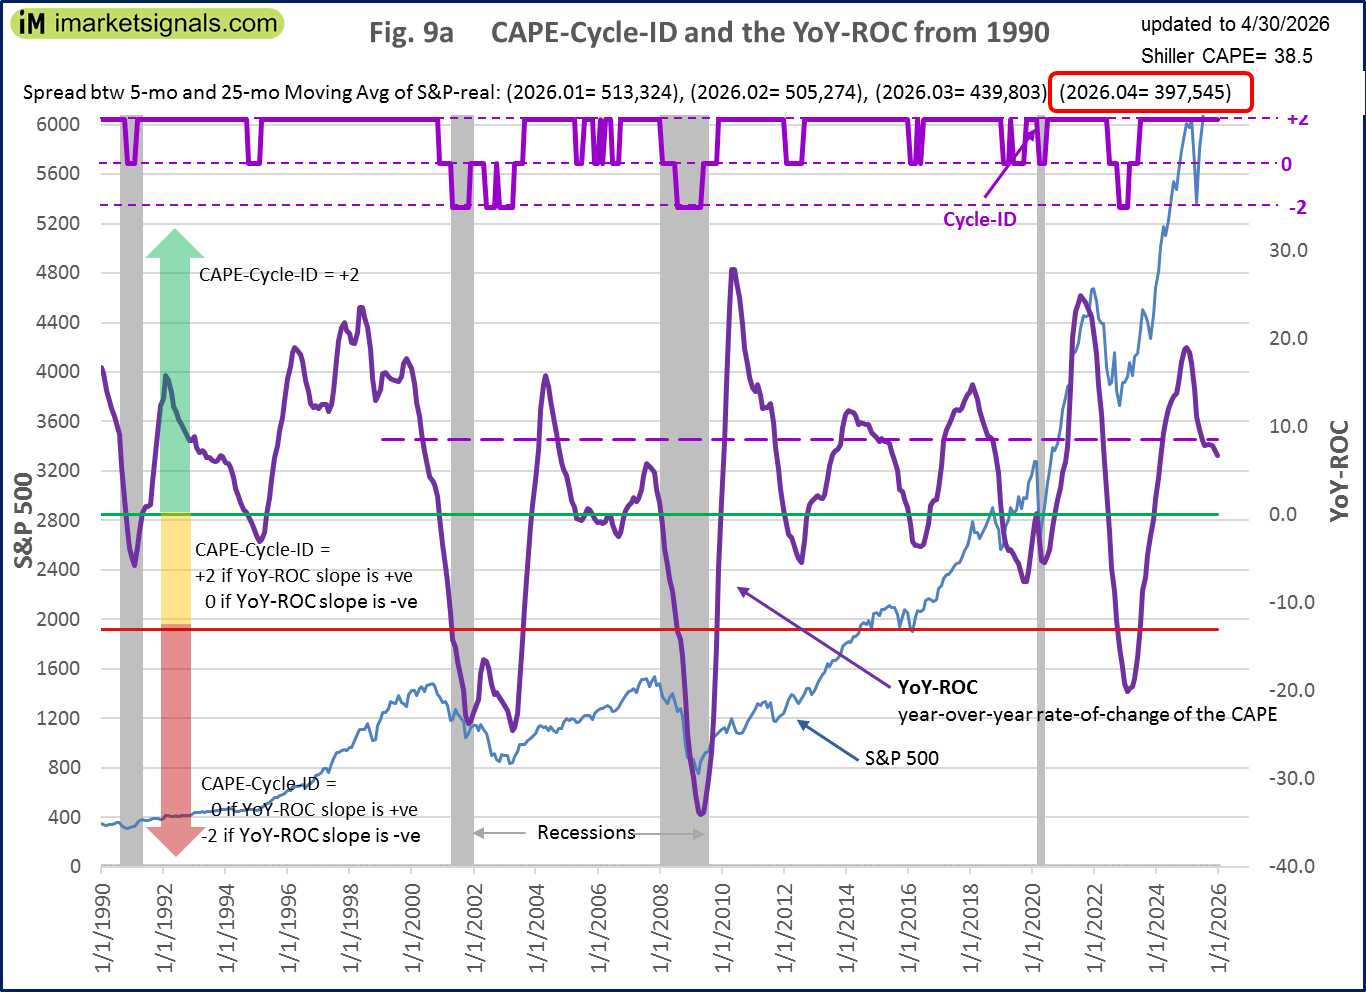 Fig 9a depicts the CAPE-Cycle-ID and the year-on-year rate-of-change of the Shiller CAPE; the level switched from -2 to 0 end of June 2023 generating a buy signal. This indicator now invested in the markets. This indicator is described here.
To avoid the bear market, exit stocks when the spread between the 5-month and 25-month moving averages of S&P-real becomes negative and simultaneously the CAPE-Cycle-ID score is 0 or -2. (read more)
Estimated Forward 10-Year Returns
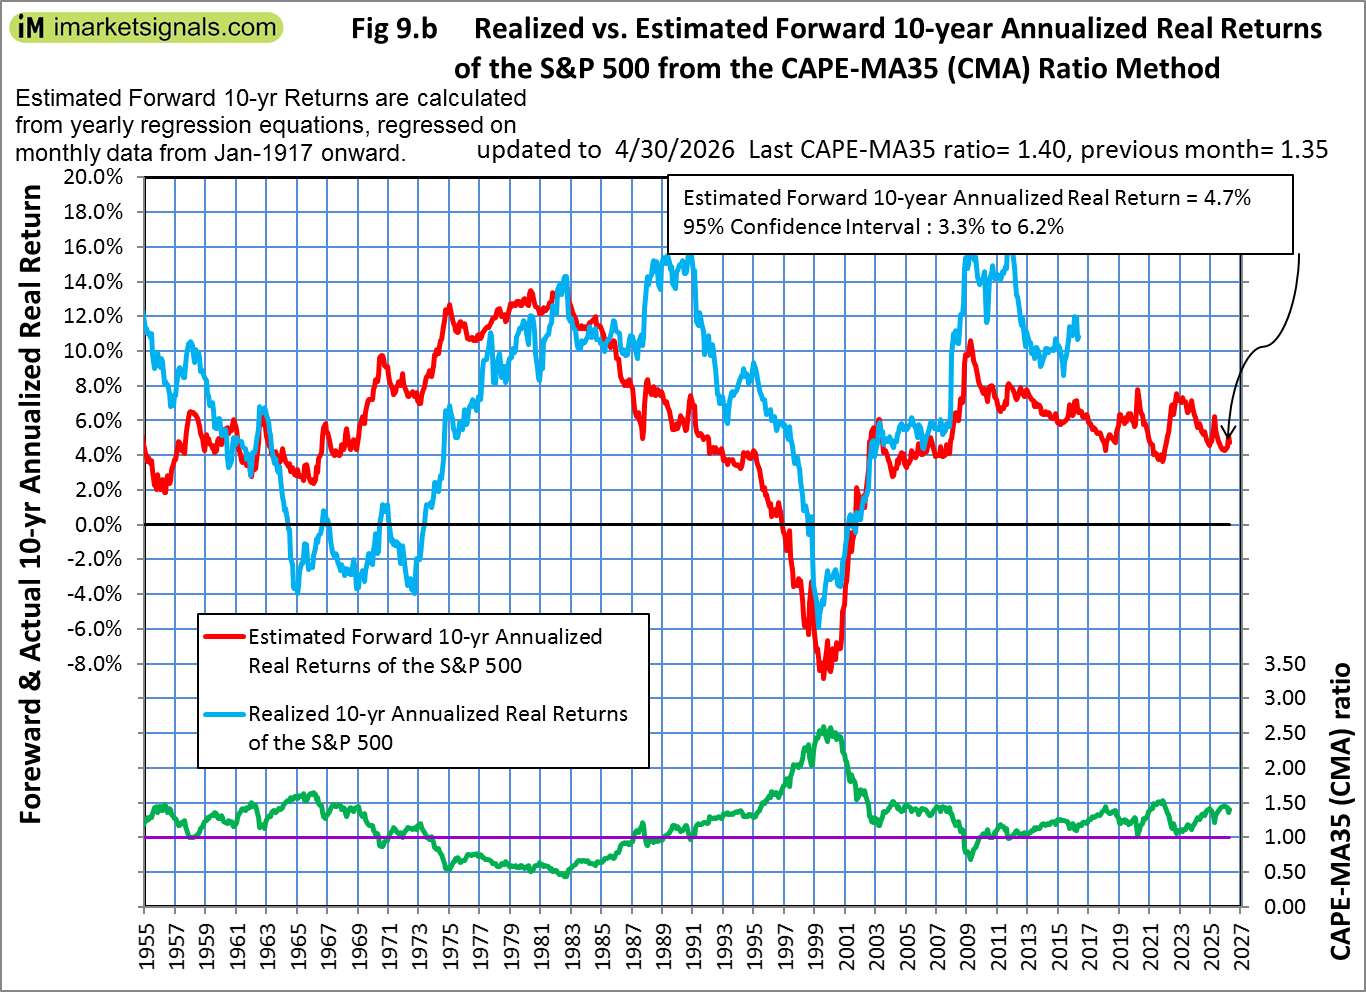 The estimated forward 10‐year annualized real return is 4.7% (previous month 5.0%) with a 95% confidence interval 3.3% to 6.2% (3.6% to 6.5%). Also refer to the Realized Forward 10-Year Returns vs. Inflation Rate
 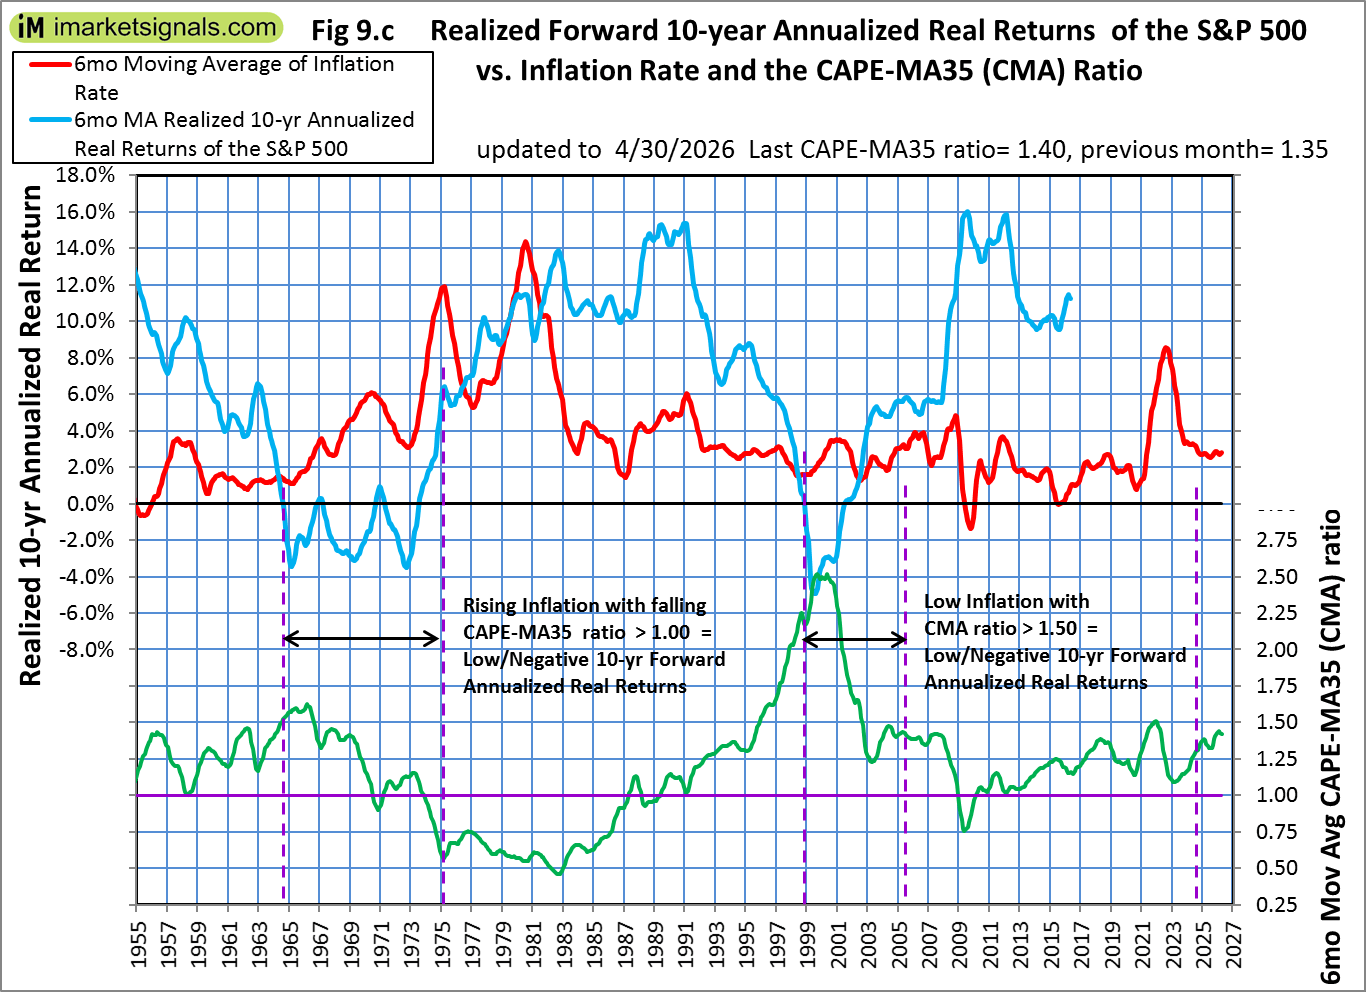 We may be in a rising inflation period with a falling CAPE-MA35 ratio similar to 1964-1973. This implies very low or negative 10 year forward annualized real returns, much lower than the returns indicated by regression analysis shown in the Estimated Forward 10-Year Returns.
.
iM-GT Timer
 The iM-GT Timer, based on Google Search Trends volume indicator is not invested in the stock markets since beginning November 2025. This indicator is described here.
Trade Weighted USD
 Will be updated later, the weekly FRED data series we used was discontinued and replacement series is daily and runs from 2015. We need to adapt our software and graphics first.
TIAA Real Estate Account
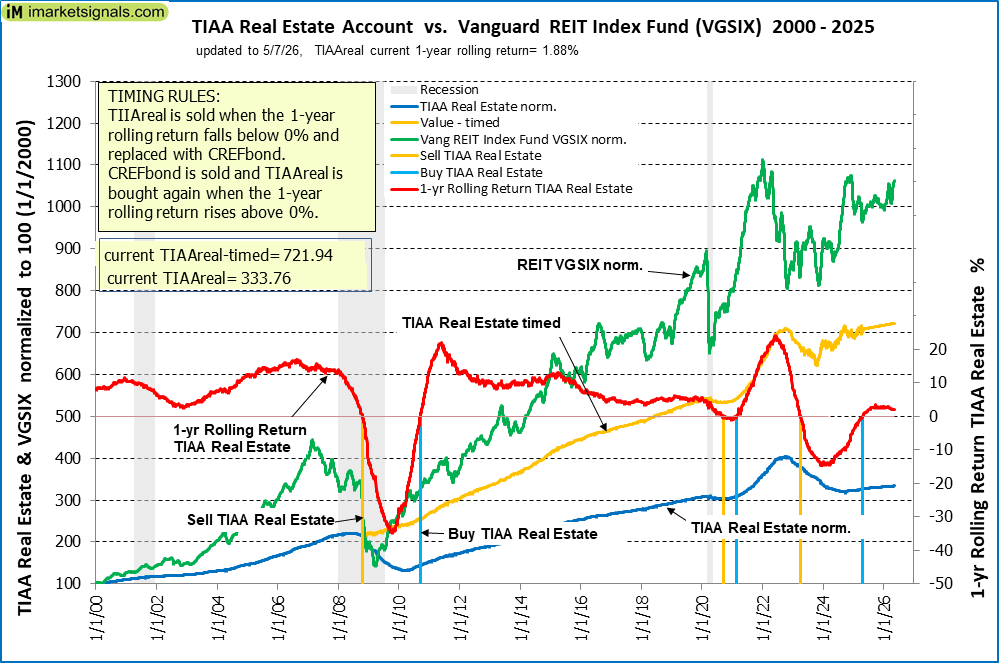 The 1-year rolling return is =1.88% (previous month 2.26%) and is invested in the TIAA Real Estate Account since beginning May 2025.