
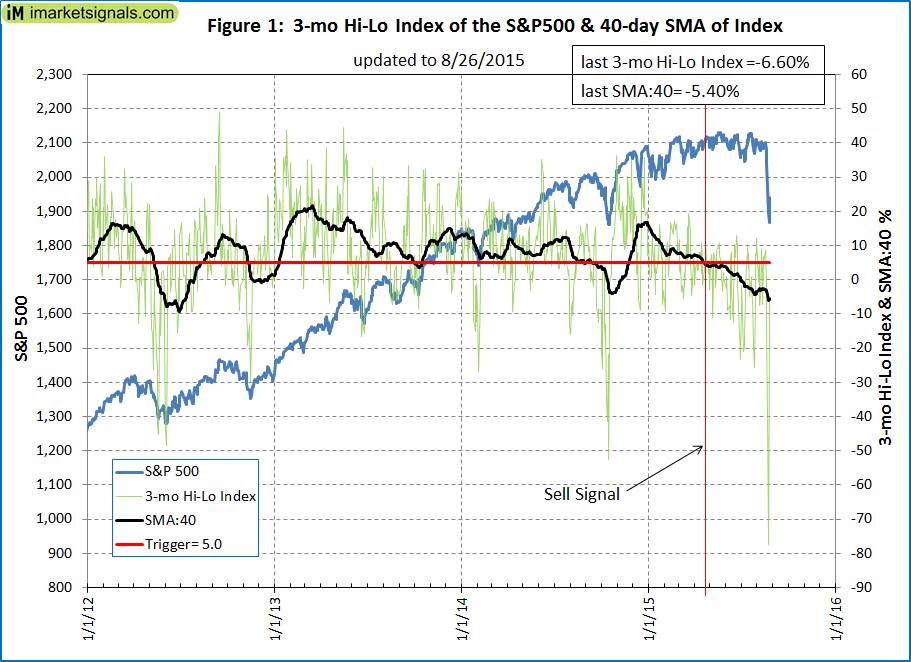
- This daily indicator is calculated as the ratio of the number of S&P500 stocks that have reached new 3-month-highs minus those that have reached new 3-month-lows, divided 500.
- Exiting and entering the stock market according the indicator’s signals would have avoided major drawdowns of the market during the backtest period from Jan-2000 to Aug-2015.
- Switching according to the signals between stock ETFs and the Intermediate Treasury Bond ETF IEF would have produced much higher returns and lower drawdowns than buy-and-hold of the stock ETFs.
The Hi-Lo Index
The index, expressed as a percentage, can vary from +100% to -100%. Over the backtest period it ranged from a minimum of -93% to a maximum of 62%, with the August 24, 2015 value being the third lowest at -77%, indicating that about 440 stocks of the S&P500 made a new 3-month low on that day.
Buy and Sell Rules
Trading signals are generated only at the end of a week, with trades following on the first trading day thereafter.
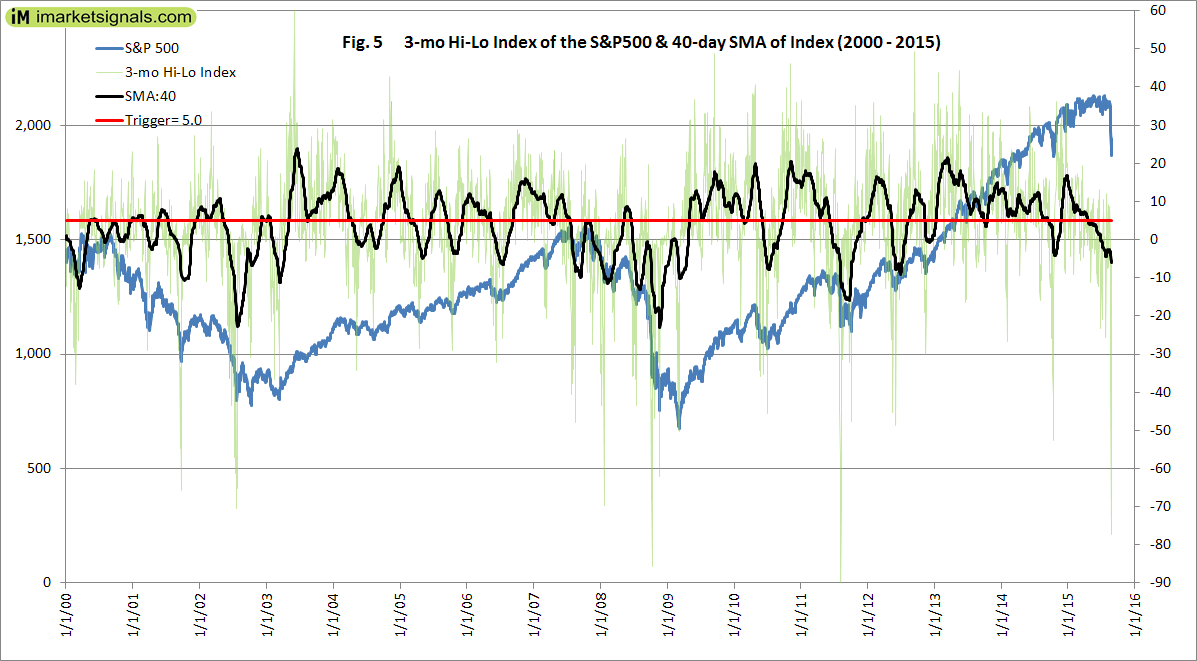
Figure 1 shows the Index and its 40-day moving average (SMA:40). The most recent sell signal was generated when the SMA:40 moved from above to below the trigger line on April 27, 2015. Currently the SMA:40 value is -5.4% and will have to increase to above a value of 5.0% for a buy signal.
Data analyzed: 40-day Moving Average (SMA:40) of the index.
Buy and Sell Rules:
- A stock market entry is signaled when SMA:40 of the (Hi-Lo) Index becomes greater than 5.0%.
- A stock market exit is signaled when SMA:40 of the (Hi-Lo) Index becomes less than 5.0%.
Performance
Figure 2 shows the performance from Jan-2000 to Aug-2015 of an investment in SPY, the ETF tracking the S&P500 adjusted for dividends, when following the signals and for buy&hold.
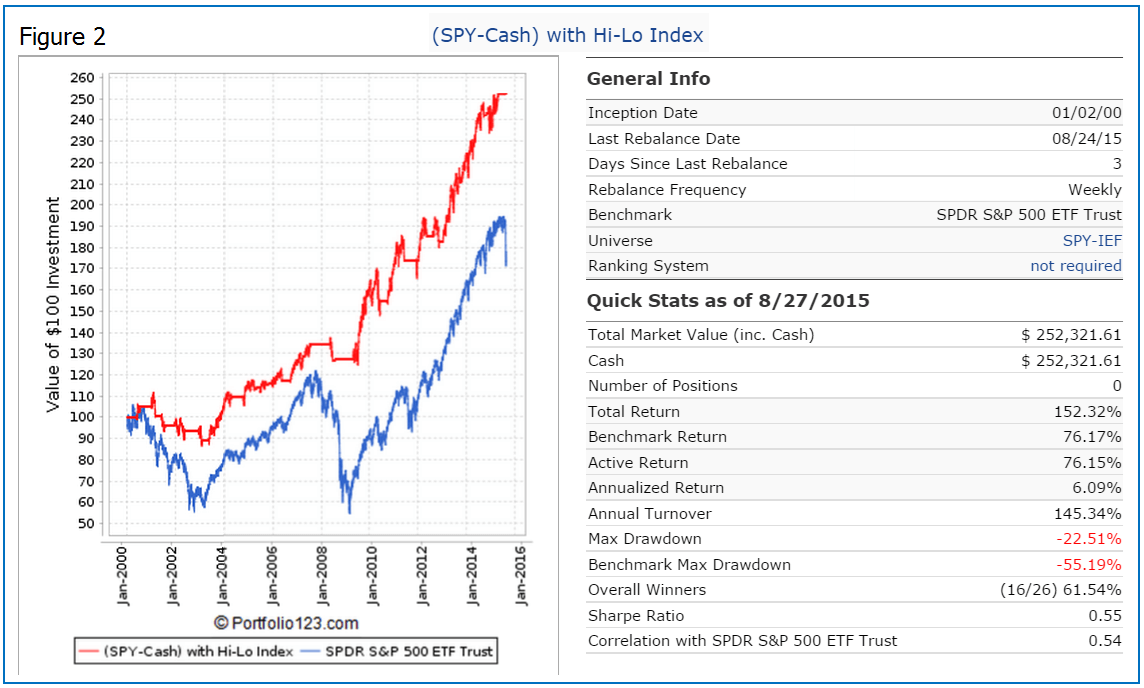
Following this market timer would have provided an annualized return of 6.1% with a maximum drawdown of minus 22.5%, assuming no trading costs. A constant investment in SPY would have returned only 3.5% annualized with a maximum drawdown of minus 55.2% over the same period. One would have been invested 54% of the time in SPY and 46% of the time in cash.
Figure 3 shows the performance of a trading system which switches to IEF, the intermediate Treasury Bond ETF, instead of cash when not in SPY.
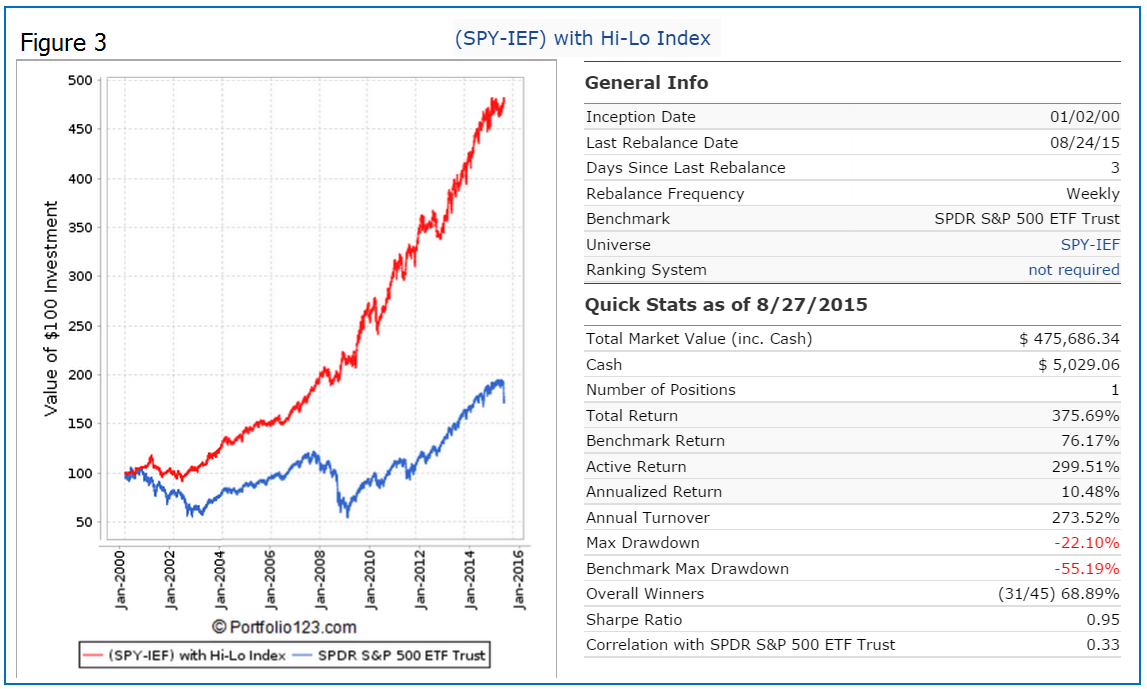
The ETFs are bought and sold at the next day’s average of the Low and High price after a signal is generated. Variable slippage of about 0.10% of a trade amount was applied to provide for transaction slippage and brokerage fees. This would have provided an annualized return of 10.5% with a maximum drawdown of minus 22.1%.
Better returns can be obtained by using the sector ETFs XLY or XLV instead of SPY. As an example, the performance when switching between XLV, the health care ETF, and IEF is shown in Figure 4.
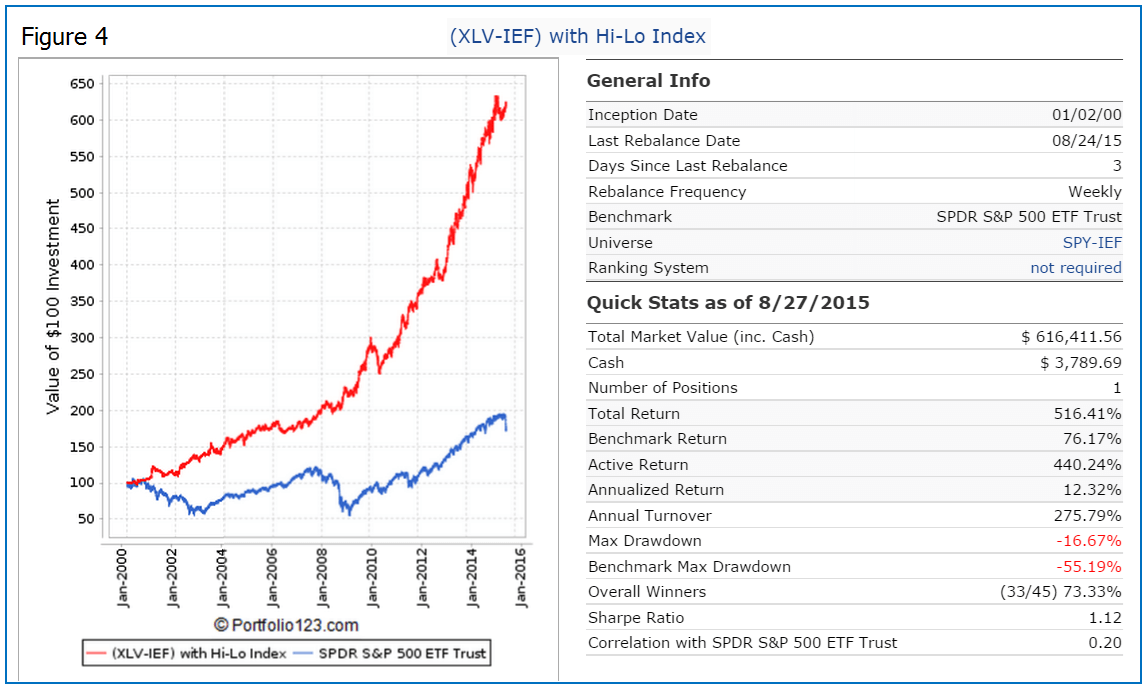
The annualized return would have been a high 12.3% with a maximum drawdown of only minus 16.7%. This is considerably better than the 6.8% annualized return of XLV with a maximum drawdown of minus 39.2% over the same period. In the almost 16 year long period there were only 45 completed trades with a win rate of 73%. Currently the model has been in IEF since April 27, 2015 and thus avoided the recent market decline.
Robustness
Robustness is the ability of a financial trading system to remain effective under different market conditions. Using an excessive number of parameters may induce overfitting. A model that has been overfitted will generally have poor predictive (out-of-sample) performance, as it can exaggerate minor fluctuations in the data.
This model uses only two parameters, the length of the moving average and the trigger value for the signals. The trigger value of 5% was found by optimizing the model which switches between SPY and cash, but using trigger values ranging from 3.5% to 6.0% all resulted in higher returns with lower drawdowns than a constant investment in SPY.
There is a “solid theory” behind this model, namely determining the trend of the S&P500 index by counting the number of stocks which make new 3-month highs and lows.
Also, since there are only two parameters that can be varied, and the trigger value is insensitive to variations by up to a fifth of its value, this model should be very robust and have good predictive performance characteristics.
Following the Hi-Lo Market Timer
This model can be followed live at iMarketSignals, where it will be updated weekly together with our other trading and timing models.
Appendix
The table below lists all buy/sell transactions that the 3-mo Hi-Lo Index would have generated since 1/3/2000, and the Figure 5 plots the index over said time period.
| Hi-Lo Index – Transactions 2000 to 2015 and Value of $100 invested on 1/3/2000 |
|||||
| Symbol | Open | Close | Days | Value | Pct |
| SPY | 12/1/2014 | 4/27/2015 | 147 | 519.70 | 2.69% |
| IEF | 9/2/2014 | 12/1/2014 | 90 | 504.43 | 1.80% |
| SPY | 10/28/2013 | 9/2/2014 | 309 | 486.65 | 13.82% |
| IEF | 10/7/2013 | 10/28/2013 | 21 | 427.60 | 1.07% |
| SPY | 1/14/2013 | 10/7/2013 | 266 | 419.31 | 14.38% |
| IEF | 11/19/2012 | 1/14/2013 | 56 | 365.62 | -1.65% |
| SPY | 8/13/2012 | 11/19/2012 | 98 | 369.68 | -1.90% |
| IEF | 5/14/2012 | 8/13/2012 | 91 | 375.12 | 1.11% |
| SPY | 1/17/2012 | 5/14/2012 | 118 | 367.12 | 3.98% |
| IEF | 12/27/2011 | 1/17/2012 | 21 | 353.13 | 1.31% |
| SPY | 12/5/2011 | 12/27/2011 | 22 | 347.86 | 0.10% |
| IEF | 6/13/2011 | 12/5/2011 | 175 | 343.81 | 6.98% |
| SPY | 9/27/2010 | 6/13/2011 | 259 | 318.36 | 11.41% |
| IEF | 6/14/2010 | 9/27/2010 | 105 | 283.61 | 6.21% |
| SPY | 3/22/2010 | 6/14/2010 | 84 | 267.06 | -4.96% |
| IEF | 3/1/2010 | 3/22/2010 | 21 | 281.03 | -0.05% |
| SPY | 5/4/2009 | 3/1/2010 | 301 | 276.52 | 24.45% |
| IEF | 6/23/2008 | 5/4/2009 | 315 | 214.27 | 7.51% |
| SPY | 5/12/2008 | 6/23/2008 | 42 | 199.33 | -5.64% |
| IEF | 7/23/2007 | 5/12/2008 | 294 | 203.52 | 9.45% |
| SPY | 4/30/2007 | 7/23/2007 | 84 | 185.20 | 3.38% |
| IEF | 4/9/2007 | 4/30/2007 | 21 | 179.25 | 1.01% |
| SPY | 9/18/2006 | 4/9/2007 | 203 | 176.48 | 9.43% |
| IEF | 5/22/2006 | 9/18/2006 | 119 | 158.84 | 1.22% |
| SPY | 12/12/2005 | 5/22/2006 | 161 | 155.46 | -0.06% |
| IEF | 9/19/2005 | 12/12/2005 | 84 | 153.36 | -2.27% |
| SPY | 6/20/2005 | 9/19/2005 | 91 | 156.89 | 1.40% |
| IEF | 2/28/2005 | 6/20/2005 | 112 | 152.87 | 1.63% |
| SPY | 10/4/2004 | 2/28/2005 | 147 | 148.85 | 5.74% |
| IEF | 4/19/2004 | 10/4/2004 | 168 | 138.13 | 0.97% |
| SPY | 9/8/2003 | 4/19/2004 | 224 | 135.28 | 9.89% |
| IEF | 8/18/2003 | 9/8/2003 | 21 | 123.14 | 1.10% |
| SPY | 5/12/2003 | 8/18/2003 | 98 | 120.86 | 6.34% |
| IEF | 1/6/2003 | 5/12/2003 | 126 | 112.18 | 3.48% |
| SPY | 12/9/2002 | 1/6/2003 | 28 | 107.80 | 2.06% |
| IEF | 5/20/2002 | 12/9/2002 | 203 | 104.53 | 7.07% |
| SPY | 12/17/2001 | 5/20/2002 | 154 | 97.03 | -3.11% |
| IEF | 7/16/2001 | 12/17/2001 | 154 | 99.90 | 0.27% |
| SPY | 5/29/2001 | 7/16/2001 | 48 | 99.62 | -4.97% |
| IEF | 3/5/2001 | 5/29/2001 | 85 | 104.82 | -2.09% |
| SPY | 1/2/2001 | 3/5/2001 | 62 | 107.06 | -4.28% |
| IEF | 6/12/2000 | 1/2/2001 | 204 | 111.82 | 7.23% |
| SPY | 5/22/2000 | 6/12/2000 | 21 | 104.23 | 4.80% |
| IEF | 1/3/2000 | 5/22/2000 | 140 | 99.50 | -0.50% |
Disclaimer
One should be aware that all results shown are from a simulation and not from actual trading. All results are presented for informational and educational purposes only and shall not be construed as advice to invest in any assets. Out-of-sample performance may be much different. Backtesting results should be interpreted in light of differences between simulated performance and actual trading, and an understanding that past performance is no guarantee of future results. All investors should make investment choices based upon their own analysis of the asset, its expected returns and risks, or consult a financial adviser. The designer of this model is not a registered investment adviser.
Great analysis and work gentleman. Thank you for putting this together.
DO YOU HAVE BACK TESTED TRADE DATES AVAILABLE FOR THIS SYSTEM?
Yes, the transactions can be found in the appendix of the article.
Excellent work!
One question about the backtest: have you used the S&P 500 history of stocks which joined and left at different times? This is important for creating a backtest environment which doesn’t have survivorship bias.
All data is point in time. Therefore this model is not affected by survivorship bias.
The better performance of IEF over cash from 2000 to present was during a different interest rate environment. Going forward don’t you think it prudent
to take this into consideration as IEF performance will be very different in the future.
Great work!
Thank You
That is why we show Figure 2, SPY-CASH. Also check this view-thread at Portfolio 123 where this indicator was discussed.
https://www.portfolio123.com/mvnforum/viewthread_thread,9071_offset,0
Which data source did you use to calculate the HiLo indicator. Where would I find the historical data and the symbols that were in the Index at any given time?
We use the point-in-time data of Portfolio 123 which also has the symbols which were in the index at any given time.
Excellent work and presentation. Thank you for sharing. How did you choose the +/-5% trigger points?
As stated in the article the trigger value of 5% was found by optimizing the model which switches between SPY and cash.
How often do you update this chart?
This model is updated weekly, usually on Friday. It is Fig-2.2, the third chart from the top of the Weekly Macro Signals.
George
Where did the Hi Lo index go? I used to be able to see it? Is it no longer available to Bronze level?
Simon White
Simon, Our site philosophy is Bronze subscription for macro signals, and Silver or Gold subscriptions for signals generated from in depth analysis of the stock markets. To follow the Hi-Lo index a Silver subscription is required.
Seems this is a possible alternative signal to be used in place of the MAC-US signal. Would you comment on the comparative relative merits of the two systems? Also I found by using the trade data table above in a spreadsheet there are some small errors in the cumulative value column vs the percentage column (may-jun 2008, for example). If I use the % column to evaluate CAGR I get about 8.7 vs. 10.7 using the value column?
I think the higher number is correct as it is more in line with the P123 report.
Backtests for (MAC-US to Cash) and (HI-Lo to Cash) show that the models have a relatively low correlation of 0.54. Annualized returns are 7.9% and 6.0%, respectively. If the models are combined in a combo then annualized return becomes 7.1% with a max D/D of -13% from Jan-2000 to Nov-2015. (Note the models switch to cash, not to IEF)
Over same period buy-and-hold SPY with dividends annualized return was 4.2% with a max D/D= -55%.
So the MAC-US may be preferable. Also it was backtested for 65 years, whereas the Hi-Lo was only backtested over 16 years.
How would I choose to follow your “Asset Allocation Using Economic Indicators” model ? I would like to see your work.
DJD
This model is based mainly on the ECRI WLI which became unreliable after the last recession. We discontinued reporting this model in November 2015.
You have posted a number of market timing systems including the “3 Month Hi Low”…Which one do you feel provides the best overall results ? I don’t know how far back your data goes to find out if they would have protected the investor during all the major sell offs ? This I think would be key in any system.
DJD
No single timing system provides the best overall results.
We have the Market Climate Grader which combines four timing systems:
https://imarketsignals.com/2015/assessing-market-climate-with-ims-market-climate-grader/
We also have the (SPY-IEF) Market Timer which combines three timing systems:
https://imarketsignals.com/2015/spy-ief-market-timer/
Hi Georg,
I am trying to replicate this study on FTSE 100 Index for my Masters Thesis. Do you think it’s a good idea?
You’ve mentioned that “This model is based mainly on the ECRI WLI which became unreliable after the last recession. We discontinued reporting this model in November 2015.”
Does it mean this model is not good as a research topic?
The Hi-Lo study has nothing to do with the WLI. I think you are referring to the IBH model which we discontinued due to the WLI becoming unreliable.
The Hi-Lo Index methodology can obviously be applied to the FTSE 100 Index as well, if you can get hold of the necessary data. Please let us know your findings when done.
Georg,
It would be great if the charts and results for this model could be updated to show returns beyond 2015. Particularly since it is now switching to EXIT on SPY.
Charley,
The Hi-Lo Index IS updated regularly. You can see it here:
https://imarketsignals.com/wp-content/uploads/2021/10/Fig-2.2-10-1-2021.png