–

Blog Archives
iM Update – May 30, 2014
Posted in pmp free update
BCI May 29, 2014
 The BCI at 171.6 is up from last week’s upward revised 170.6. The BCIg, the smoothed annualized growth of BCI, at 16.2 is also up from last week’s upward revised 15.7.
Read more >
Posted in pmp BCI
iM Update* – May 23, 2014
 The BVR-model avoids high beta bonds (long-bonds) and also intermediate duration bonds. The Bond Value Ratio is shown in Fig 4. The BVR is a bit lower than last week’s level. According to the model, only when BVR turns upward after having been lower than the lower offset-line should one consider long bonds again.
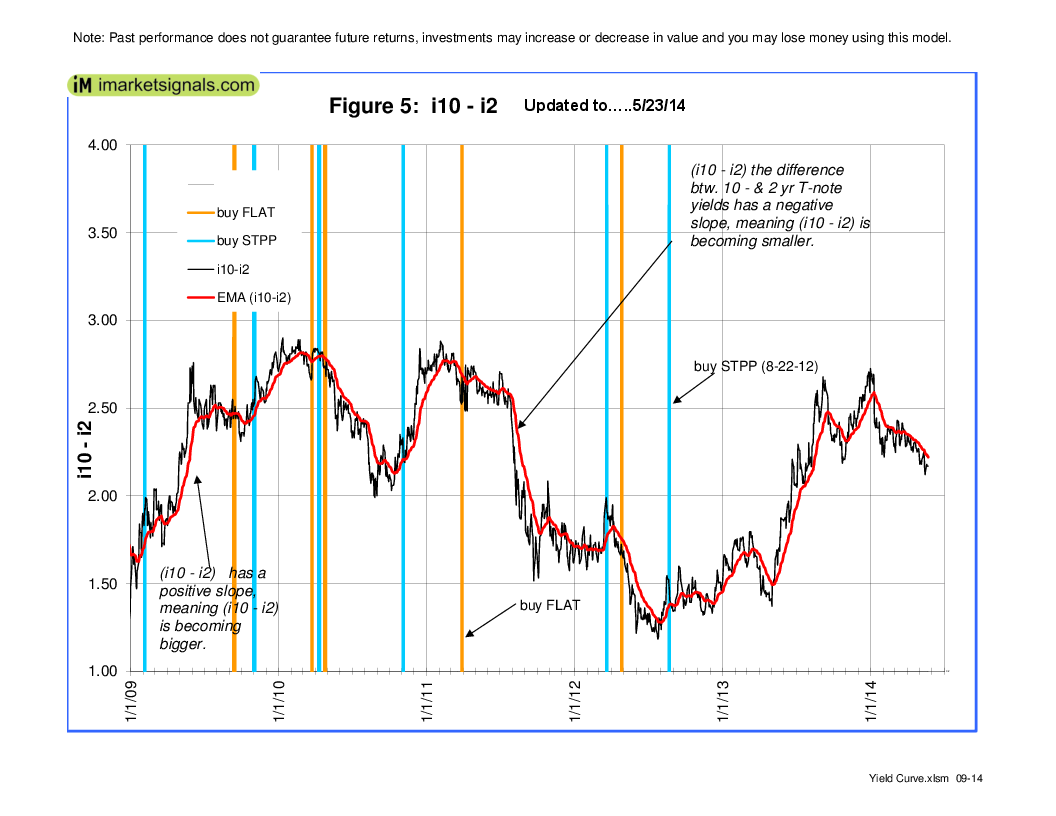 The yield curve model shows the generally steepening trend of the 10-year and 2-year Treasuries yield spread. Figure 5 charts (i10 – i2). The general trend is up, as one can see, although the yield curve has flattened recently. FLAT and STPP are ETNs. STPP profits from a steepening yield curve and FLAT increases in value when the yield curve flattens. This model confirms the direction of the BVR.
Posted in pmp paid update
BCI May 22, 2014
 The BCI is unchanged from last week’s 168.8. However, the BCIg, the smoothed annualized growth of BCI, is down at 14.3 from last week’s 14.9.
Read more >
Posted in pmp BCI
Best(SPY-SH) and Combo3 – 5/19/2014
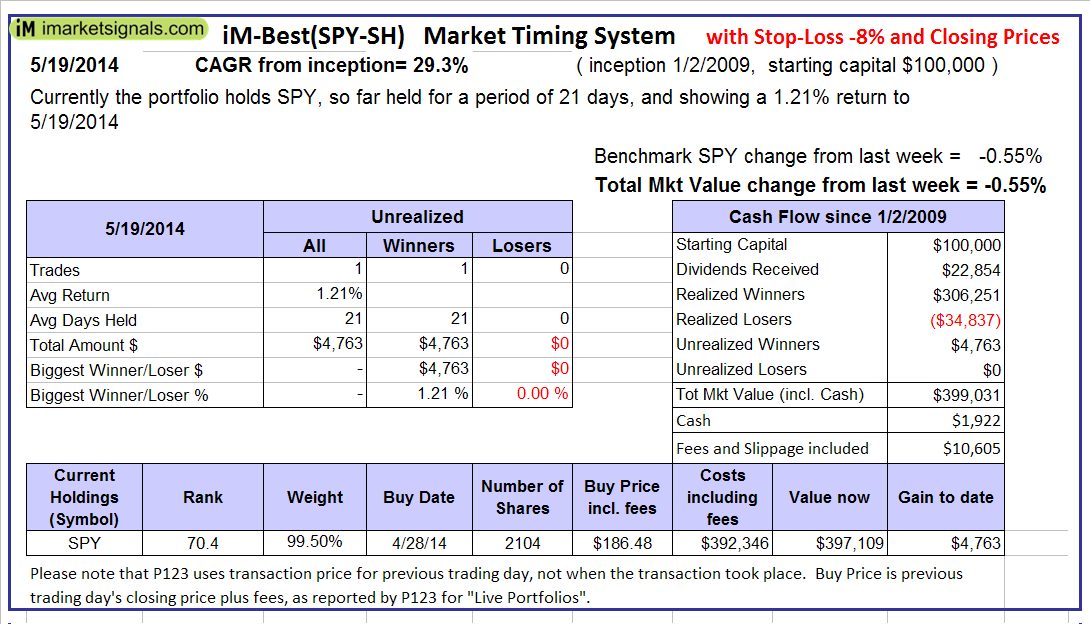 The iM-Best(SPY-SH) model currently holds SPY, so far held for a period of 21 days, and showing 1.21% return to5/19/2014
Read more >
Posted in pmp SPY-SH
iM Update* – May 16, 2014
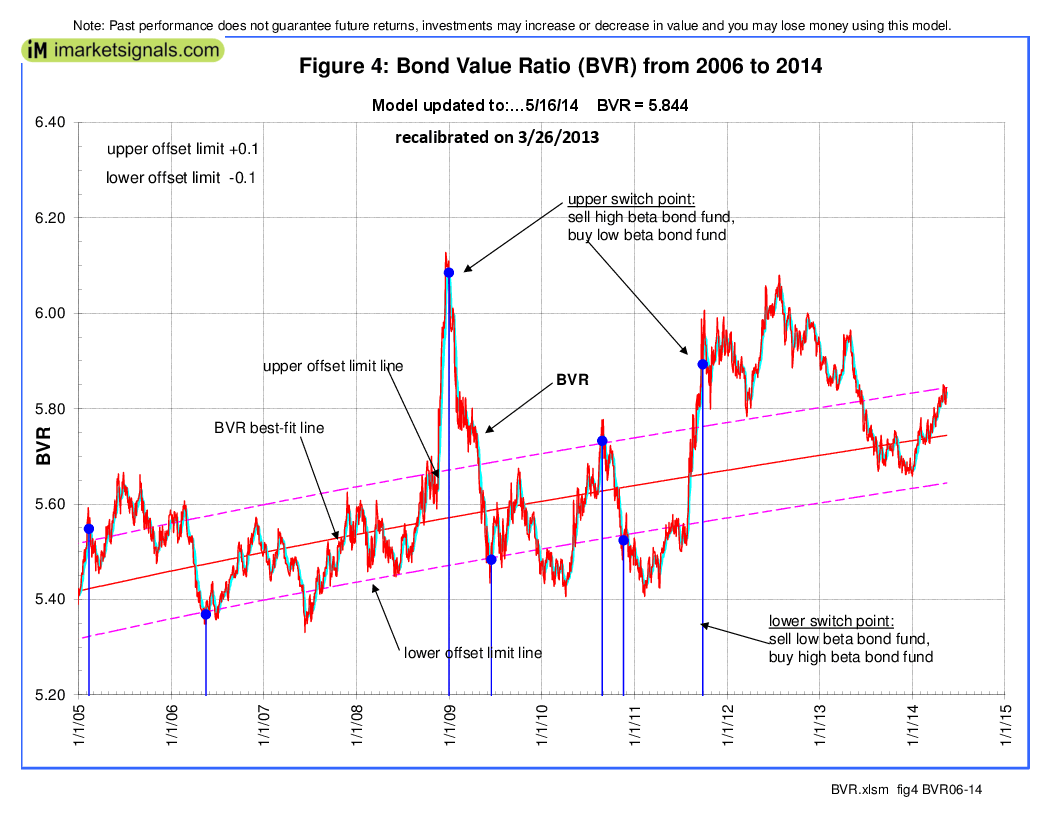 The BVR-model avoids high beta bonds (long-bonds) and also intermediate duration bonds. The Bond Value Ratio is shown in Fig 4. The BVR is near last week’s level. According to the model, only when BVR turns upward after having been lower than the lower offset-line should one consider long bonds again.
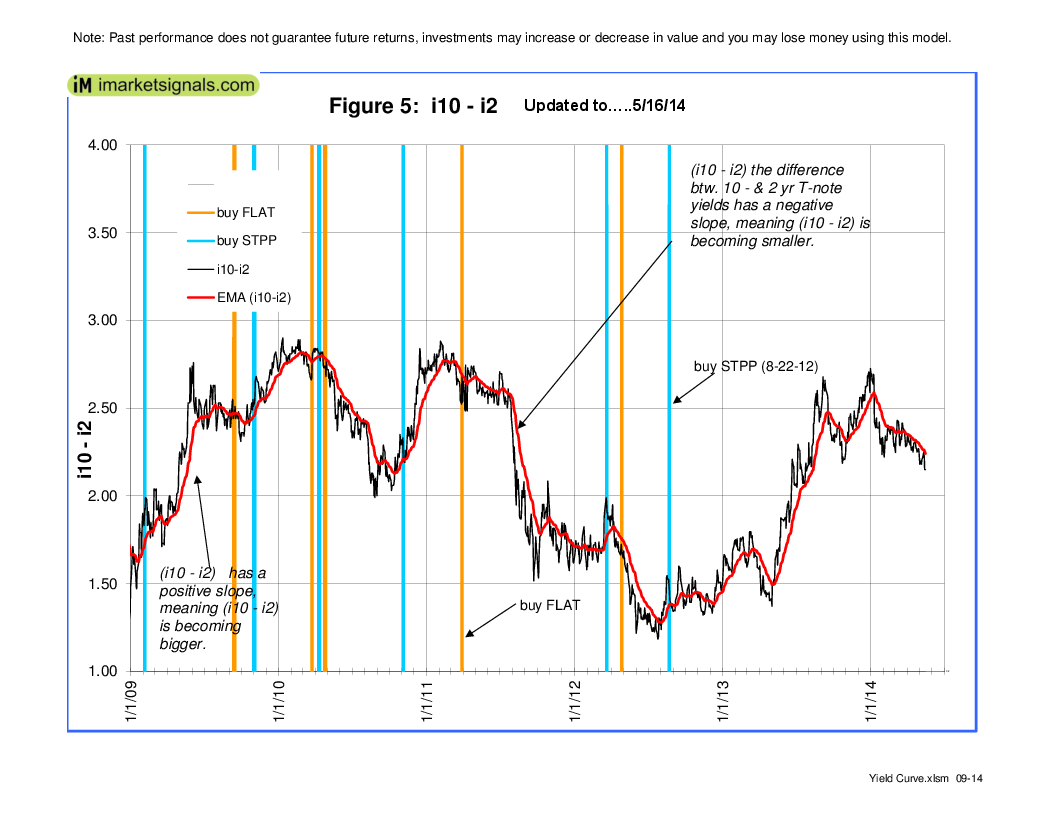 The yield curve model shows the generally steepening trend of the 10-year and 2-year Treasuries yield spread. Figure 5 charts (i10 – i2). The general trend is up, as one can see, although the yield curve has flattened recently. FLAT and STPP are ETNs. STPP profits from a steepening yield curve and FLAT increases in value when the yield curve flattens. This model confirms the direction of the BVR.
Posted in pmp paid update
BCI May 15, 2014
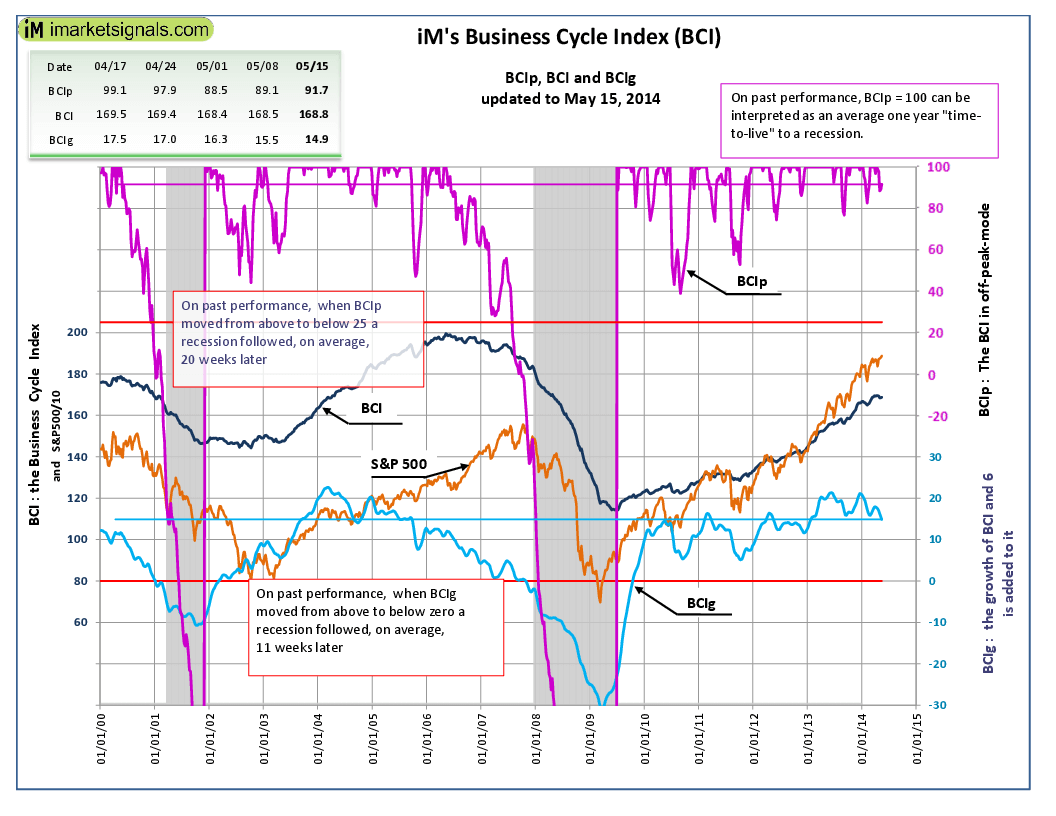 The BCI at 168.8 is up from last week’s 168.5. However, the BCIg, the smoothed annualized growth of BCI, is down at 14.9 from last week’s 15.5.
Read more >
Posted in pmp BCI
With reference to Section 202(a)(11)(D) of the Investment Advisers Act:
We are Engineers and not Investment Advisers,
read more ...
By the mere act of reading this page and navigating this site you acknowledge, agree to, and abide by the
Terms of Use / Disclaimer