–

Blog Archives
iM Update – August 11, 2018
Posted in pmp free update
iM-Best Reports – 8/6/2018
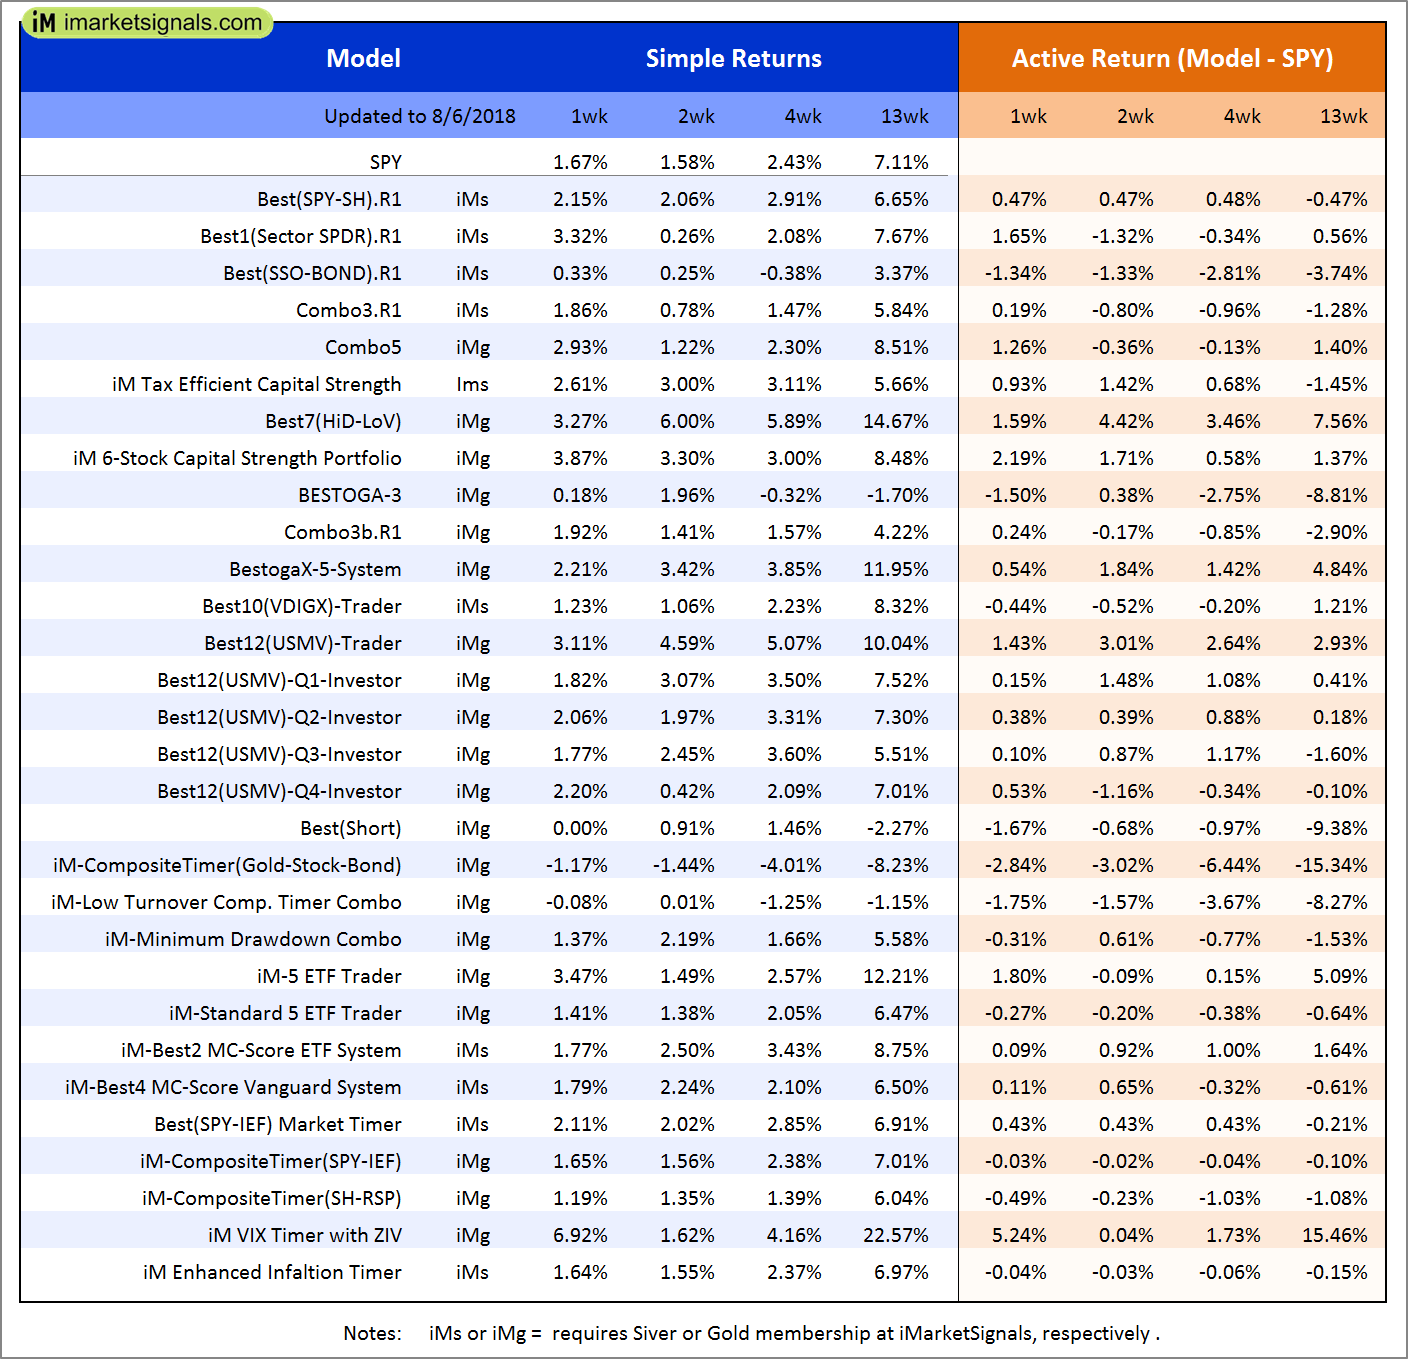  |
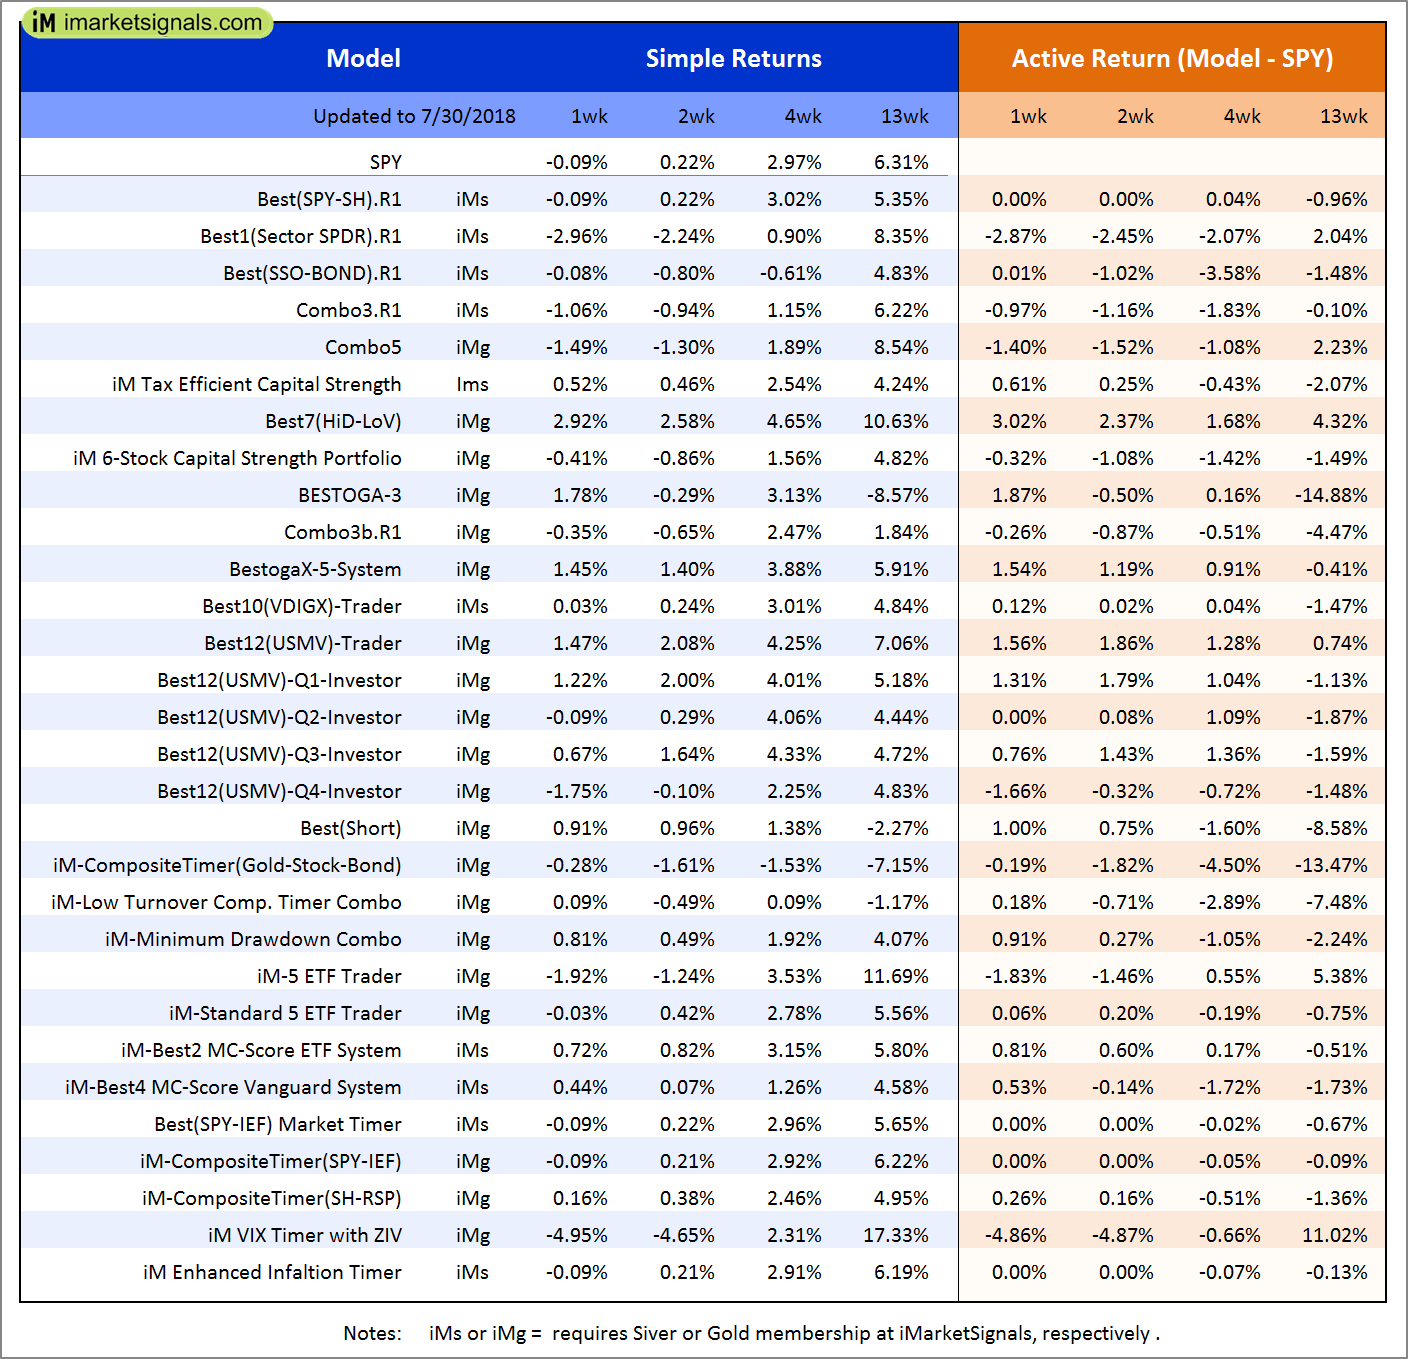
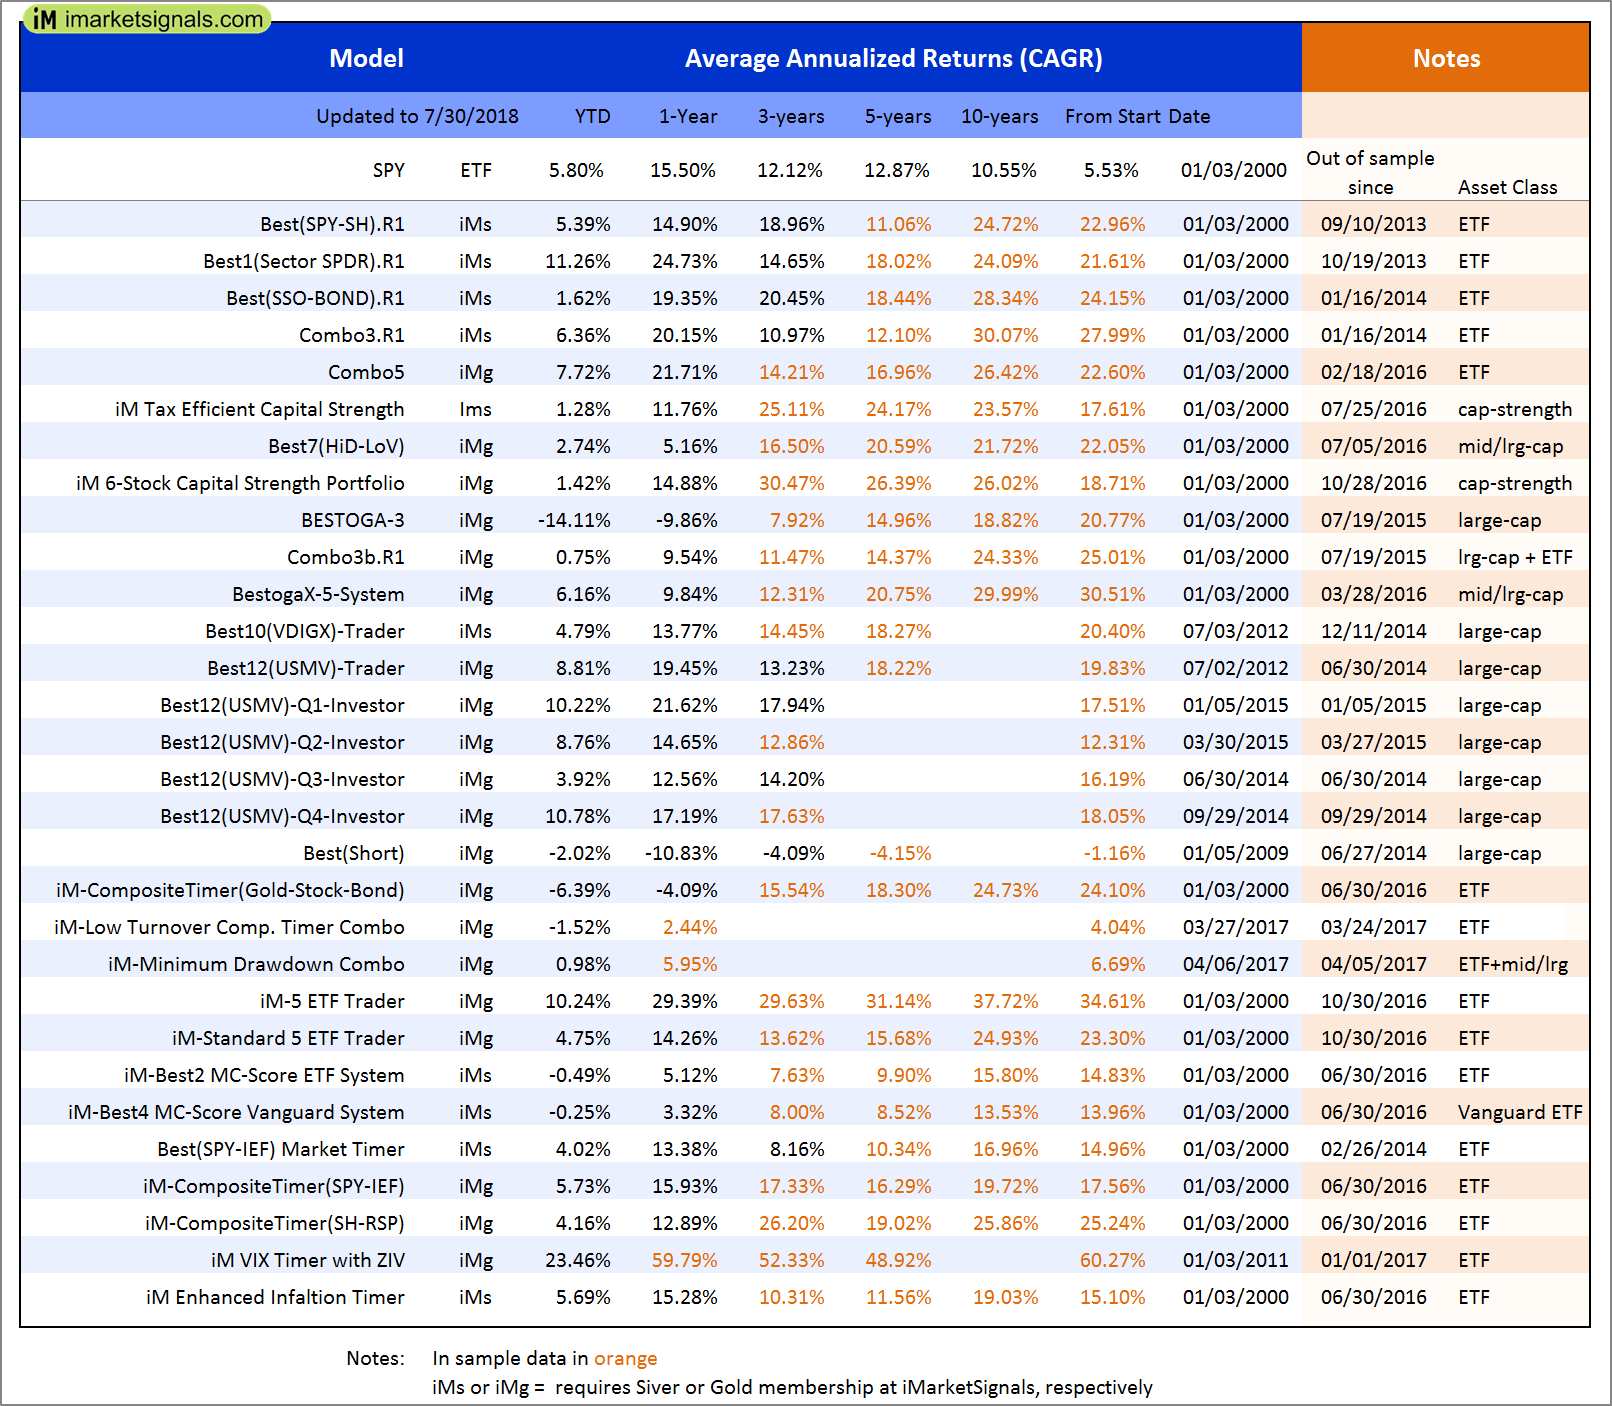
Out of sample performance summary of our models for the past 1, 2, 4 and 13 week periods. The active active return indicates how the models over- or underperformed the benchmark ETF SPY. Also the YTD, and the 1-, 3-, 5- and 10-year annualized returns are shown in the second table |
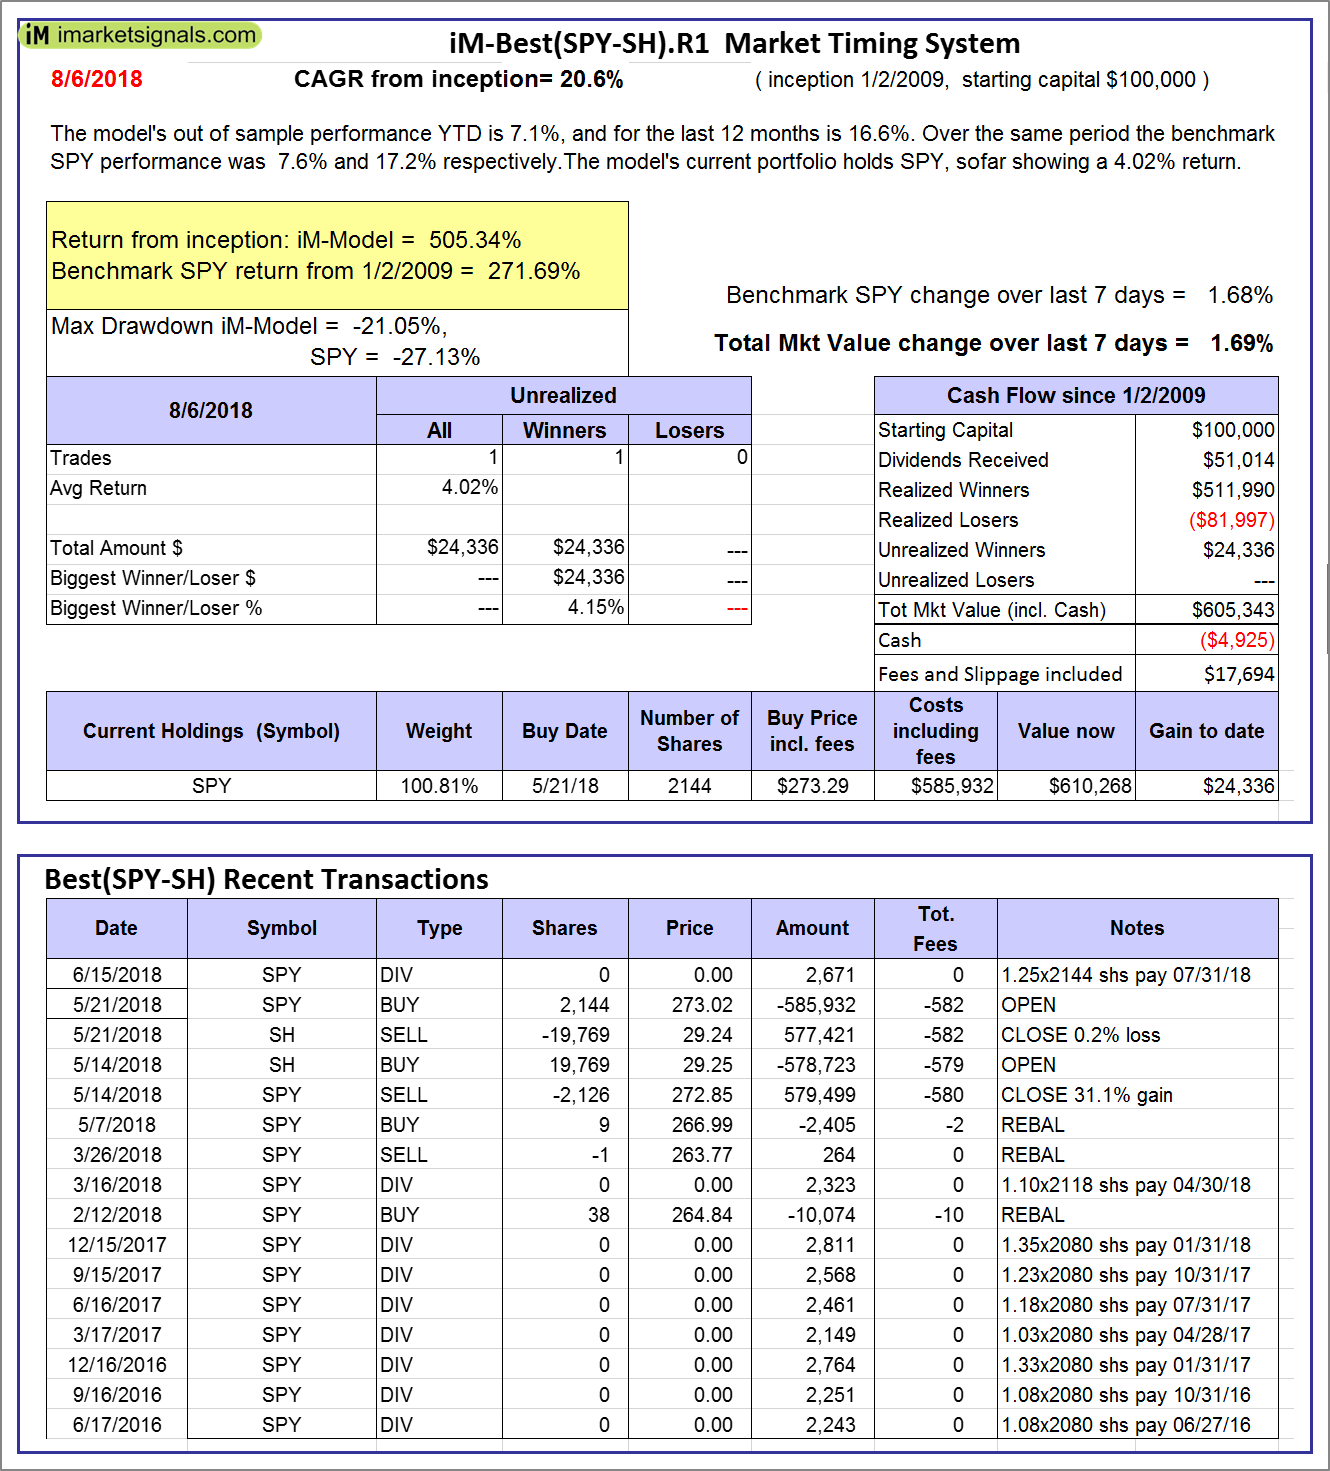 |
iM-Best(SPY-SH).R1: The model’s out of sample performance YTD is 7.1%, and for the last 12 months is 16.6%. Over the same period the benchmark SPY performance was 7.6% and 17.2% respectively. Over the previous week the market value of Best(SPY-SH) gained 1.69% at a time when SPY gained 1.68%. A starting capital of $100,000 at inception on 1/2/2009 would have grown to $605,343 which includes -$4,925 cash and excludes $17,694 spent on fees and slippage. |
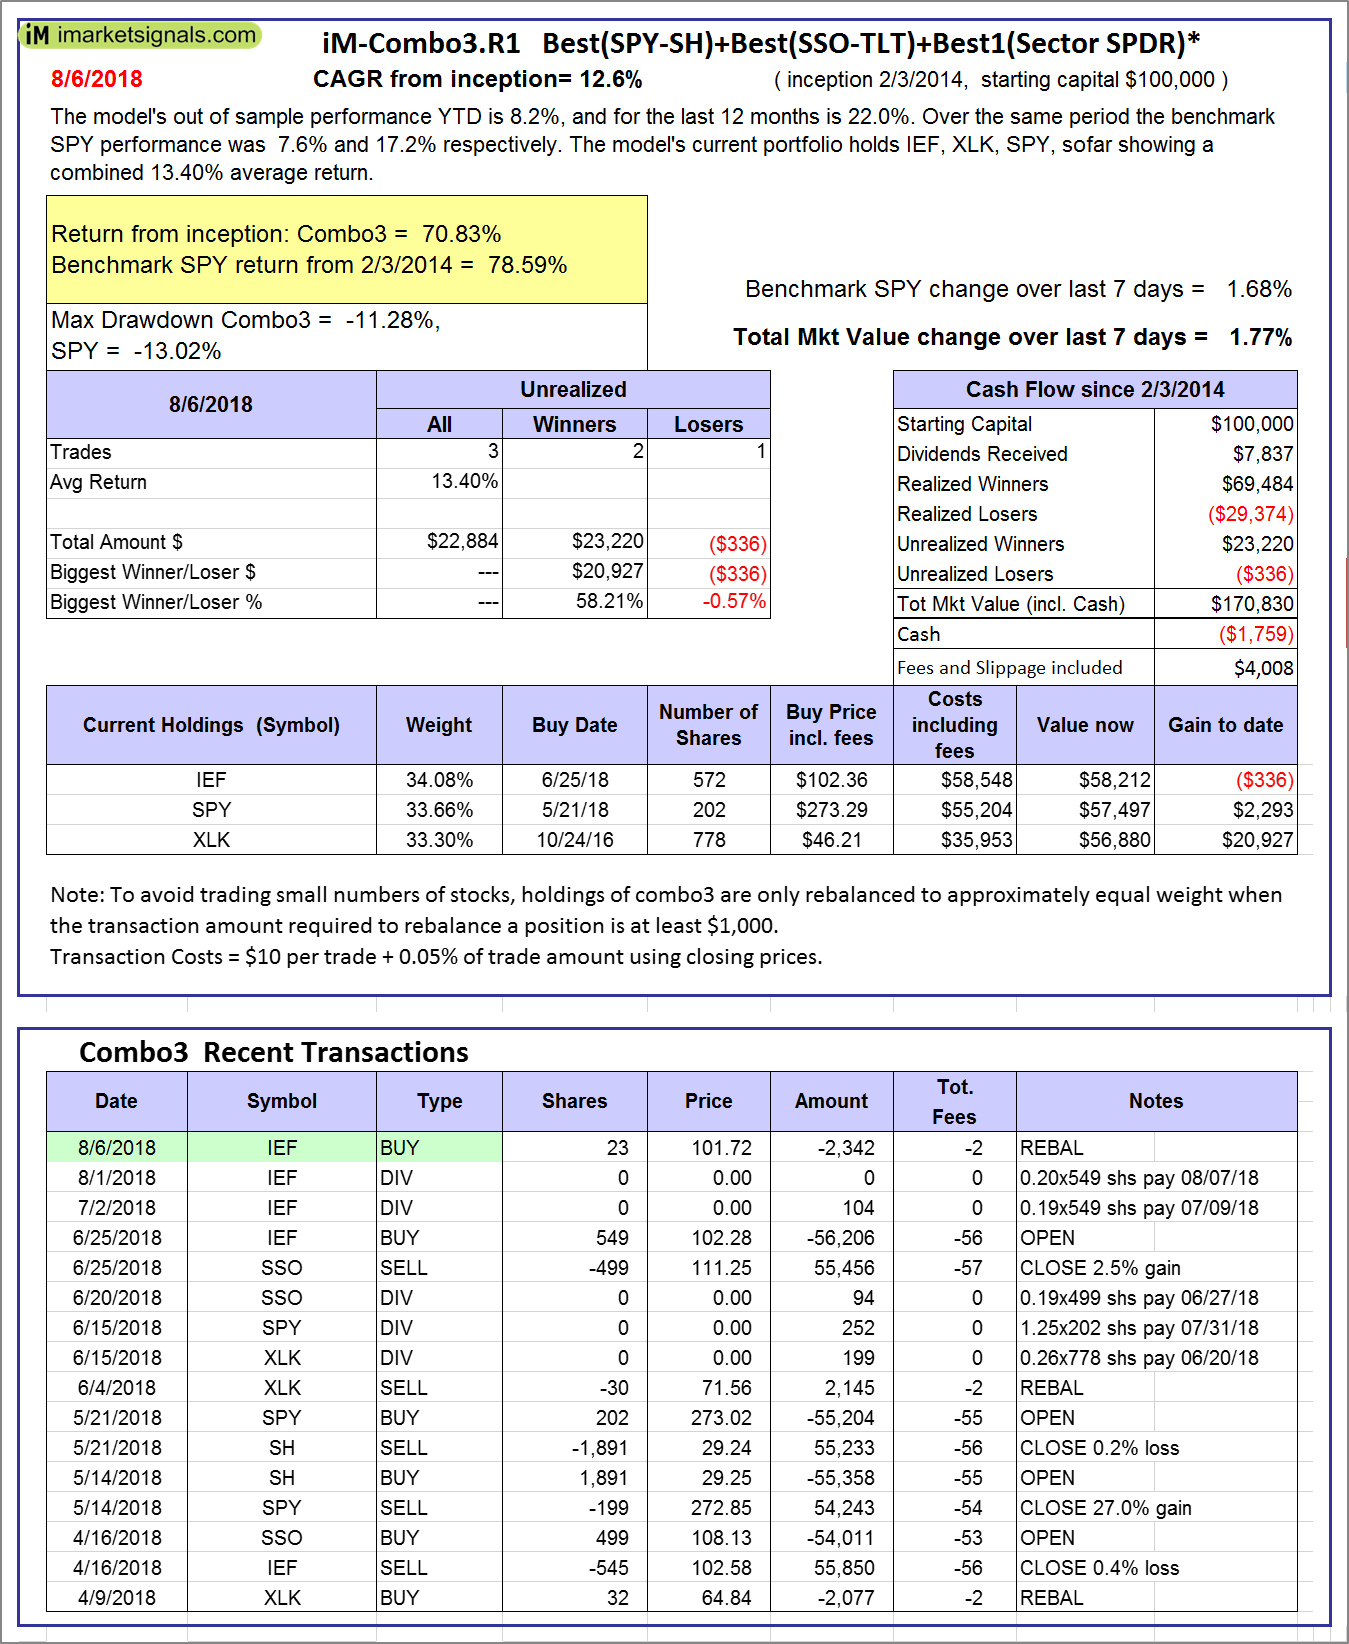 |
iM-Combo3.R1: The model’s out of sample performance YTD is 8.2%, and for the last 12 months is 22.0%. Over the same period the benchmark SPY performance was 7.6% and 17.2% respectively. Over the previous week the market value of iM-Combo3.R1 gained 1.77% at a time when SPY gained 1.68%. A starting capital of $100,000 at inception on 2/3/2014 would have grown to $170,830 which includes -$1,759 cash and excludes $4,008 spent on fees and slippage. |
 |
iM-Combo5: The model’s out of sample performance YTD is 10.4%, and for the last 12 months is 24.7%. Over the same period the benchmark SPY performance was 7.6% and 17.2% respectively. Over the previous week the market value of iM-Combo5 gained 2.75% at a time when SPY gained 1.68%. A starting capital of $100,000 at inception on 2/22/2016 would have grown to $141,264 which includes $1,965 cash and excludes $983 spent on fees and slippage. |
  |
iM-Best10(VDIGX)-Trader: The model’s out of sample performance YTD is 5.8%, and for the last 12 months is 14.2%. Over the same period the benchmark SPY performance was 7.6% and 17.2% respectively. Since inception, on 7/1/2014, the model gained 88.63% while the benchmark SPY gained 57.40% and VDIGX gained 49.50% over the same period. Over the previous week the market value of iM-Best10(VDIGX) gained 1.03% at a time when SPY gained 1.68%. A starting capital of $100,000 at inception on 7/1/2014 would have grown to $188,259 which includes $426 cash and excludes $2,343 spent on fees and slippage. |
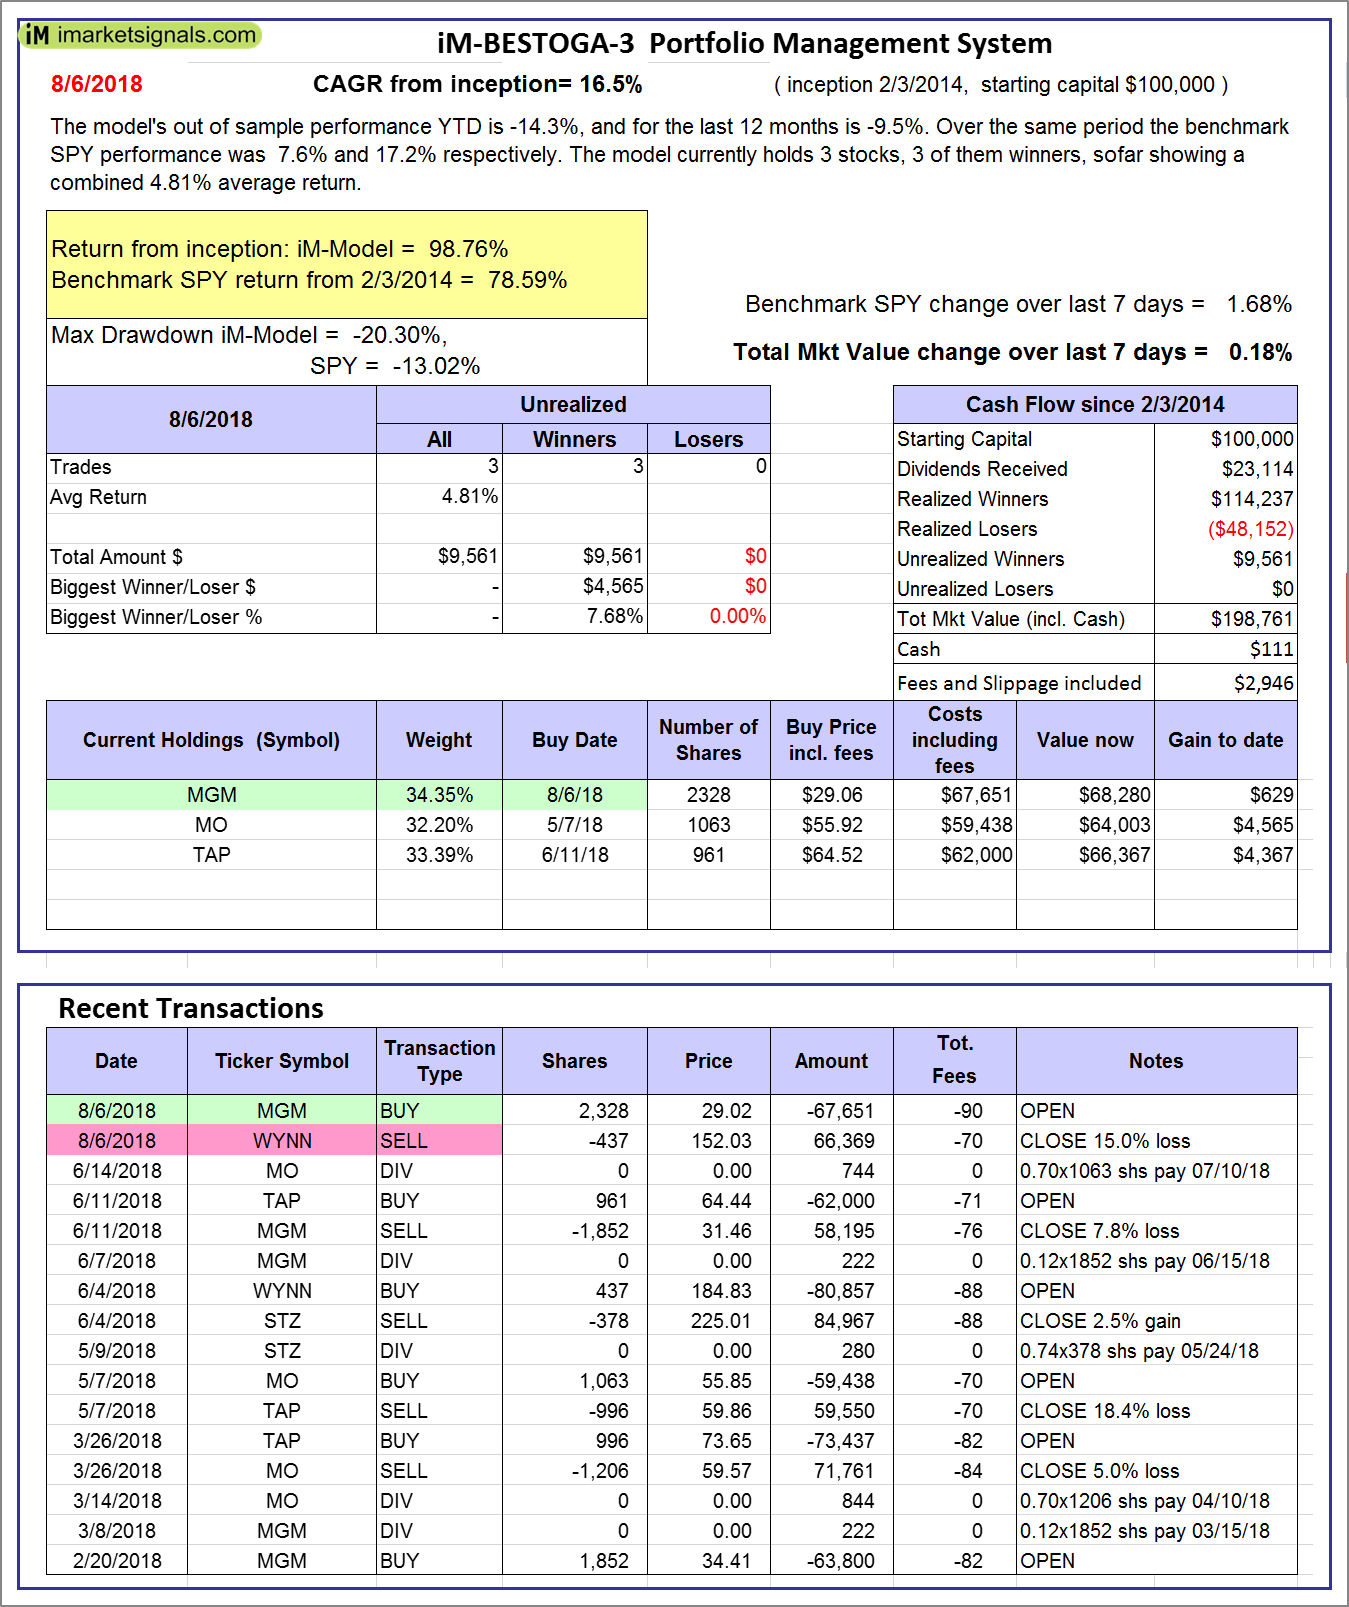 |
iM-BESTOGA-3: The model’s out of sample performance YTD is -14.3%, and for the last 12 months is -9.5%. Over the same period the benchmark SPY performance was 7.6% and 17.2% respectively. Over the previous week the market value of iM-BESTOGA-3 gained 0.18% at a time when SPY gained 1.68%. A starting capital of $100,000 at inception on 2/3/2014 would have grown to $198,761 which includes $111 cash and excludes $2,946 spent on fees and slippage. |
 |
iM-Best7(HiD-LoV): The model’s out of sample performance YTD is 5.0%, and for the last 12 months is 6.2%. Over the same period the benchmark SPY performance was 7.6% and 17.2% respectively. Over the previous week the market value of iM-BESTOGA-3 gained 2.99% at a time when SPY gained 1.68%. A starting capital of $100,000 at inception on 6/30/2016 would have grown to $118,886 which includes $1,106 cash and excludes $2,050 spent on fees and slippage. |
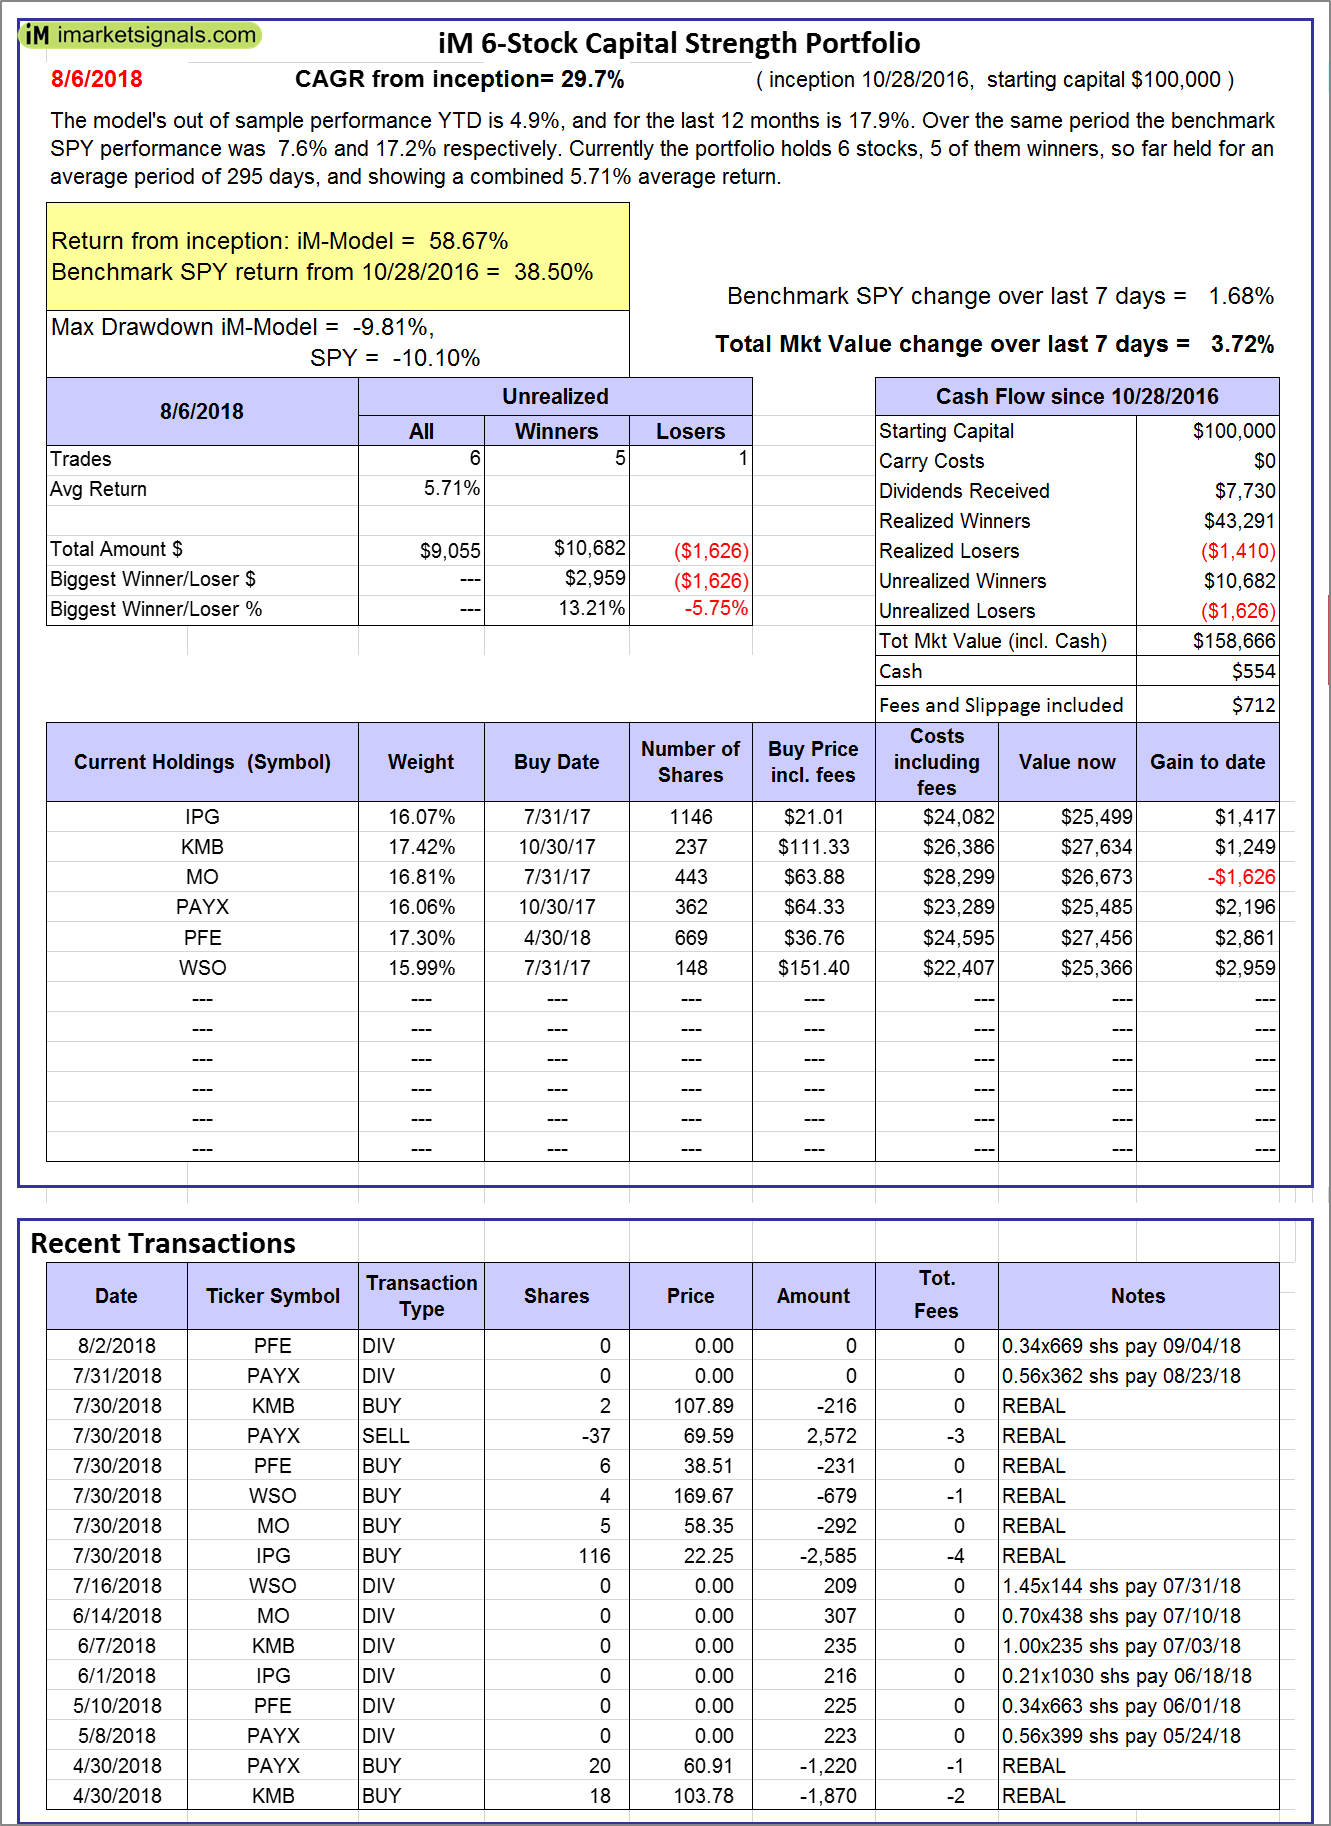 |
iM 6-Stock Capital Strength Portfolio: The model’s out of sample performance YTD is 4.9%, and for the last 12 months is 17.9%. Over the same period the benchmark SPY performance was 7.6% and 17.2% respectively. Over the previous week the market value of the iM 6-Stock Capital Strength Portfolio gained 3.72% at a time when SPY gained 1.68%. A starting capital of $100,000 at inception on 10/28/2016 would have grown to $158,666 which includes $554 cash and excludes $712 spent on fees and slippage. |
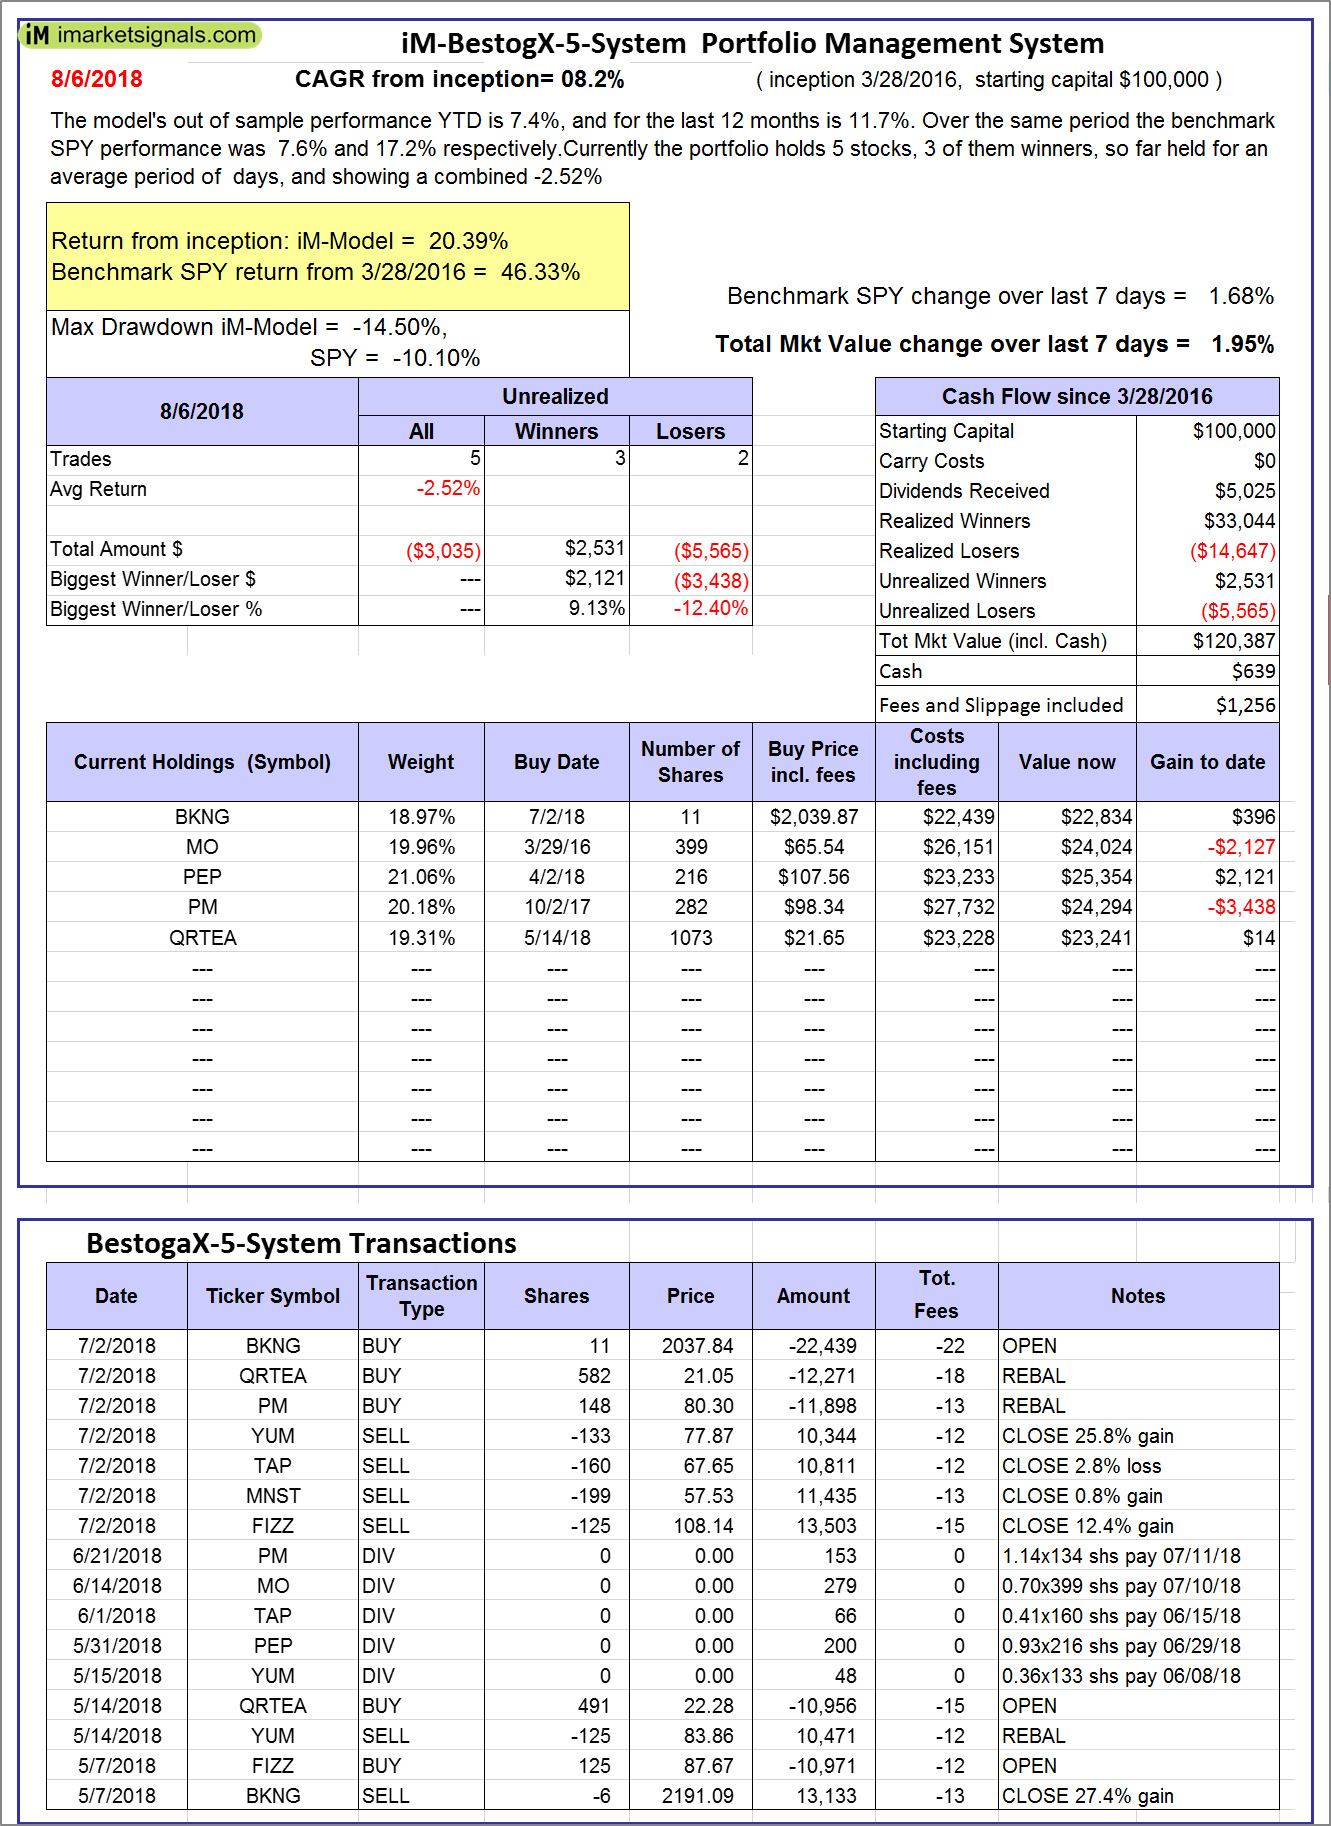 |
iM-BestogaX5-System: The model’s out of sample performance YTD is 7.4%, and for the last 12 months is 11.7%. Over the same period the benchmark SPY performance was 7.6% and 17.2% respectively. Over the previous week the market value of iM-BestogaX5-System gained 1.95% at a time when SPY gained 1.68%. A starting capital of $100,000 at inception on 3/28/2016 would have grown to $120,387 which includes $639 cash and excludes $1,256 spent on fees and slippage. |
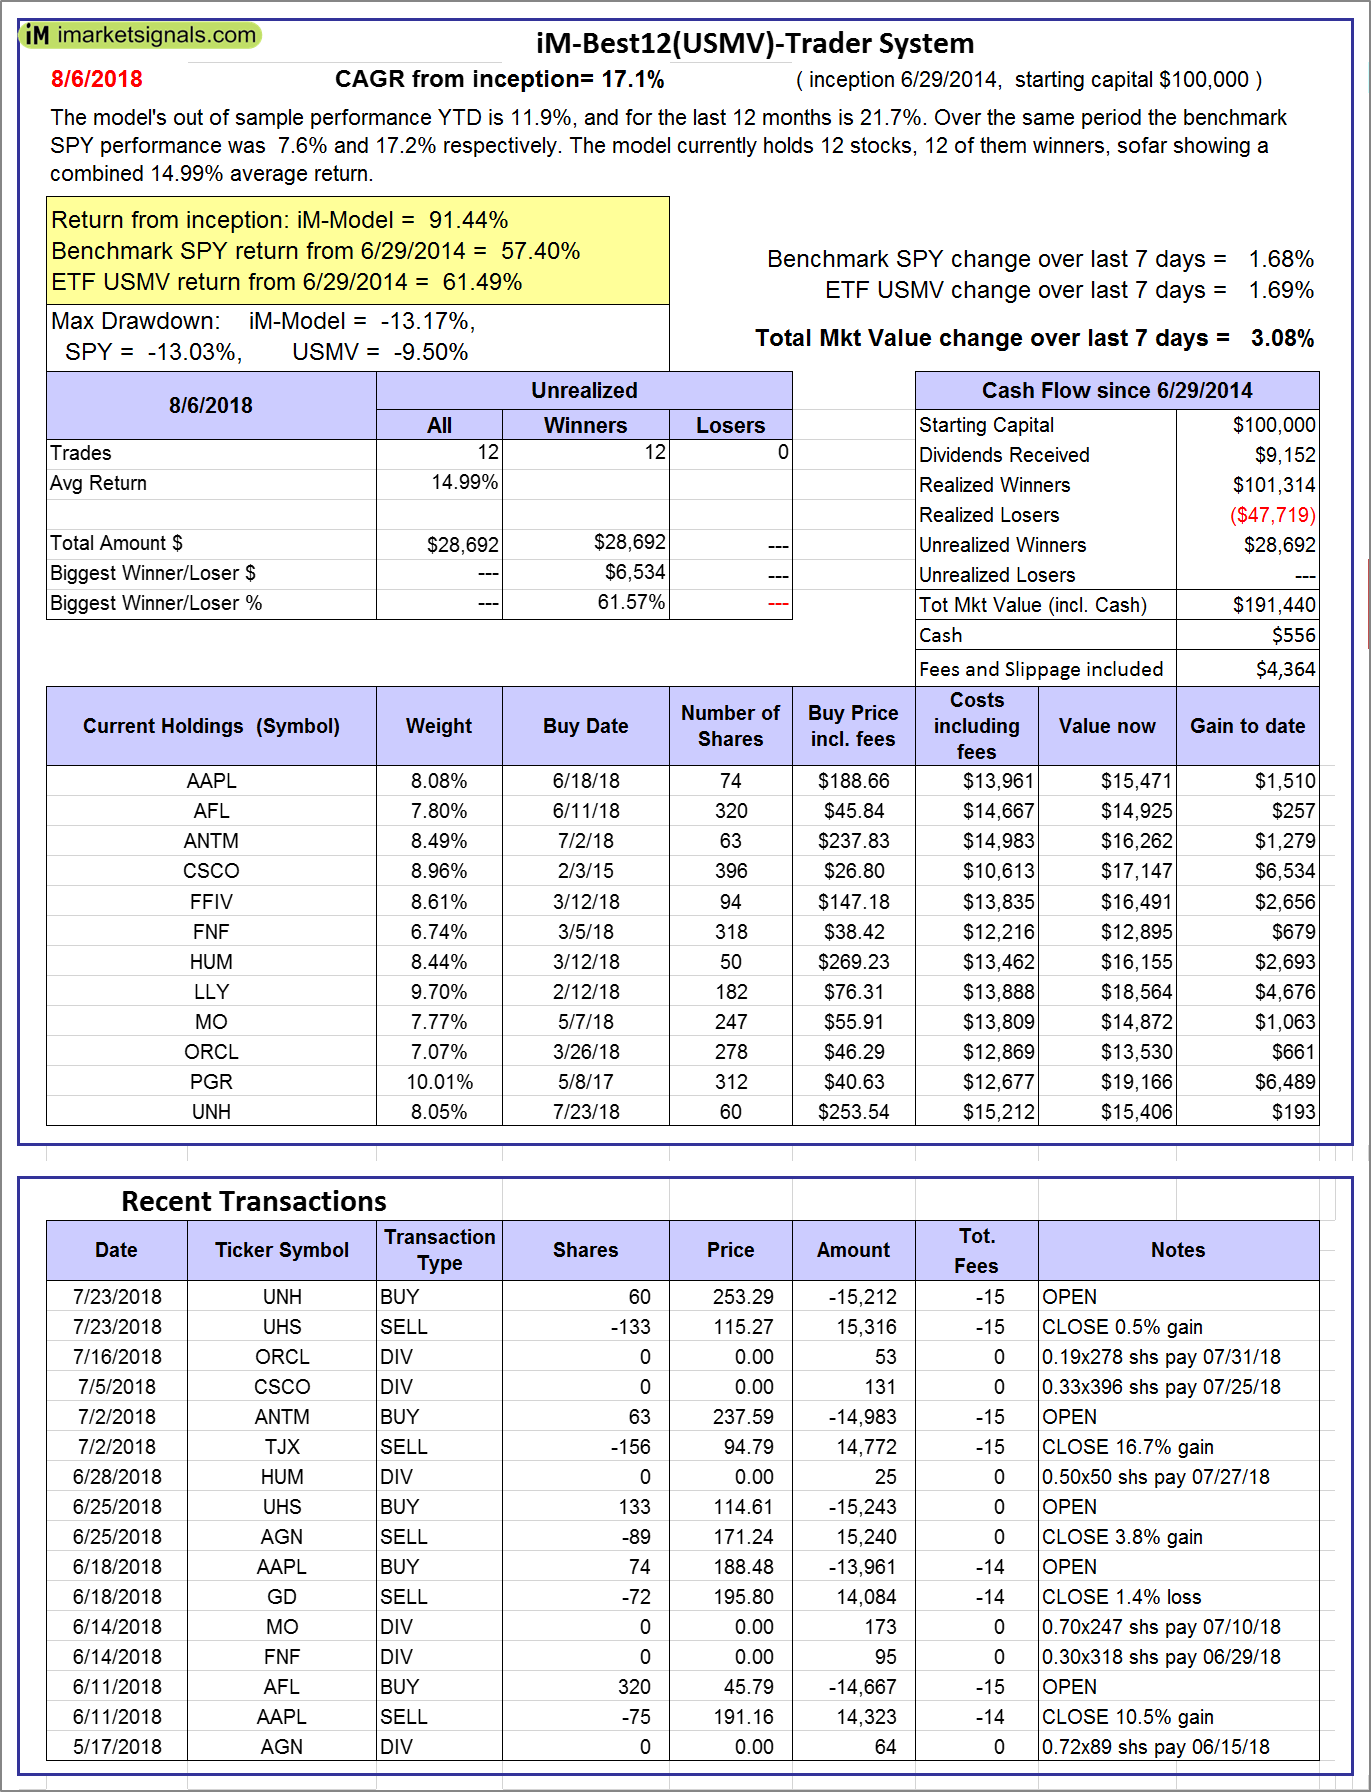 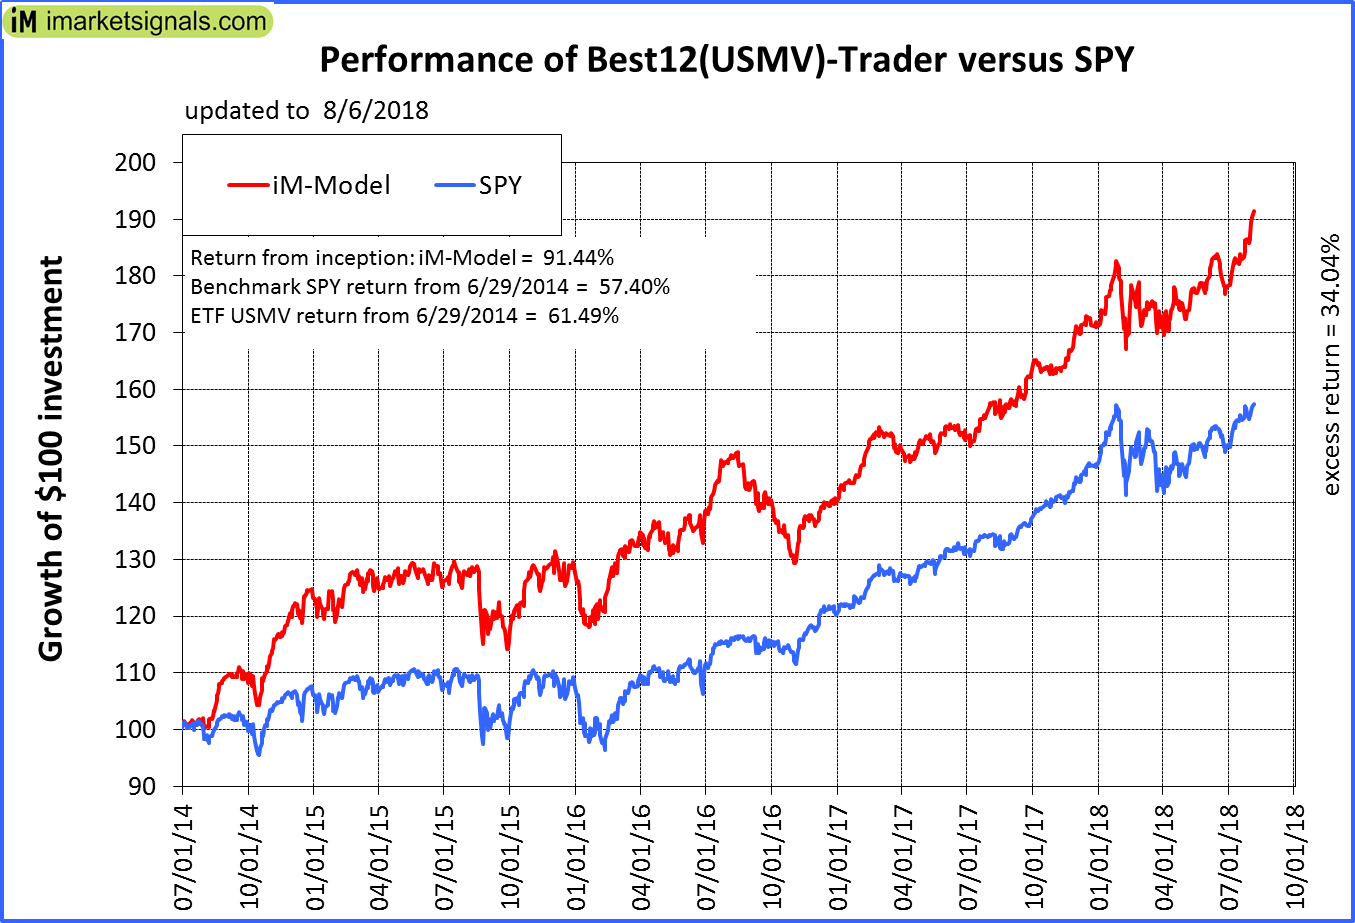 |
iM-Best12(USMV)-Trader: The model’s out of sample performance YTD is 11.9%, and for the last 12 months is 21.7%. Over the same period the benchmark SPY performance was 7.6% and 17.2% respectively. Since inception, on 6/30/2014, the model gained 91.44% while the benchmark SPY gained 57.40% and the ETF USMV gained 61.49% over the same period. Over the previous week the market value of iM-Best12(USMV)-Trader gained 3.08% at a time when SPY gained 1.68%. A starting capital of $100,000 at inception on 6/30/2014 would have grown to $191,440 which includes $556 cash and excludes $4,364 spent on fees and slippage. |
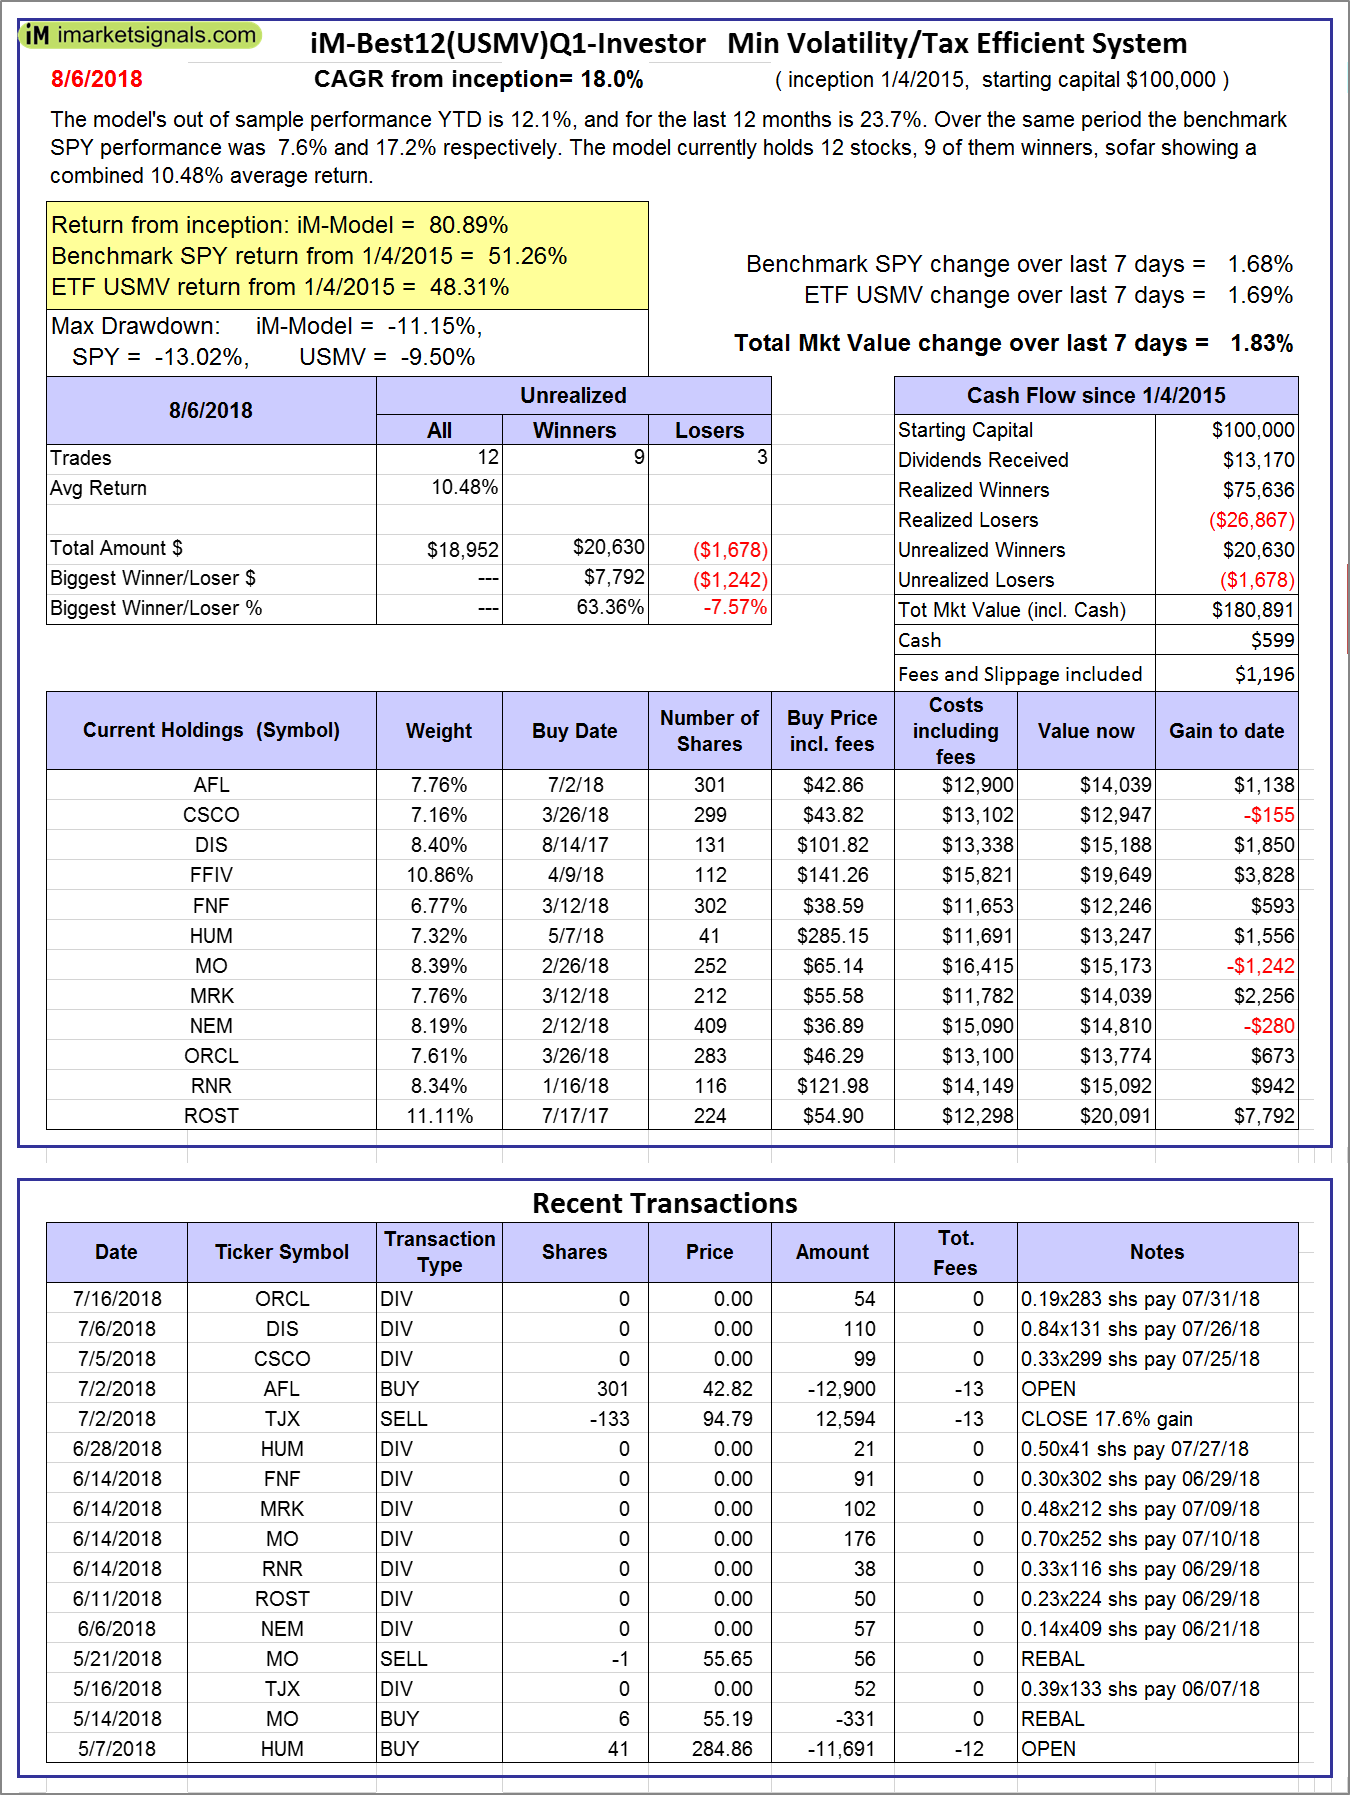 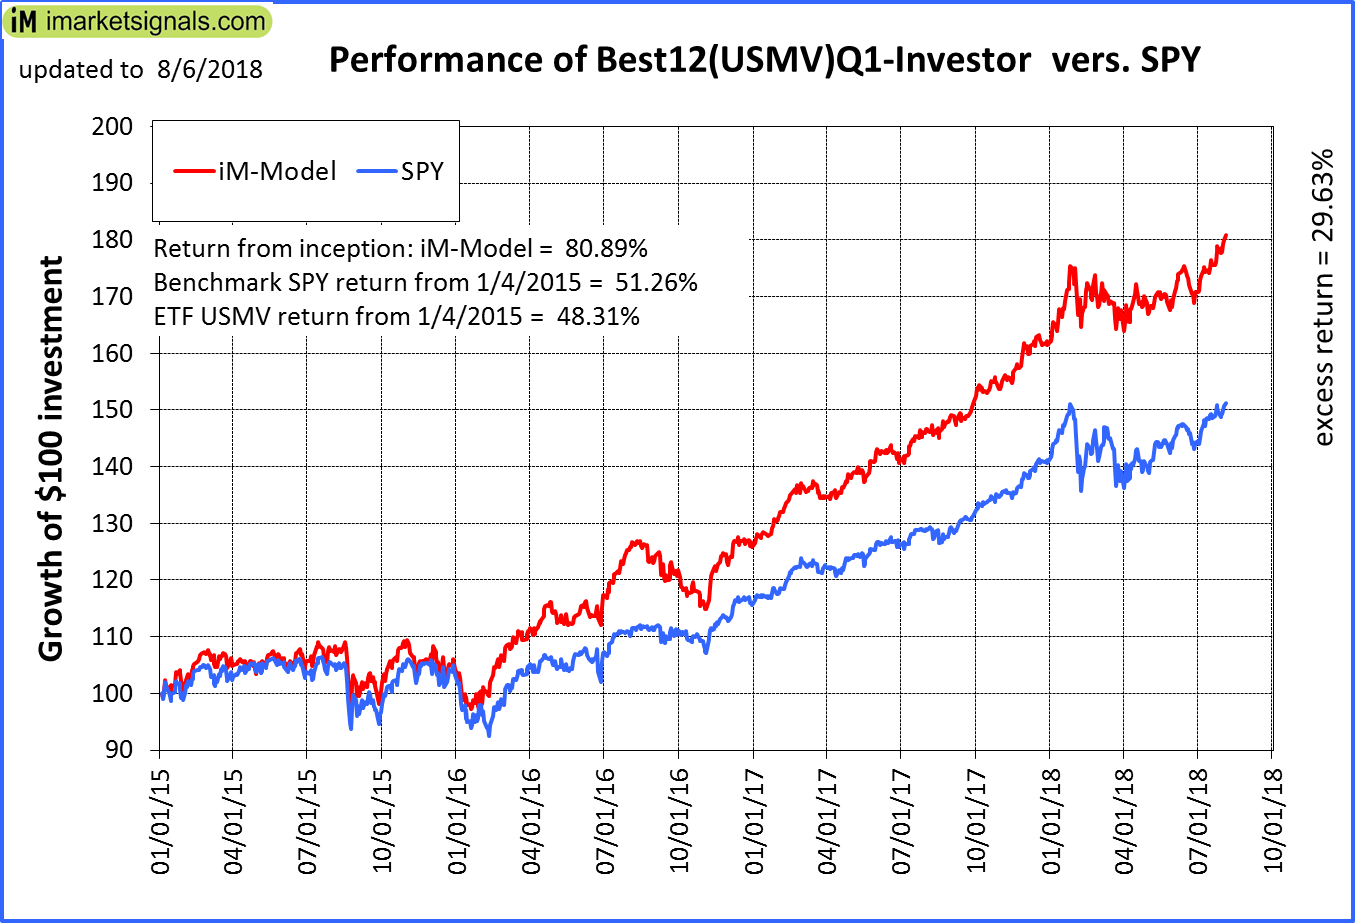 |
iM-Best12(USMV)Q1-Investor: The model’s out of sample performance YTD is 12.1%, and for the last 12 months is 23.7%. Over the same period the benchmark SPY performance was 7.6% and 17.2% respectively. Since inception, on 1/5/2015, the model gained 80.89% while the benchmark SPY gained 51.26% and the ETF USMV gained 48.31% over the same period. Over the previous week the market value of iM-Best12(USMV)Q1 gained 1.83% at a time when SPY gained 1.68%. A starting capital of $100,000 at inception on 1/5/2015 would have grown to $180,891 which includes $599 cash and excludes $1,196 spent on fees and slippage. |
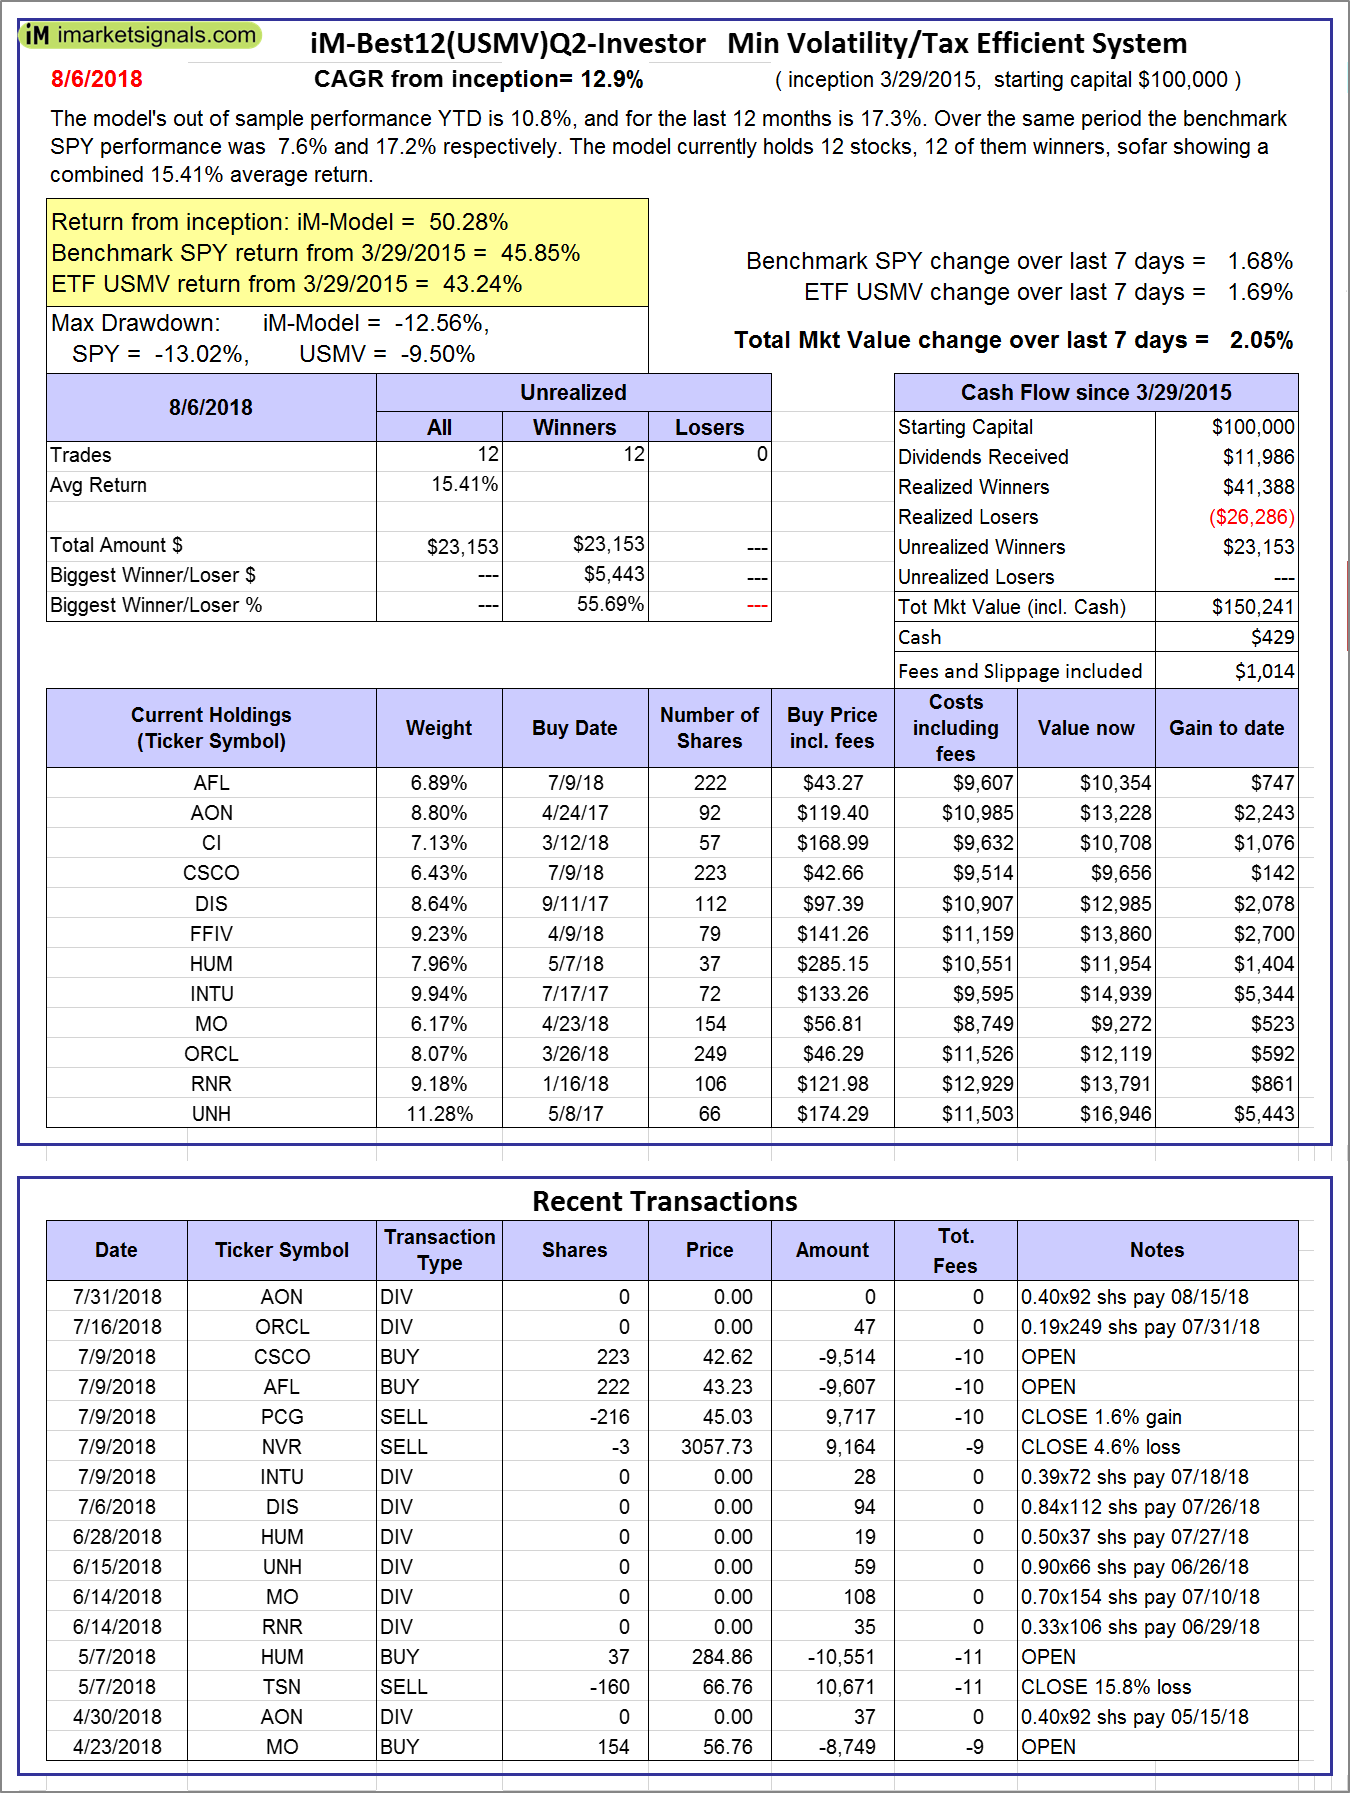 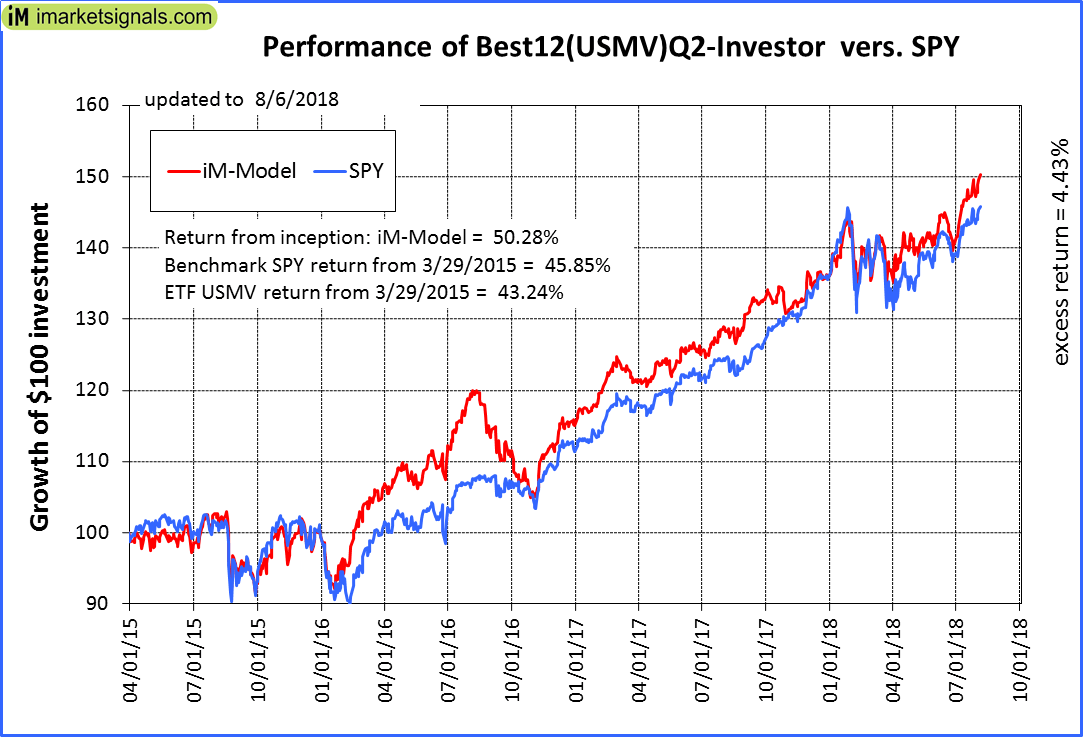 |
iM-Best12(USMV)Q2-Investor: The model’s out of sample performance YTD is 10.8%, and for the last 12 months is 17.3%. Over the same period the benchmark SPY performance was 7.6% and 17.2% respectively. Since inception, on 3/30/2015, the model gained 50.28% while the benchmark SPY gained 45.85% and the ETF USMV gained 43.24% over the same period. Over the previous week the market value of iM-Best12(USMV)Q2 gained 2.05% at a time when SPY gained 1.68%. A starting capital of $100,000 at inception on 3/30/2015 would have grown to $150,241 which includes $429 cash and excludes $1,014 spent on fees and slippage. |
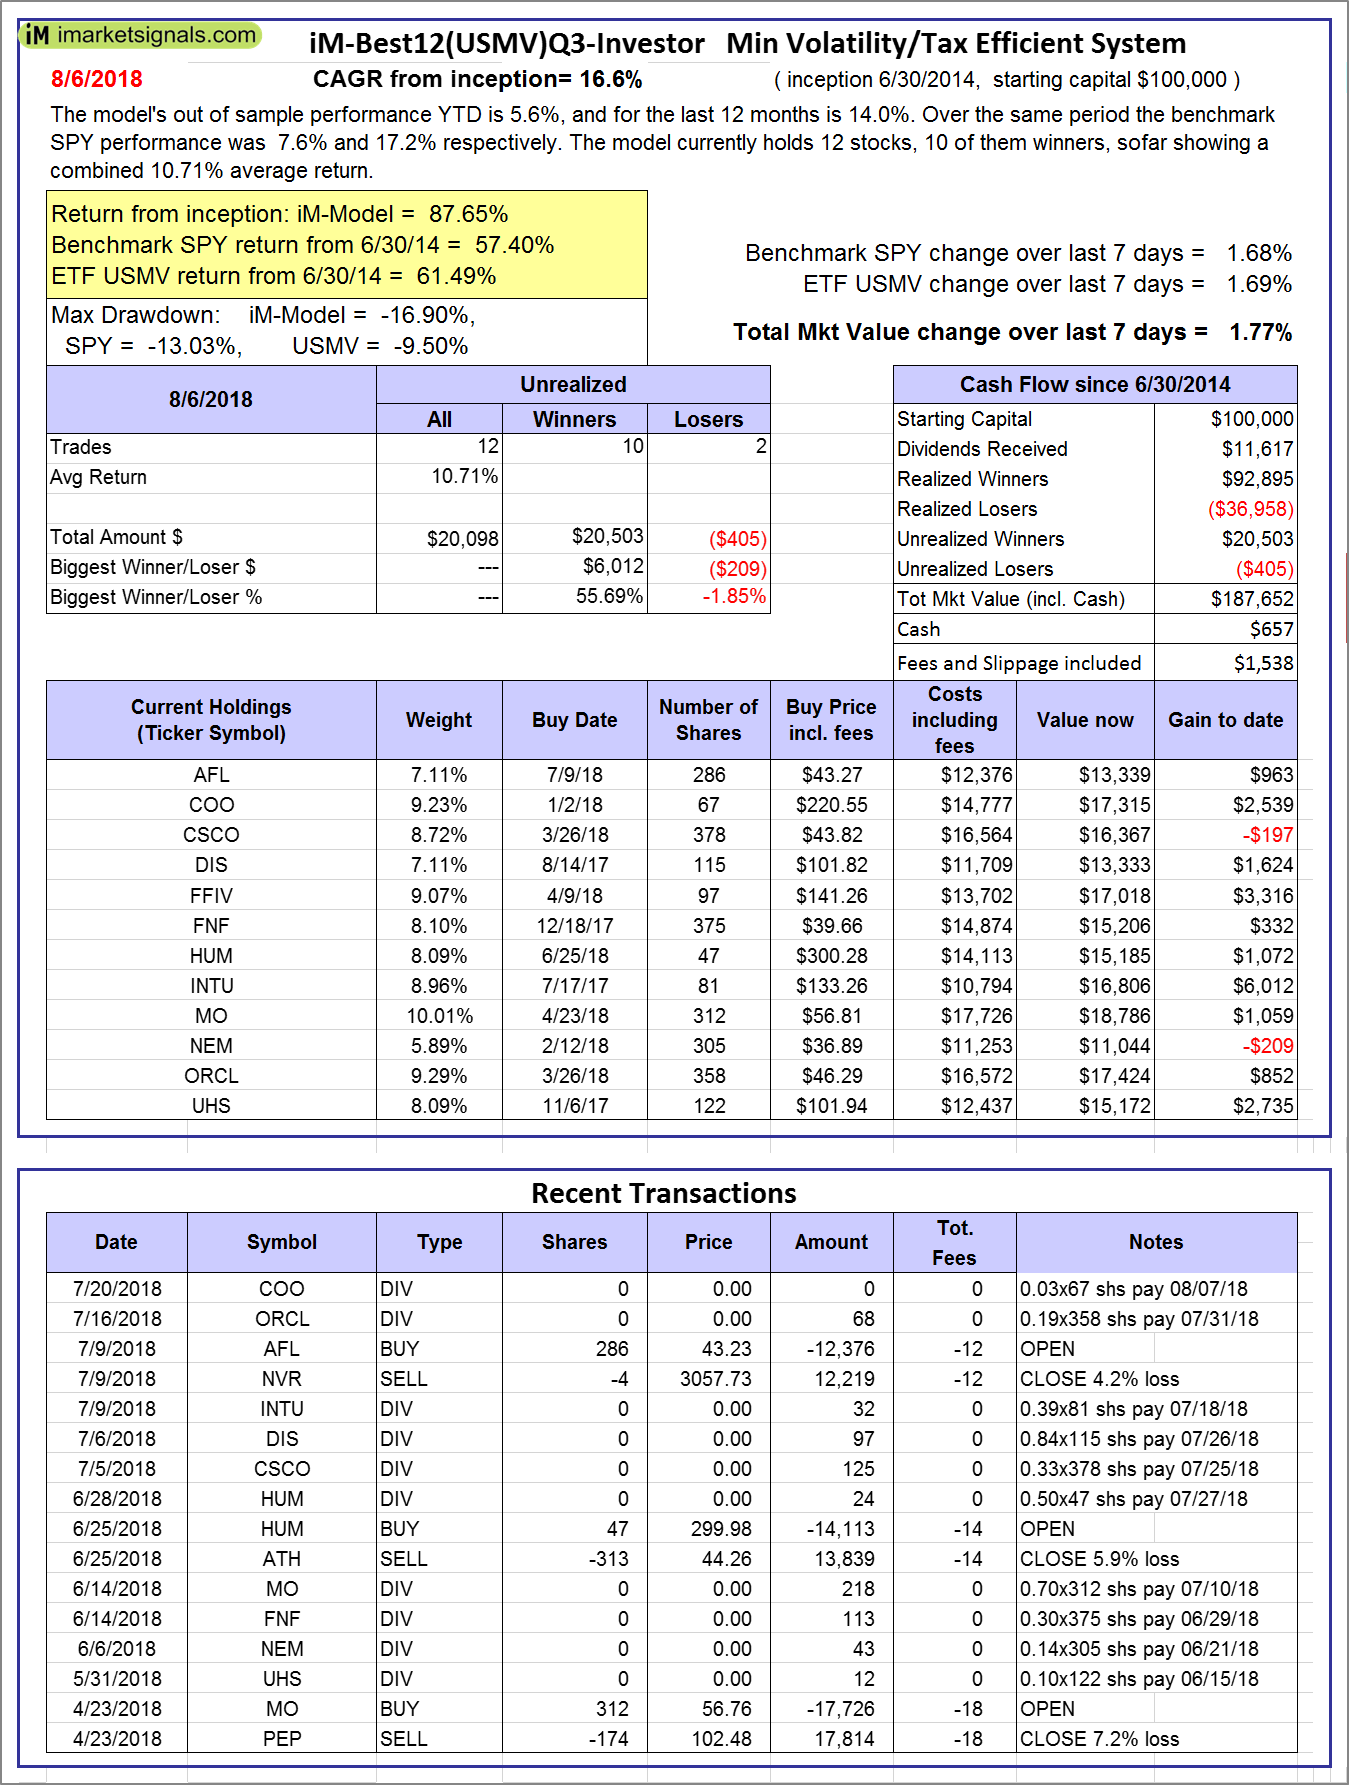 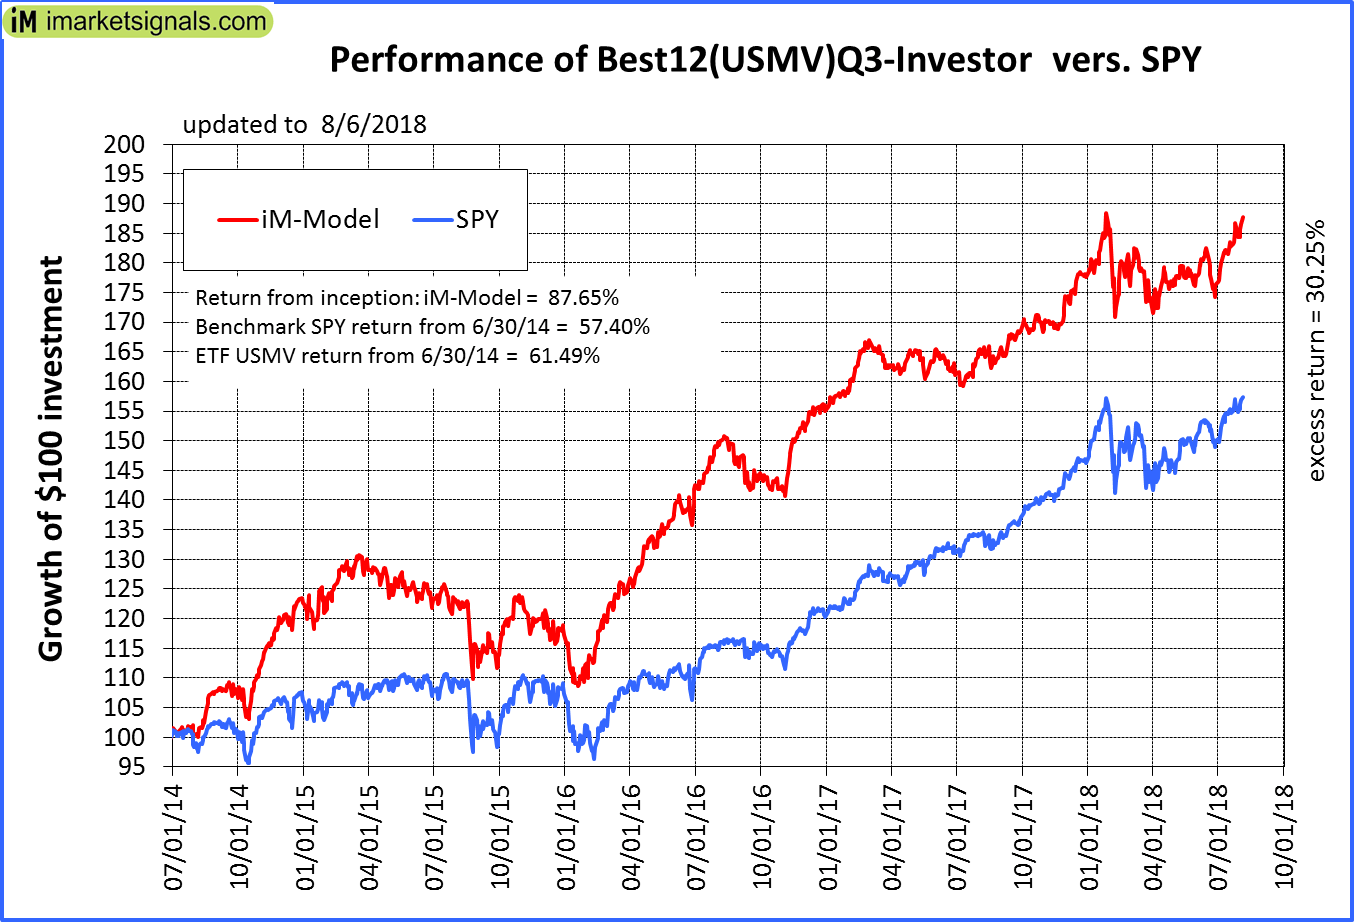 |
iM-Best12(USMV)Q3-Investor: The model’s out of sample performance YTD is 5.6%, and for the last 12 months is 14.0%. Over the same period the benchmark SPY performance was 7.6% and 17.2% respectively. Since inception, on 7/1/2014, the model gained 87.65% while the benchmark SPY gained 57.40% and the ETF USMV gained 61.49% over the same period. Over the previous week the market value of iM-Best12(USMV)Q3 gained 1.77% at a time when SPY gained 1.68%. A starting capital of $100,000 at inception on 7/1/2014 would have grown to $187,652 which includes $657 cash and excludes $1,538 spent on fees and slippage. |
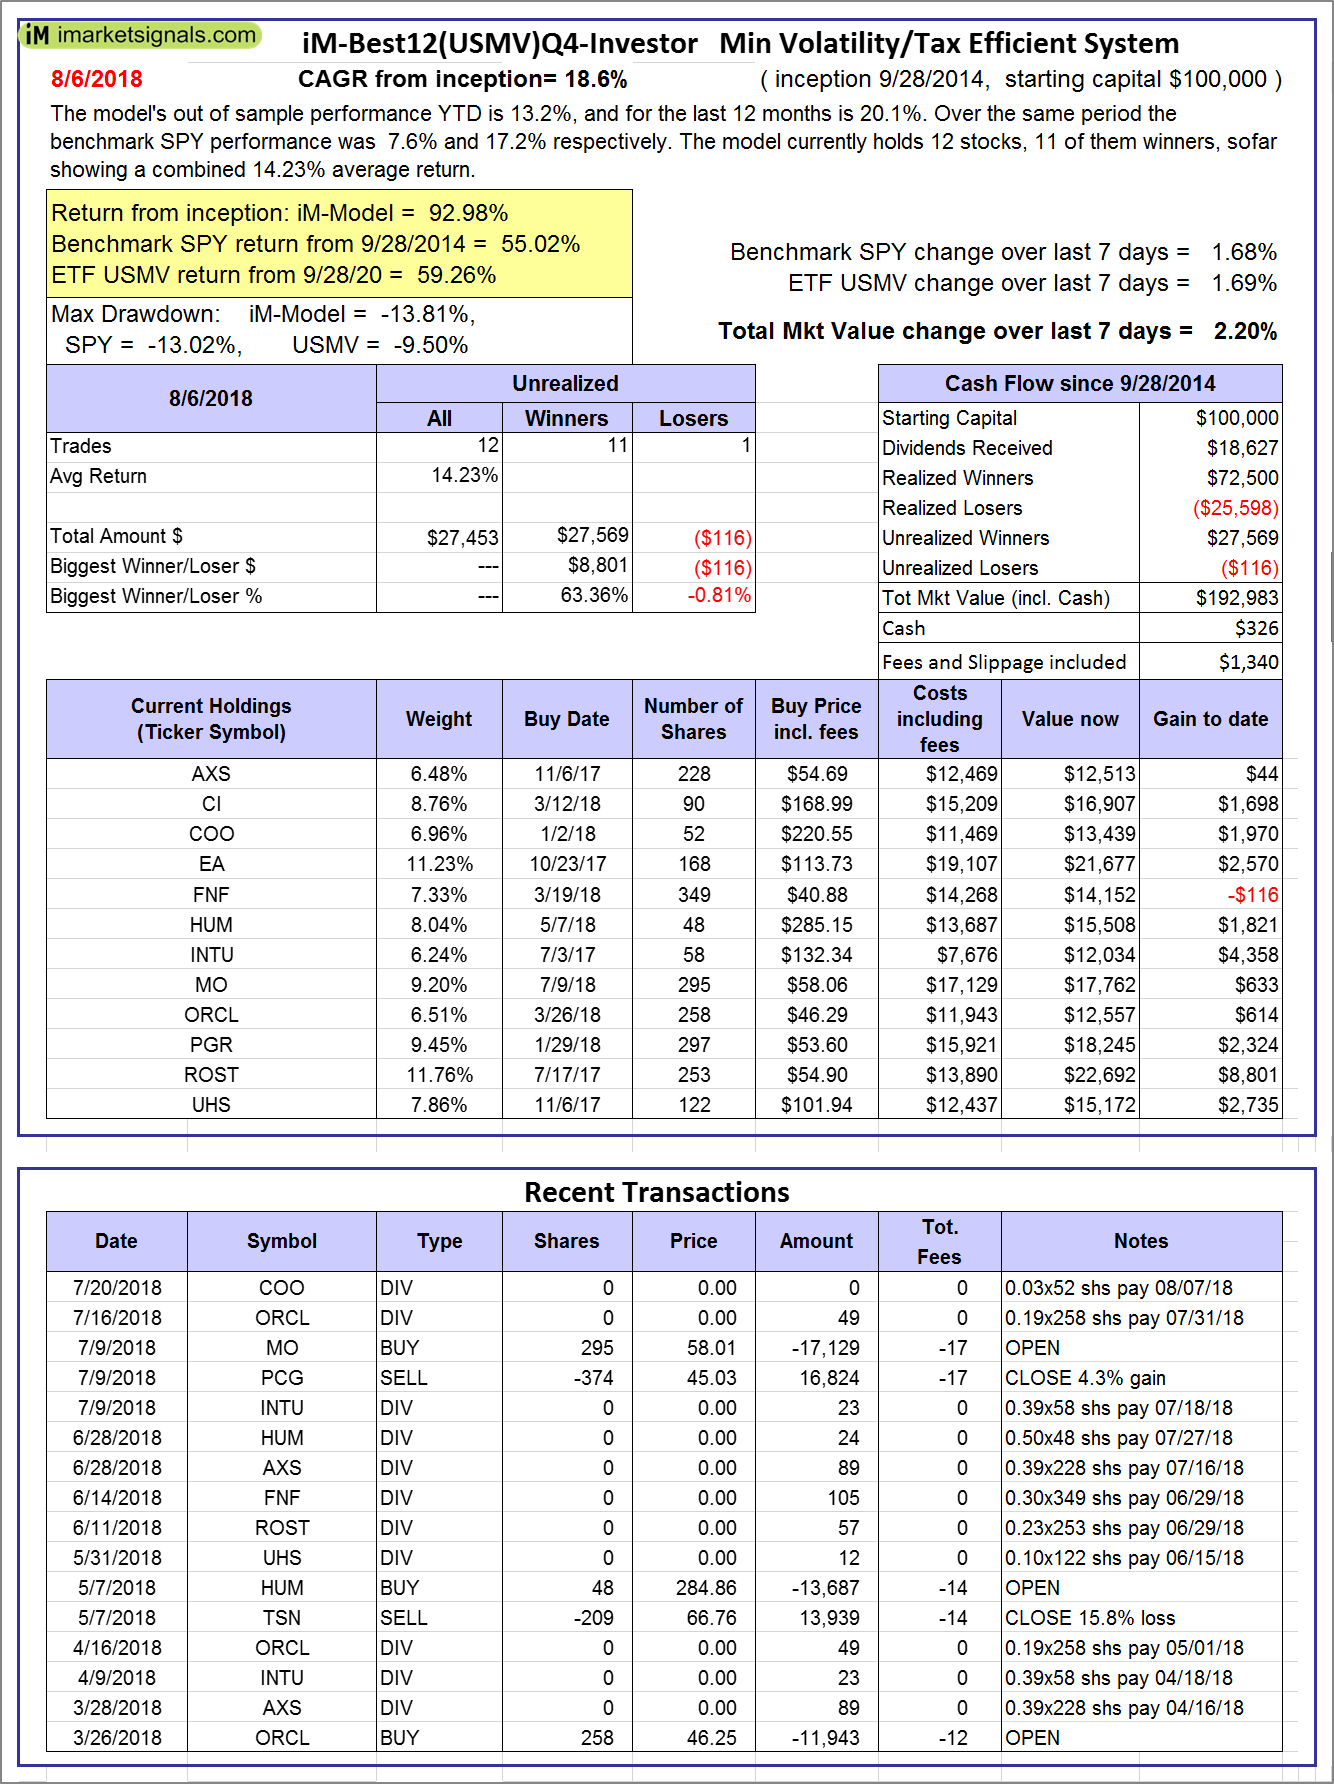  |
iM-Best12(USMV)Q4-Investor: Since inception, on 9/29/2014, the model gained 92.98% while the benchmark SPY gained 55.02% and the ETF USMV gained 59.26% over the same period. Over the previous week the market value of iM-Best12(USMV)Q4 gained 2.20% at a time when SPY gained 1.68%. A starting capital of $100,000 at inception on 9/29/2014 would have grown to $192,983 which includes $326 cash and excludes $1,340 spent on fees and slippage. |
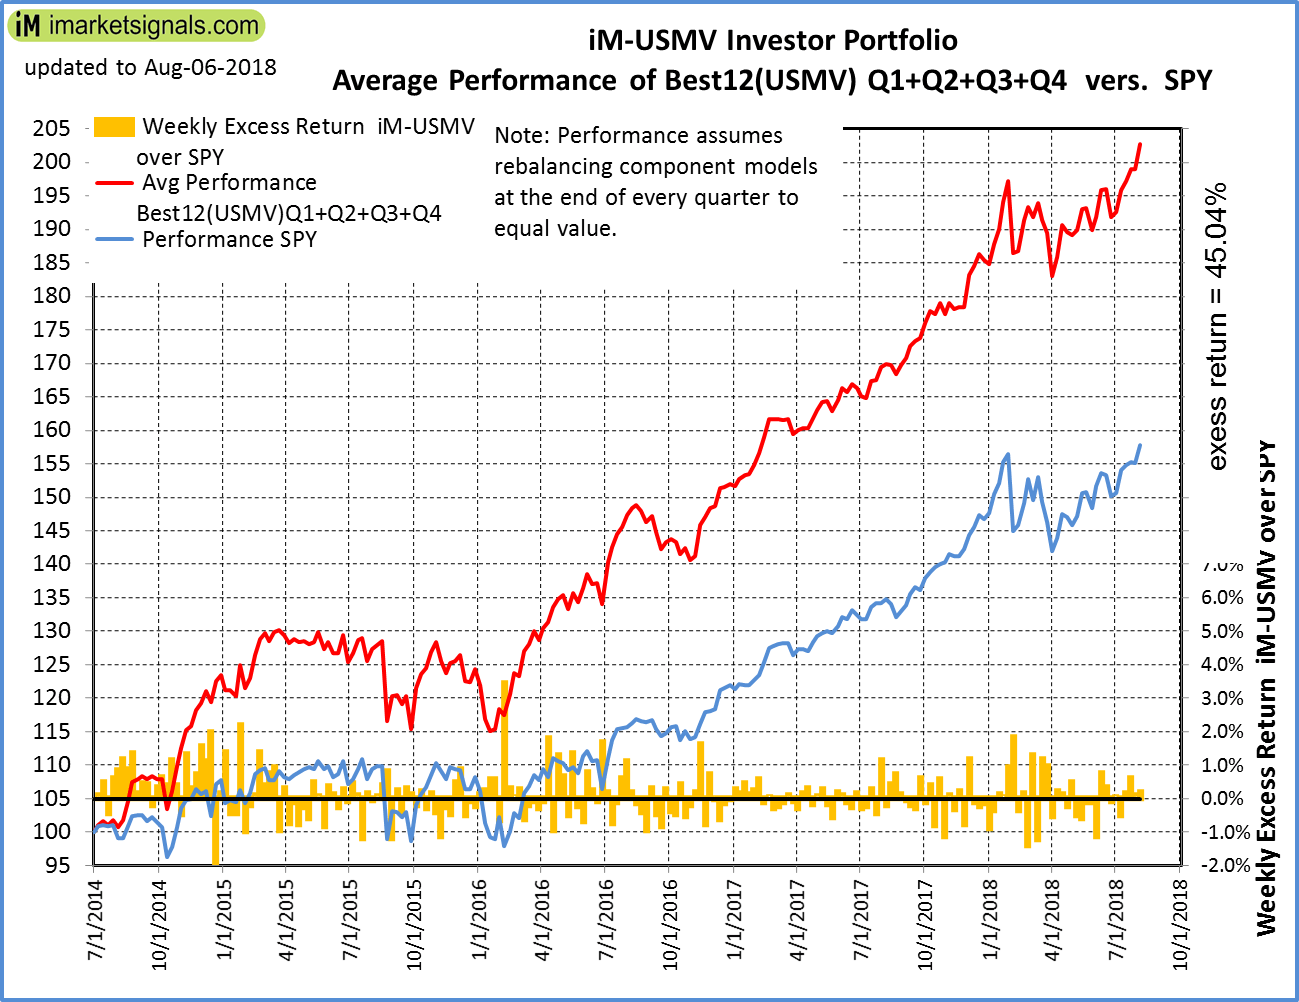 |
Average Performance of iM-Best12(USMV)Q1+Q2+Q3+Q4-Investor resulted in an excess return of 45.04% over SPY. (see iM-USMV Investor Portfolio) |
 |
iM-Best(Short): The model’s out of sample performance YTD is -2.0%, and for the last 12 months is -11.1%. Over the same period the benchmark SPY performance was 7.6% and 17.2% respectively. Over the previous week the market value of iM-Best(Short) gained 0.00% at a time when SPY gained 1.68%. Over the period 1/2/2009 to 8/6/2018 the starting capital of $100,000 would have grown to $39,815 which includes $39,815 cash and excludes $24,436 spent on fees and slippage. |
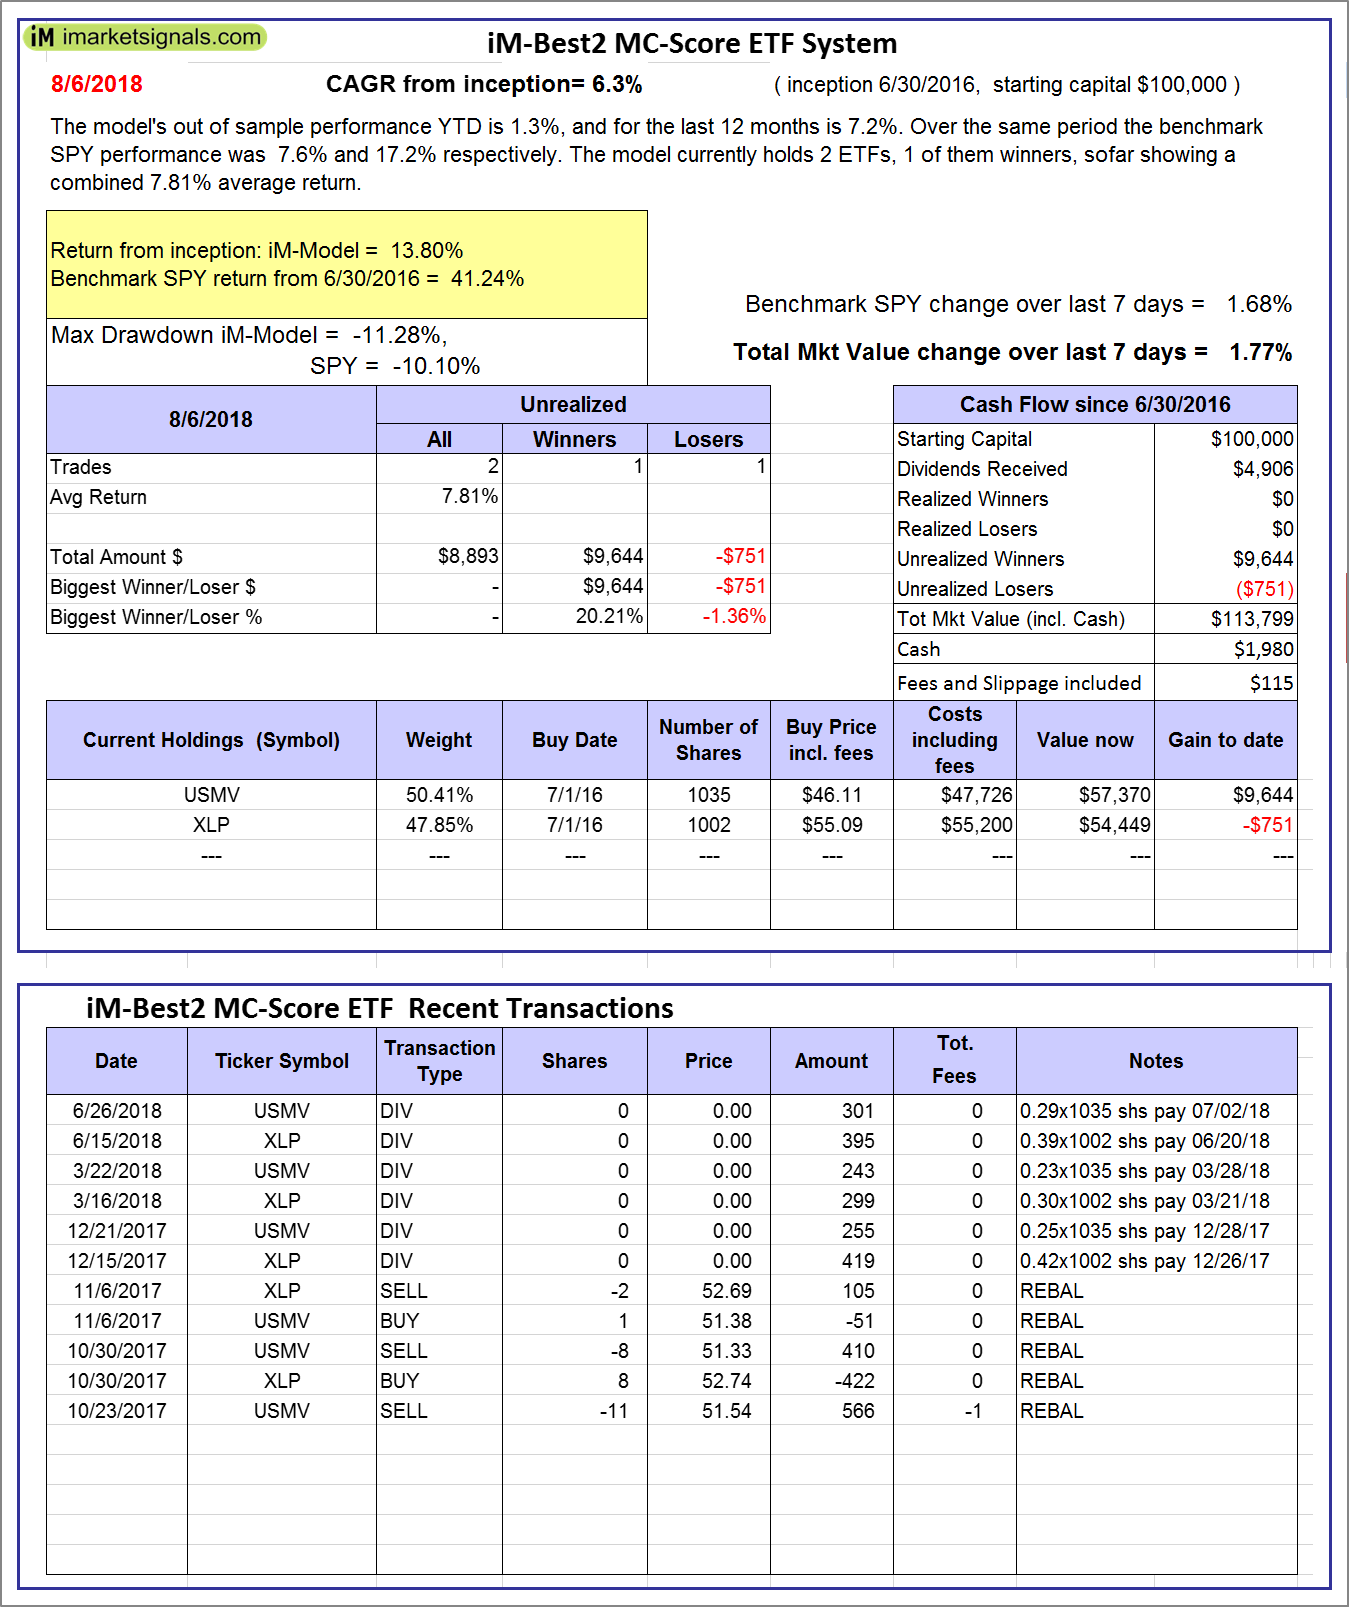 |
iM-Best2 MC-Score ETF System: The model’s out of sample performance YTD is 1.3%, and for the last 12 months is 7.2%. Over the same period the benchmark SPY performance was 7.6% and 17.2% respectively. Over the previous week the market value of the iM-Best2 MC-Score ETF System gained 1.77% at a time when SPY gained 1.68%. A starting capital of $100,000 at inception on 6/30/2016 would have grown to $113,799 which includes $1,980 cash and excludes $115 spent on fees and slippage. |
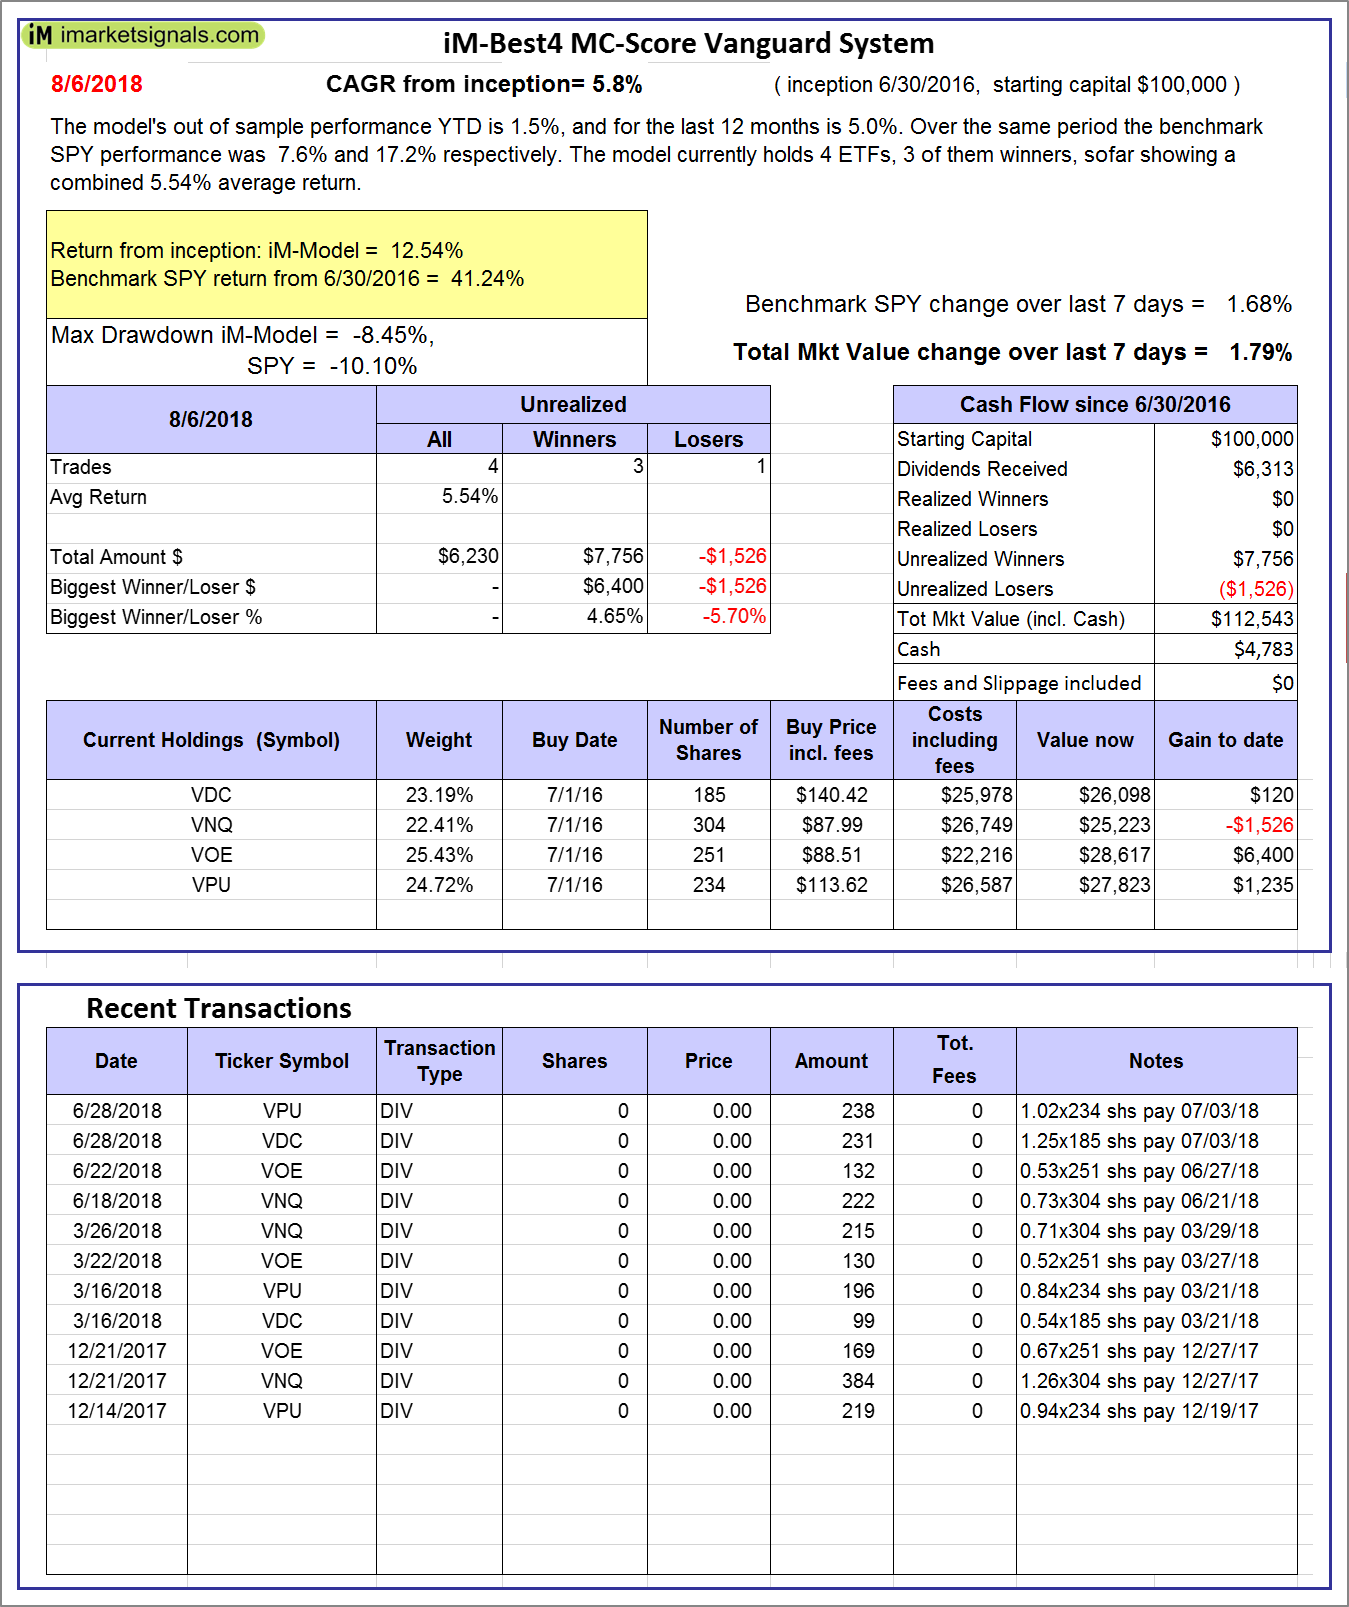 |
iM-Best4 MC-Score Vanguard System: The model’s out of sample performance YTD is 1.5%, and for the last 12 months is 5.0%. Over the same period the benchmark SPY performance was 7.6% and 17.2% respectively. Over the previous week the market value of the iM-Best4 MC-Score Vanguard System gained 1.79% at a time when SPY gained 1.68%. A starting capital of $100,000 at inception on 6/30/2016 would have grown to $112,543 which includes $4,783 cash and excludes $00 spent on fees and slippage. |
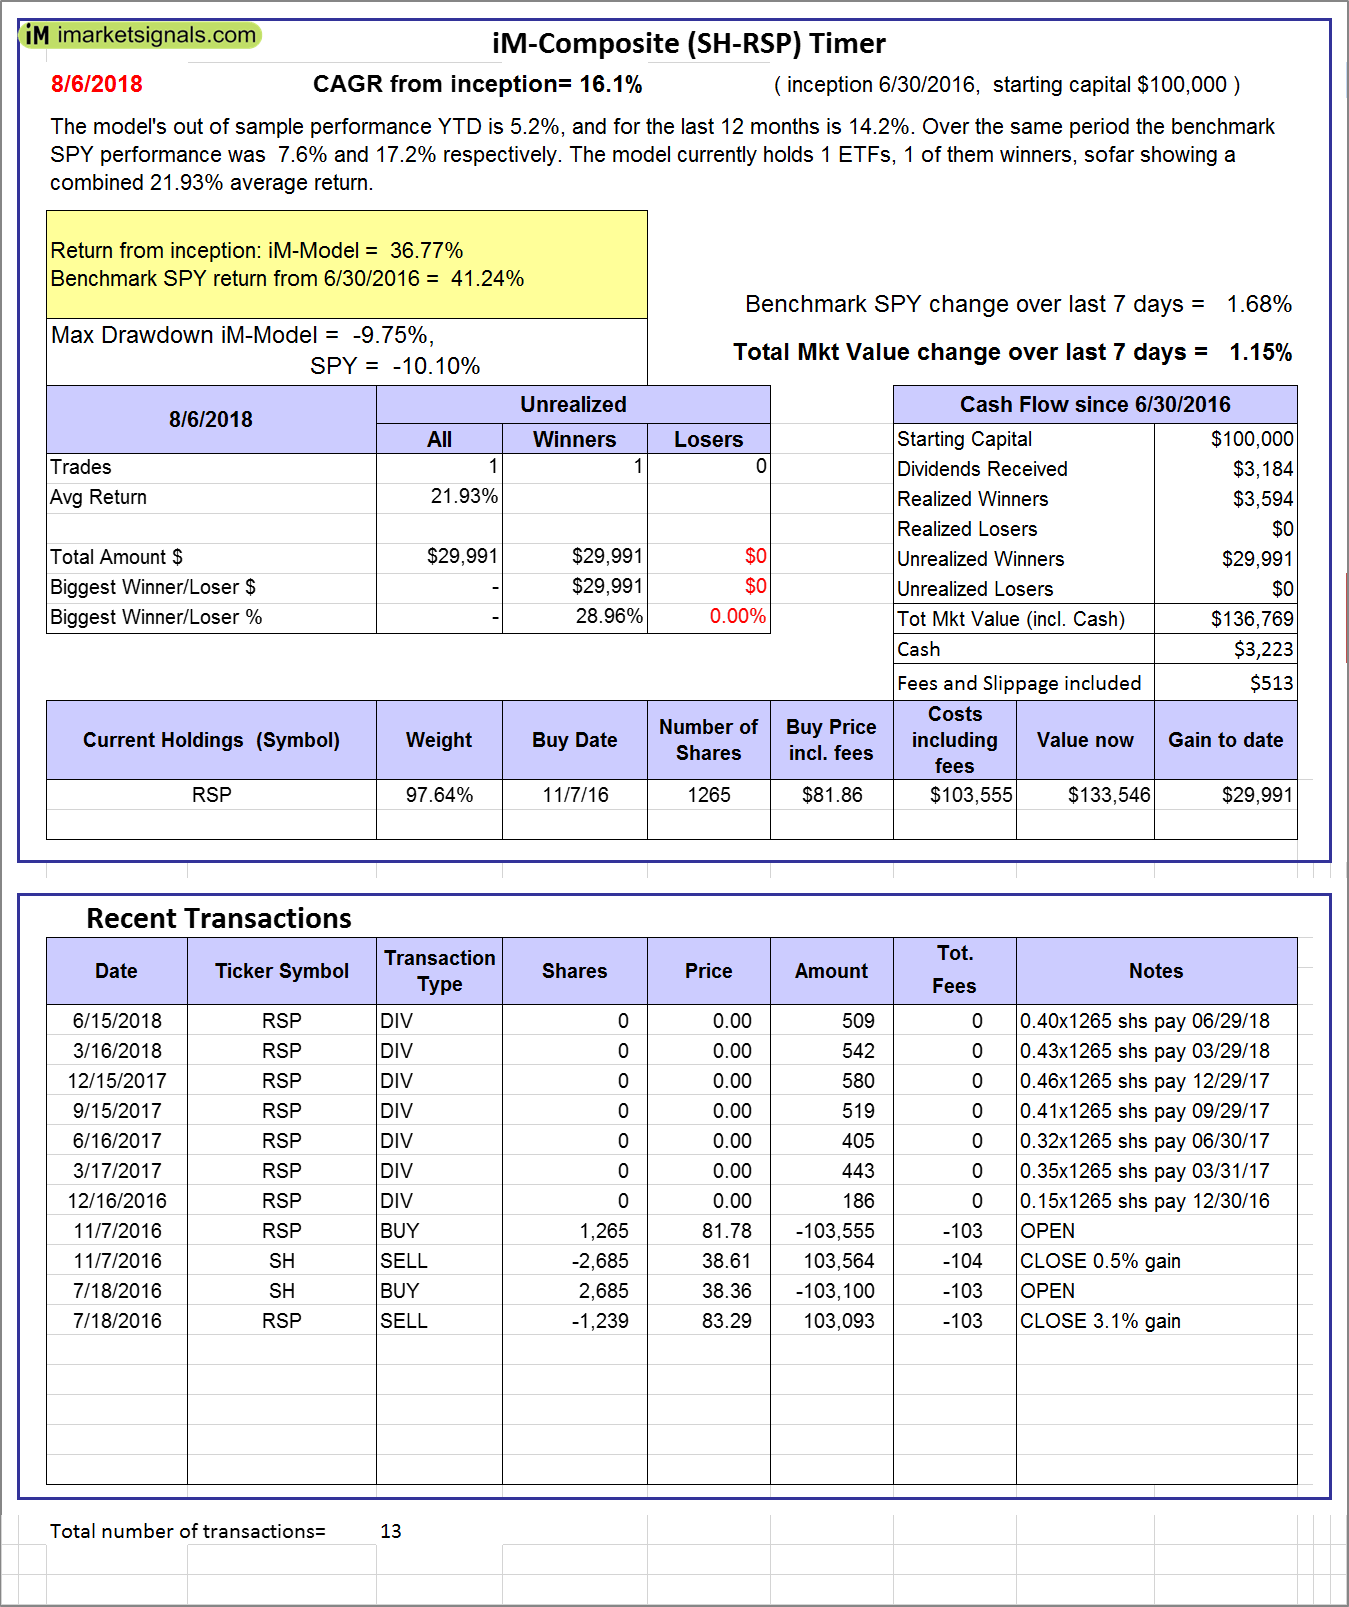 |
iM-Composite (SH-RSP) Timer: The model’s out of sample performance YTD is 5.2%, and for the last 12 months is 14.2%. Over the same period the benchmark SPY performance was 7.6% and 17.2% respectively. Over the previous week the market value of the iM-Composite (SH-RSP) Timer gained 1.15% at a time when SPY gained 1.68%. A starting capital of $100,000 at inception on 6/30/2016 would have grown to $136,769 which includes $3,223 cash and excludes $513 spent on fees and slippage. |
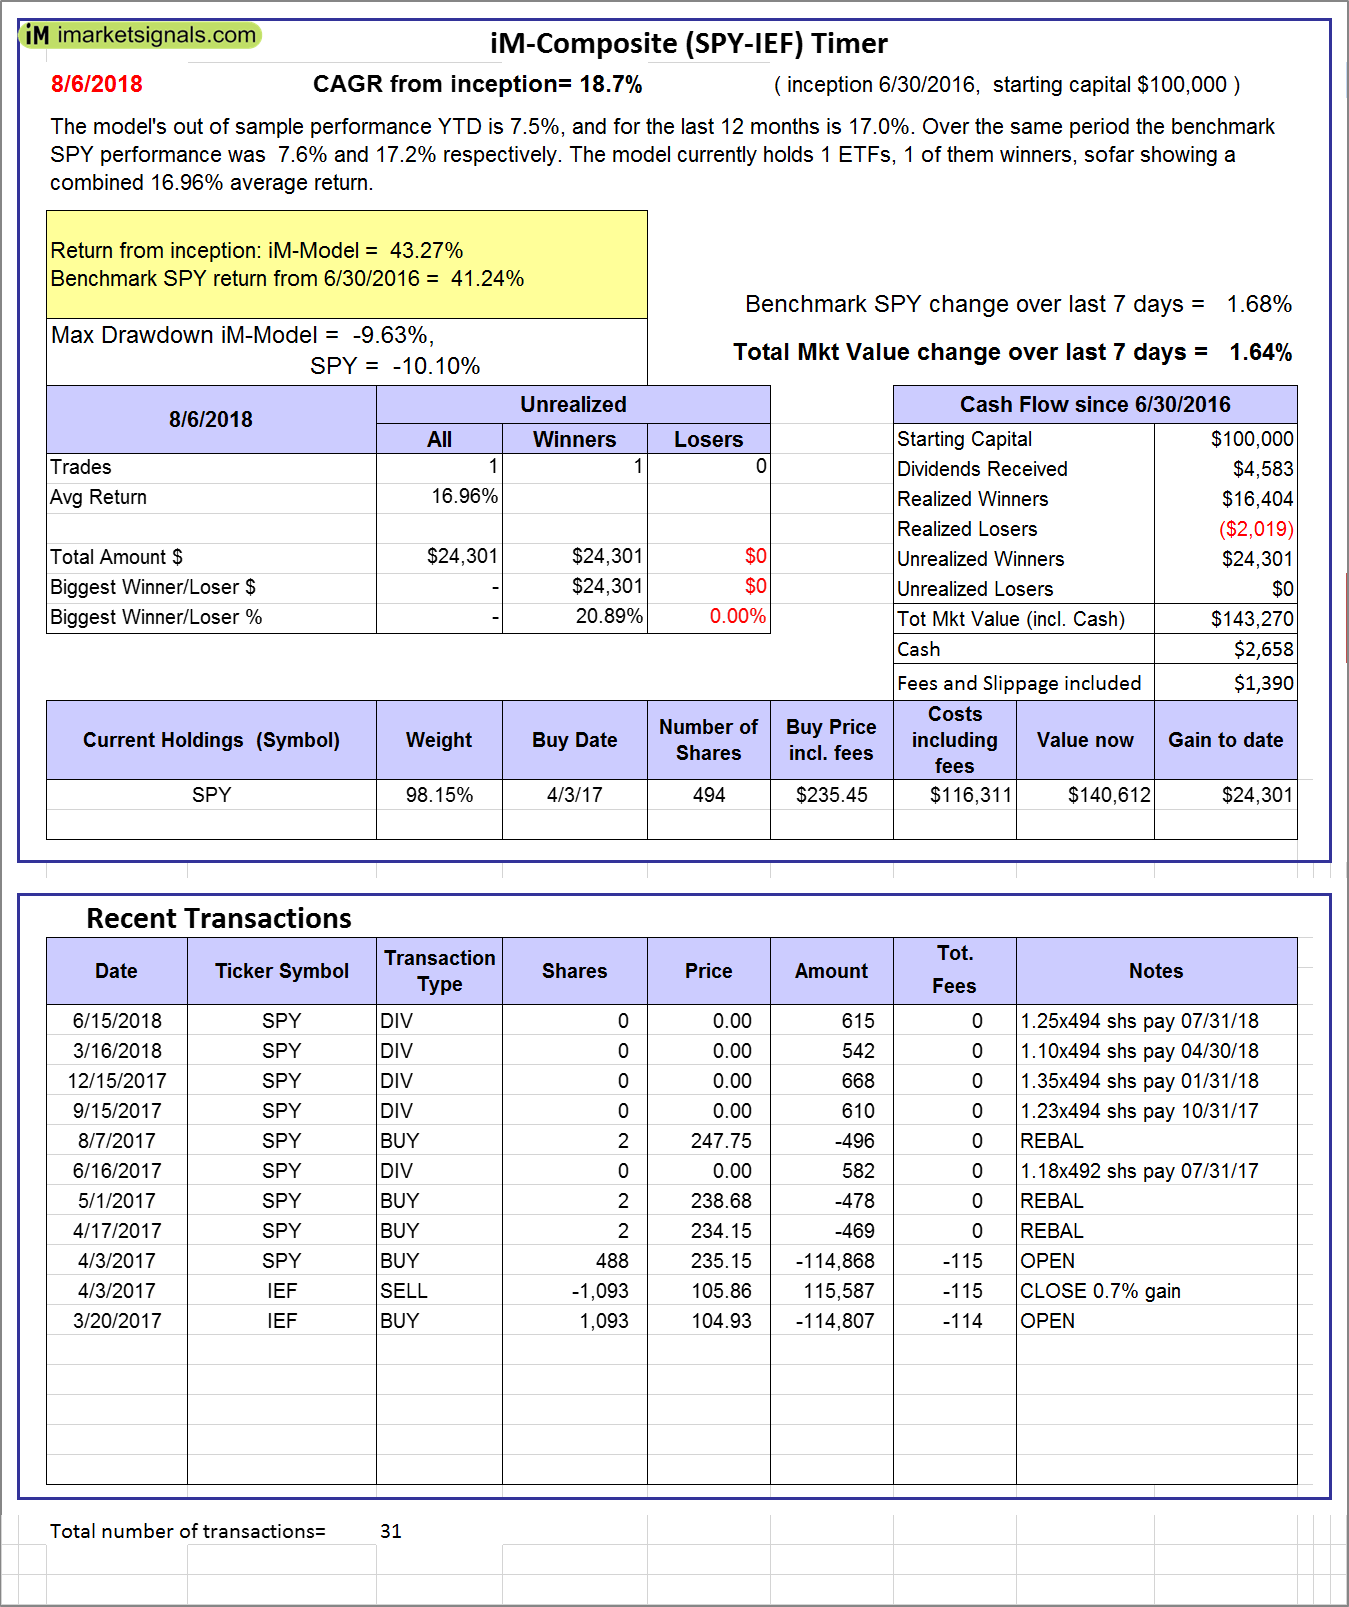 |
iM-Composite (SPY-IEF) Timer: The model’s out of sample performance YTD is 7.5%, and for the last 12 months is 17.0%. Over the same period the benchmark SPY performance was 7.6% and 17.2% respectively. Over the previous week the market value of the iM-Composite (SPY-IEF) Timer gained 1.64% at a time when SPY gained 1.68%. A starting capital of $100,000 at inception on 6/30/2016 would have grown to $143,270 which includes $2,658 cash and excludes $1,390 spent on fees and slippage. |
 |
iM-VIX Timer with ZIV: The model’s out of sample performance YTD is 32.0%, and for the last 12 months is 67.0%. Over the same period the benchmark SPY performance was 7.6% and 17.2% respectively. Over the previous week the market value of the iM-VIX Timer with ZIV gained 6.91% at a time when SPY gained 1.68%. A starting capital of $100,000 at inception on 6/30/2016 would have grown to $232,301 which includes $77 cash and excludes $2,429 spent on fees and slippage. |
 |
iM-Composite(Gold-Stocks-Bond) Timer: The model’s out of sample performance YTD is -7.5%, and for the last 12 months is -4.4%. Over the same period the benchmark SPY performance was 7.6% and 17.2% respectively. Over the previous week the market value of the iM-Composite(Gold-Stocks-Bond) Timer gained -1.17% at a time when SPY gained 1.68%. A starting capital of $100,000 at inception on 6/30/2016 would have grown to $119,084 which includes $100 cash and excludes $1,955 spent on fees and slippage. |
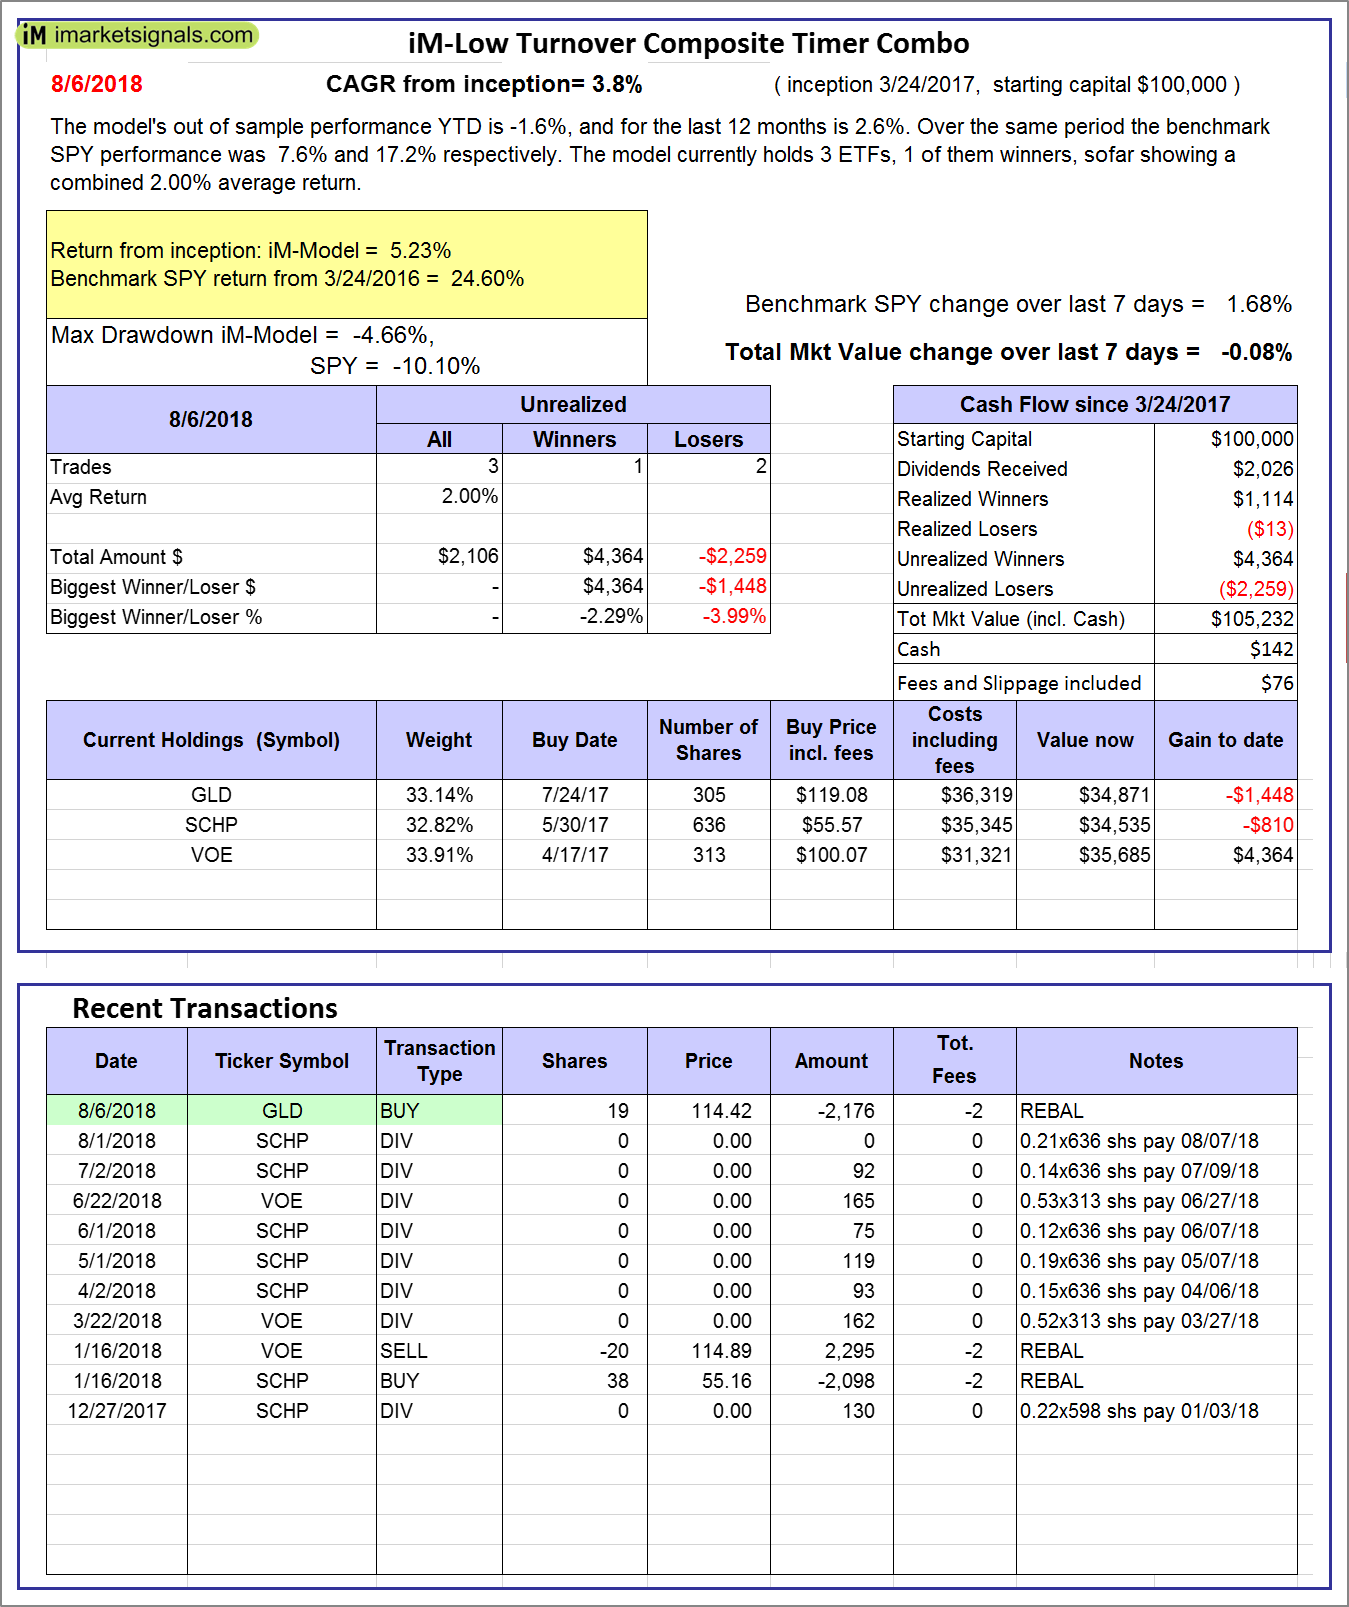 |
iM-Low Turnover Composite Timer Combo: The model’s out of sample performance YTD is -1.6%, and for the last 12 months is 2.6%. Over the same period the benchmark SPY performance was 7.6% and 17.2% respectively. Over the previous week the market value of the iM-Low Turnover Composite Timer Combo gained -0.08% at a time when SPY gained 1.68%. A starting capital of $100,000 at inception on 3/24/27 would have grown to $105,232 which includes $142 cash and excludes $76 spent on fees and slippage. |
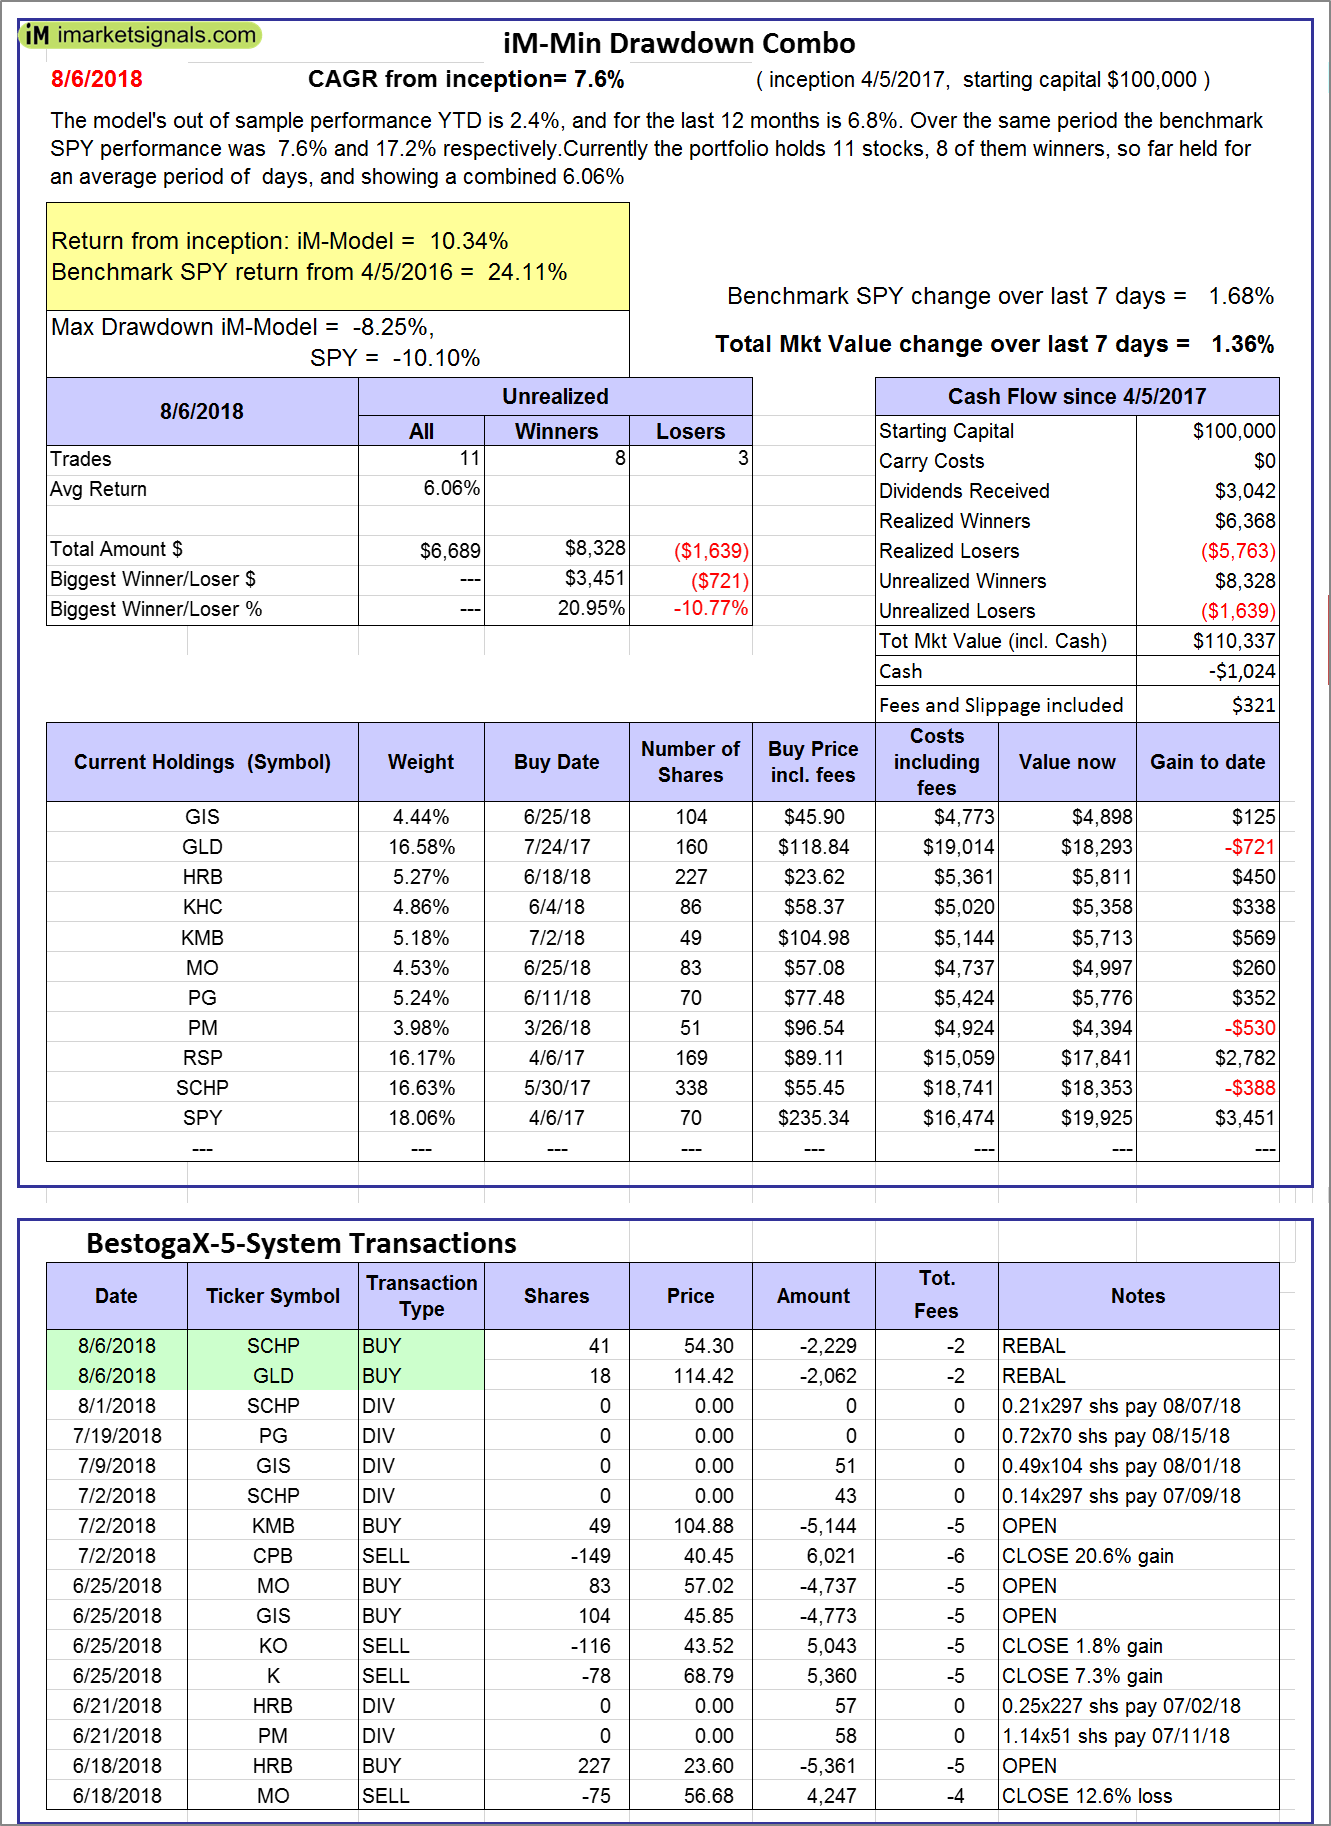 |
iM-Min Drawdown Combo: The model’s out of sample performance YTD is 2.4%, and for the last 12 months is 6.8%. Over the same period the benchmark SPY performance was 7.6% and 17.2% respectively. Over the previous week the market value of the iM-Min Drawdown Combo gained 1.36% at a time when SPY gained 1.68%. A starting capital of $100,000 at inception on 4/5/2017 would have grown to $110,337 which includes -$1,024 cash and excludes $321 spent on fees and slippage. |
 |
iM-5ETF Trader (includes leveraged ETFs): The model’s out of sample performance YTD is 14.1%, and for the last 12 months is 33.9%. Over the same period the benchmark SPY performance was 7.6% and 17.2% respectively. Over the previous week the market value of the iM-5ETF Trader (includes leveraged ETFs) gained 3.47% at a time when SPY gained 1.68%. A starting capital of $100,000 at inception on 10/30/2016 would have grown to $185,638 which includes $1,539 cash and excludes $1,030 spent on fees and slippage. |
 |
iM-Standard 5ETF Trader (excludes leveraged ETFs): The model’s out of sample performance YTD is 6.2%, and for the last 12 months is 15.7%. Over the same period the benchmark SPY performance was 7.6% and 17.2% respectively. Over the previous week the market value of the iM-Standard 5ETF Trader (excludes leveraged ETFs) gained 1.40% at a time when SPY gained 1.68%. A starting capital of $100,000 at inception on 10/30/2016 would have grown to $133,424 which includes $3,101 cash and excludes $880 spent on fees and slippage. |
Posted in pmp SPY-SH
iM-Best Reports – 7/30/2018
  |
Out of sample performance summary of our models for the past 1, 2, 4 and 13 week periods. The active active return indicates how the models over- or underperformed the benchmark ETF SPY. Also the YTD, and the 1-, 3-, 5- and 10-year annualized returns are shown in the second table |
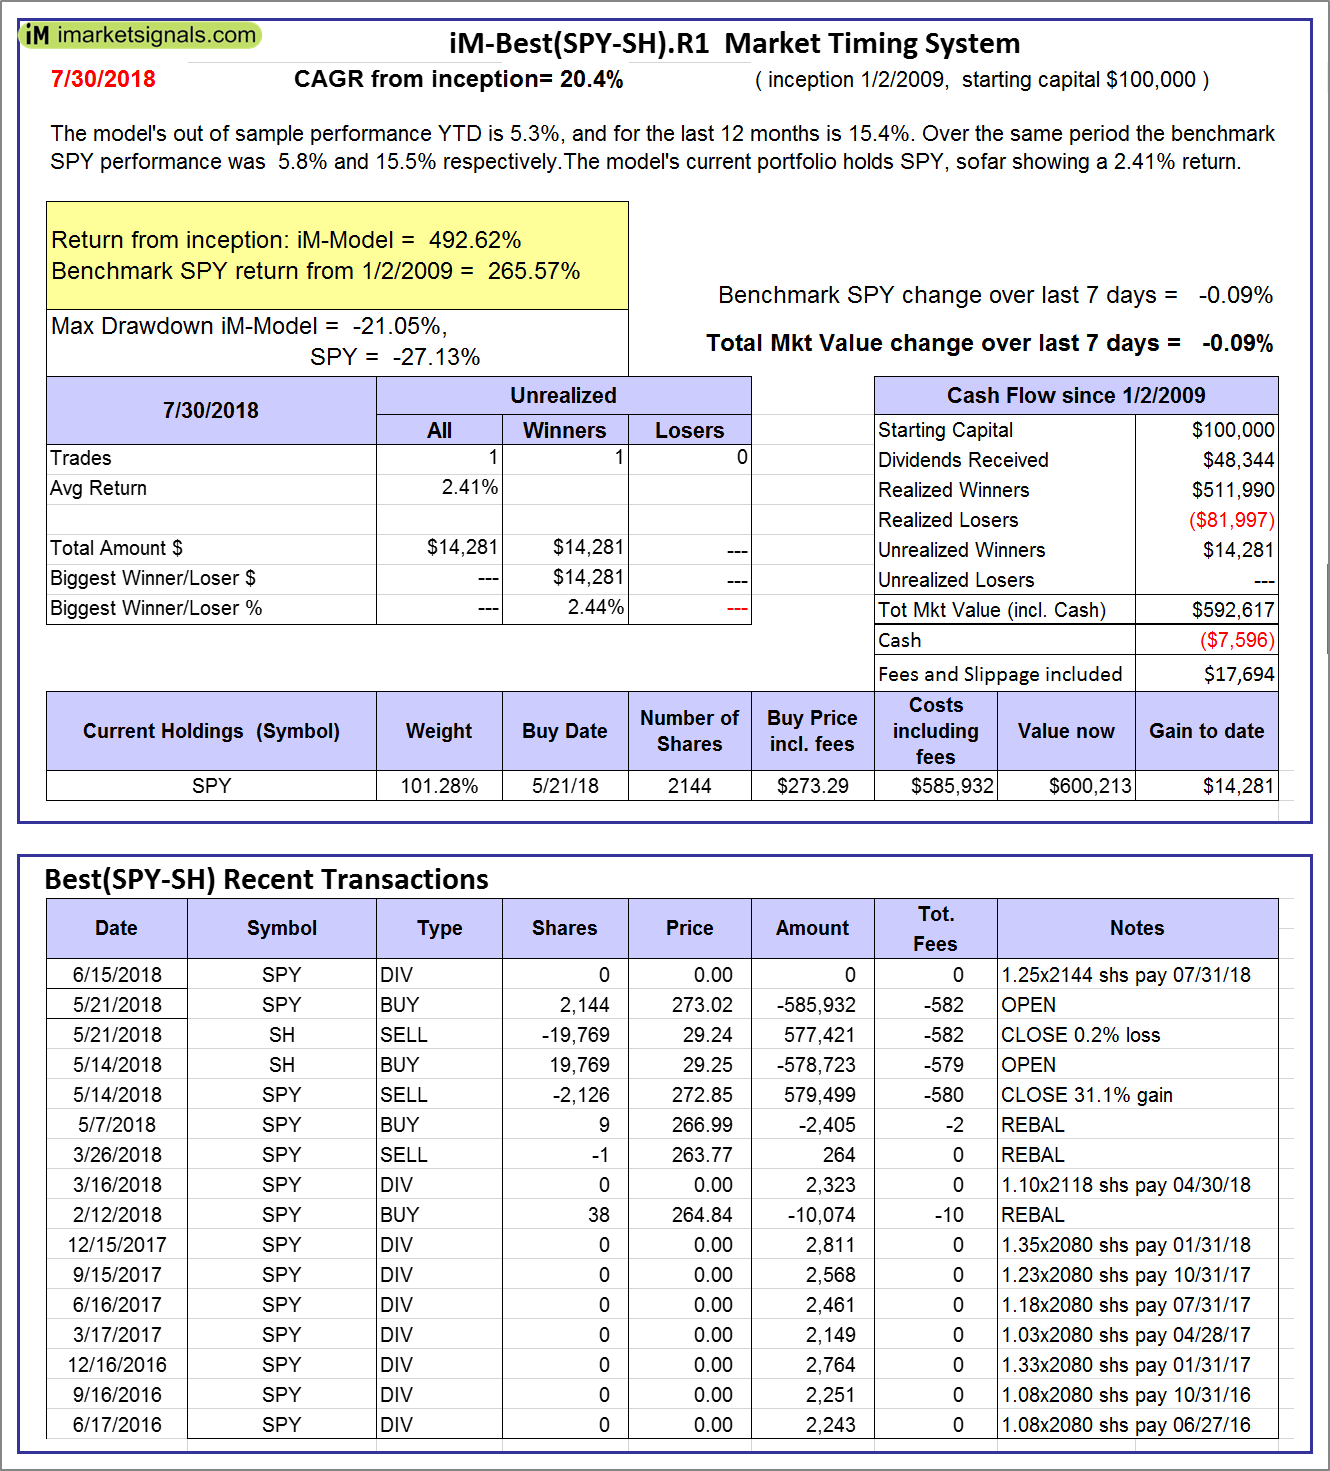 |
iM-Best(SPY-SH).R1: The model’s out of sample performance YTD is 5.3%, and for the last 12 months is 15.4%. Over the same period the benchmark SPY performance was 5.8% and 15.5% respectively. Over the previous week the market value of Best(SPY-SH) gained -0.09% at a time when SPY gained -0.09%. A starting capital of $100,000 at inception on 1/2/2009 would have grown to $592,617 which includes -$7,596 cash and excludes $17,694 spent on fees and slippage. |
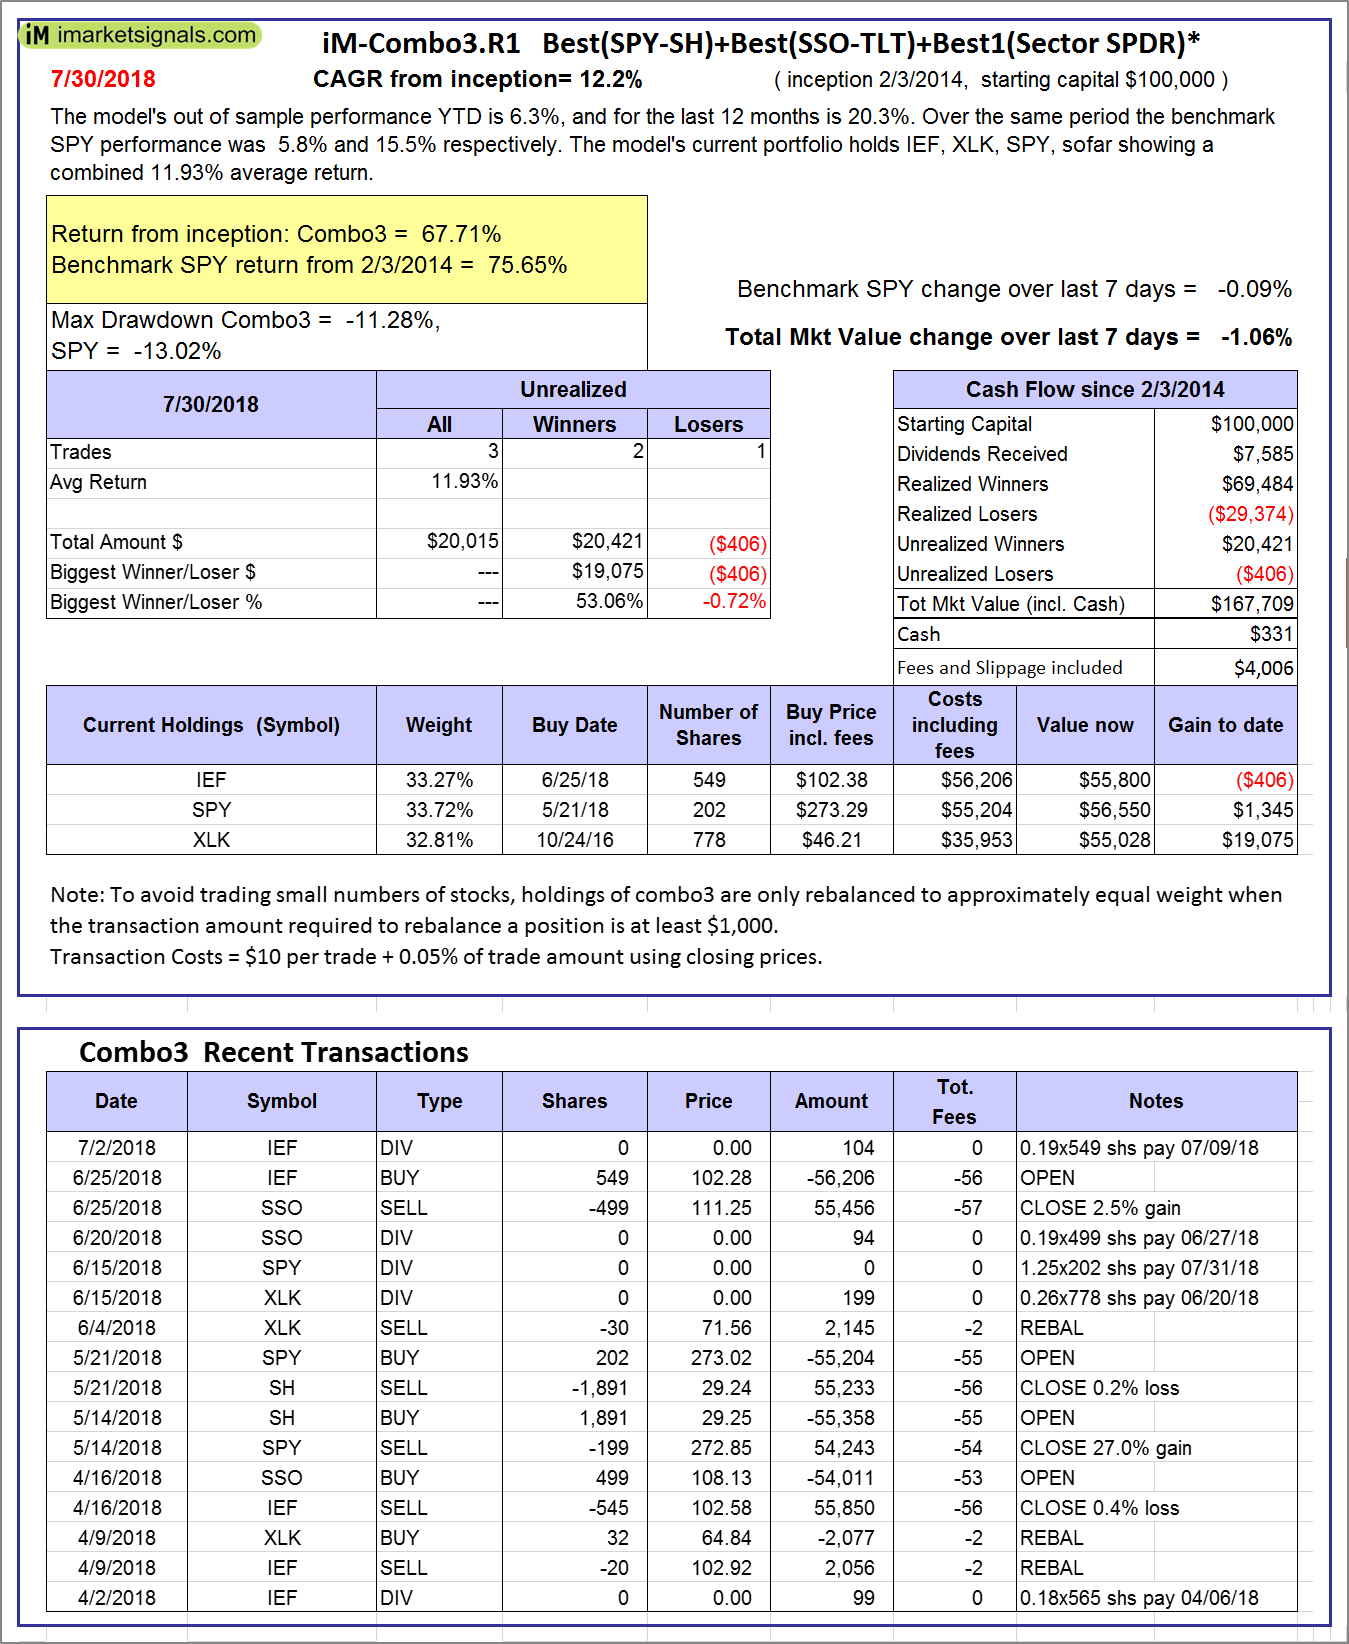 |
iM-Combo3.R1: The model’s out of sample performance YTD is 6.3%, and for the last 12 months is 20.3%. Over the same period the benchmark SPY performance was 5.8% and 15.5% respectively. Over the previous week the market value of iM-Combo3.R1 gained -1.06% at a time when SPY gained -0.09%. A starting capital of $100,000 at inception on 2/3/2014 would have grown to $167,709 which includes $331 cash and excludes $4,006 spent on fees and slippage. |
 |
iM-Combo5: The model’s out of sample performance YTD is 7.5%, and for the last 12 months is 21.7%. Over the same period the benchmark SPY performance was 5.8% and 15.5% respectively. Over the previous week the market value of iM-Combo5 gained -1.66% at a time when SPY gained -0.09%. A starting capital of $100,000 at inception on 2/22/2016 would have grown to $137,290 which includes $1,724 cash and excludes $983 spent on fees and slippage. |
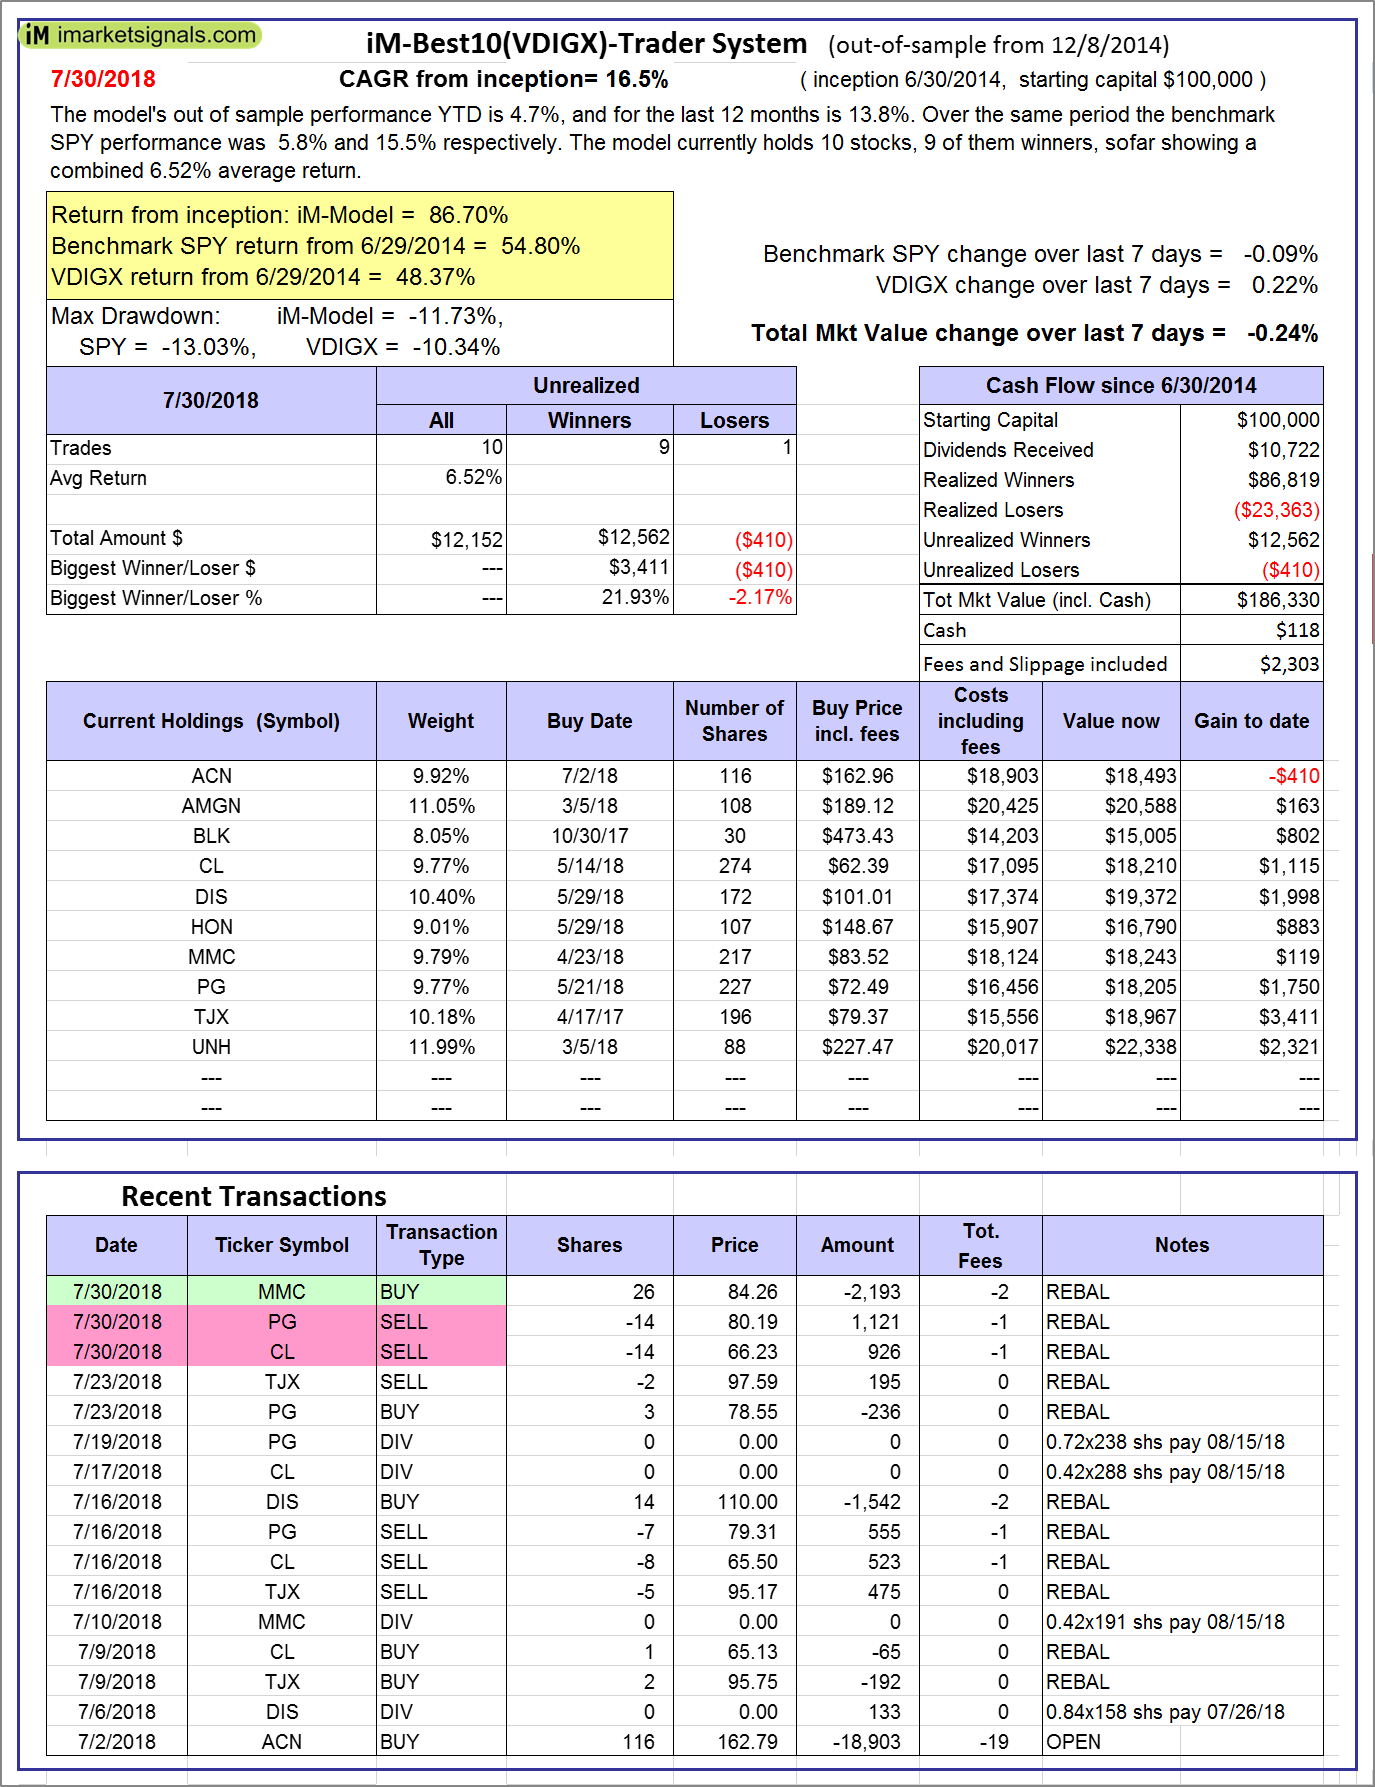 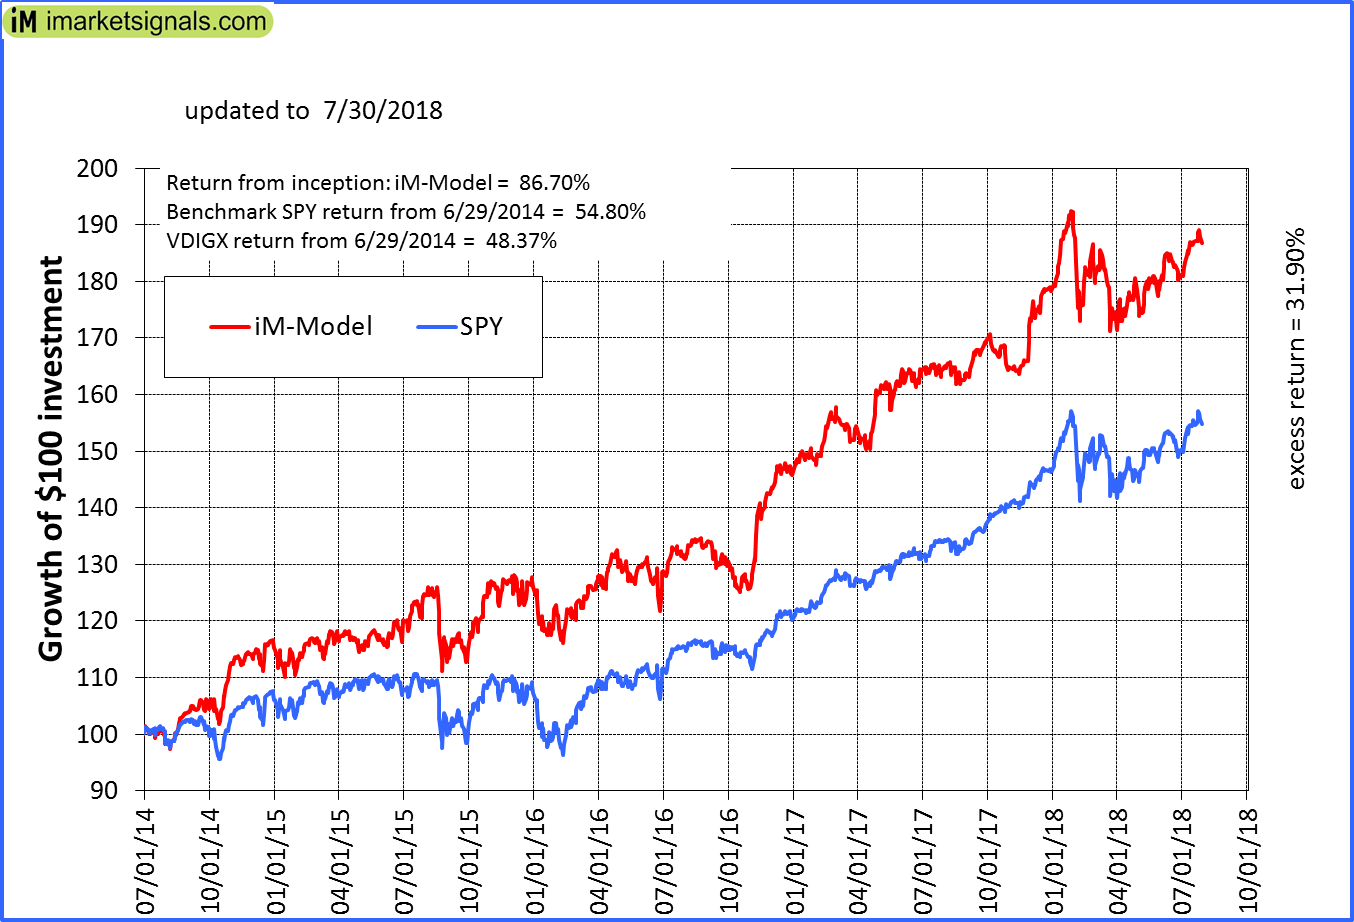 |
iM-Best10(VDIGX)-Trader: The model’s out of sample performance YTD is 4.7%, and for the last 12 months is 13.8%. Over the same period the benchmark SPY performance was 5.8% and 15.5% respectively. Since inception, on 7/1/2014, the model gained 86.70% while the benchmark SPY gained 54.80% and VDIGX gained 48.37% over the same period. Over the previous week the market value of iM-Best10(VDIGX) gained -0.24% at a time when SPY gained -0.09%. A starting capital of $100,000 at inception on 7/1/2014 would have grown to $186,330 which includes $118 cash and excludes $2,303 spent on fees and slippage. |
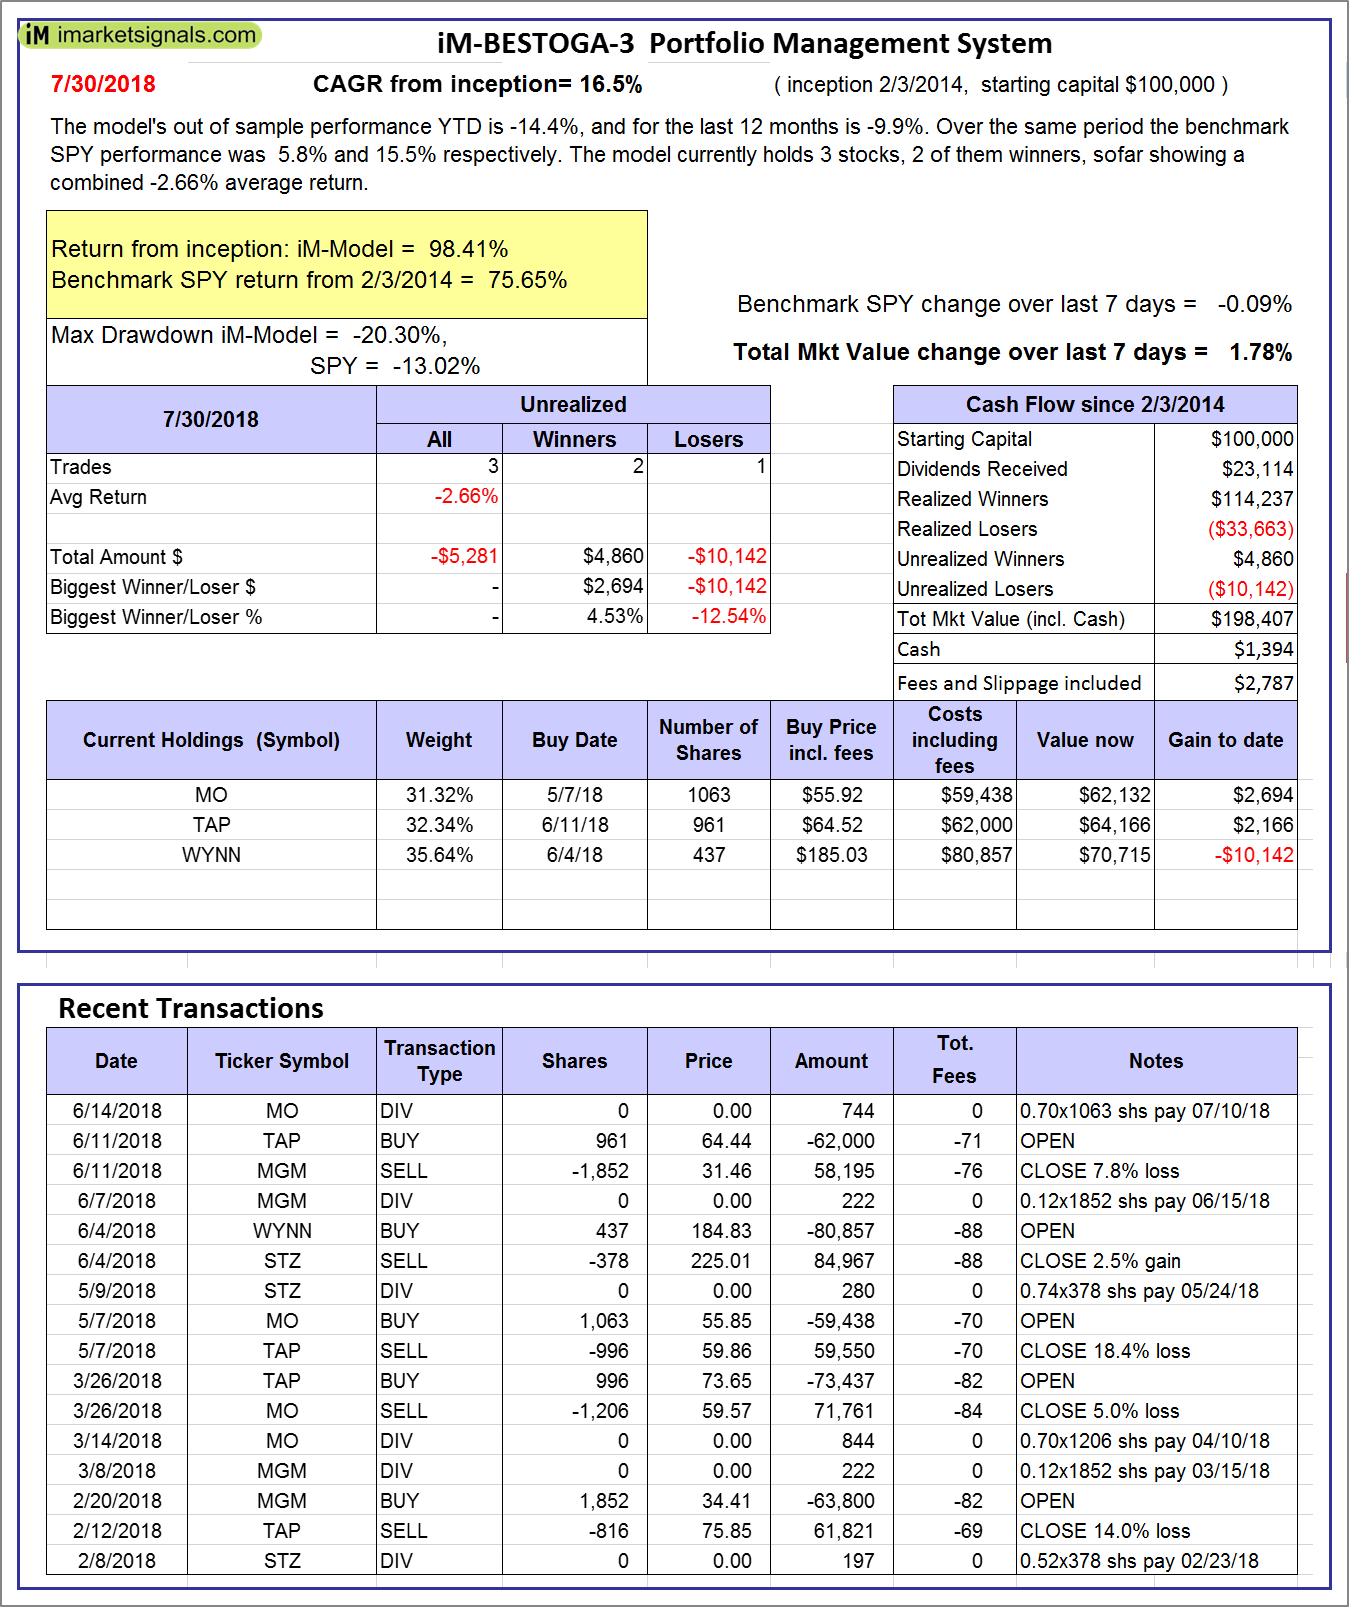 |
iM-BESTOGA-3: The model’s out of sample performance YTD is -14.4%, and for the last 12 months is -9.9%. Over the same period the benchmark SPY performance was 5.8% and 15.5% respectively. Over the previous week the market value of iM-BESTOGA-3 gained 1.78% at a time when SPY gained -0.09%. A starting capital of $100,000 at inception on 2/3/2014 would have grown to $198,407 which includes $1,394 cash and excludes $2,787 spent on fees and slippage. |
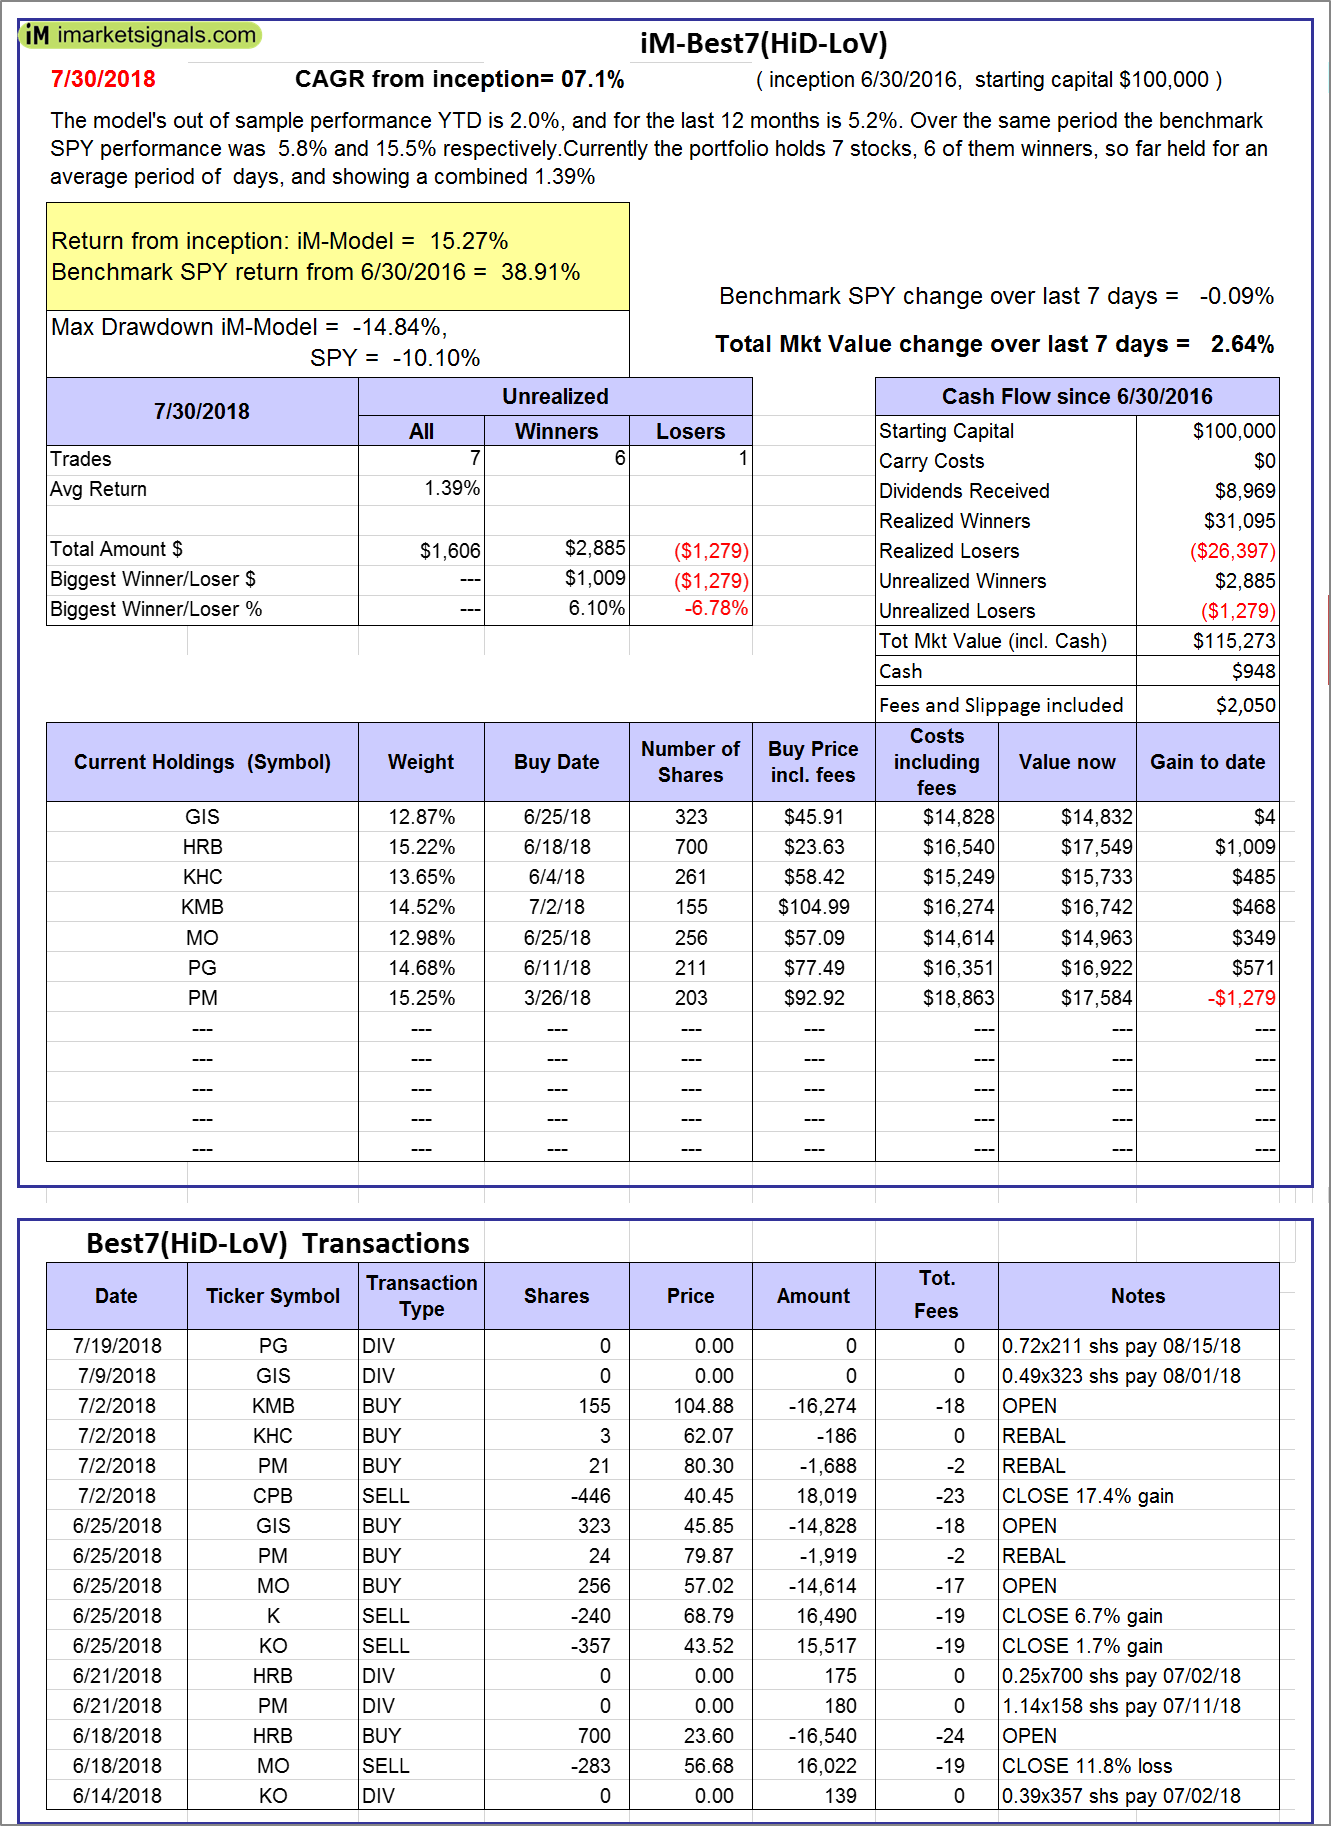 |
iM-Best7(HiD-LoV): The model’s out of sample performance YTD is 2.0%, and for the last 12 months is 5.2%. Over the same period the benchmark SPY performance was 5.8% and 15.5% respectively. Over the previous week the market value of iM-BESTOGA-3 gained 2.64% at a time when SPY gained -0.09%. A starting capital of $100,000 at inception on 6/30/2016 would have grown to $115,273 which includes $948 cash and excludes $2,050 spent on fees and slippage. |
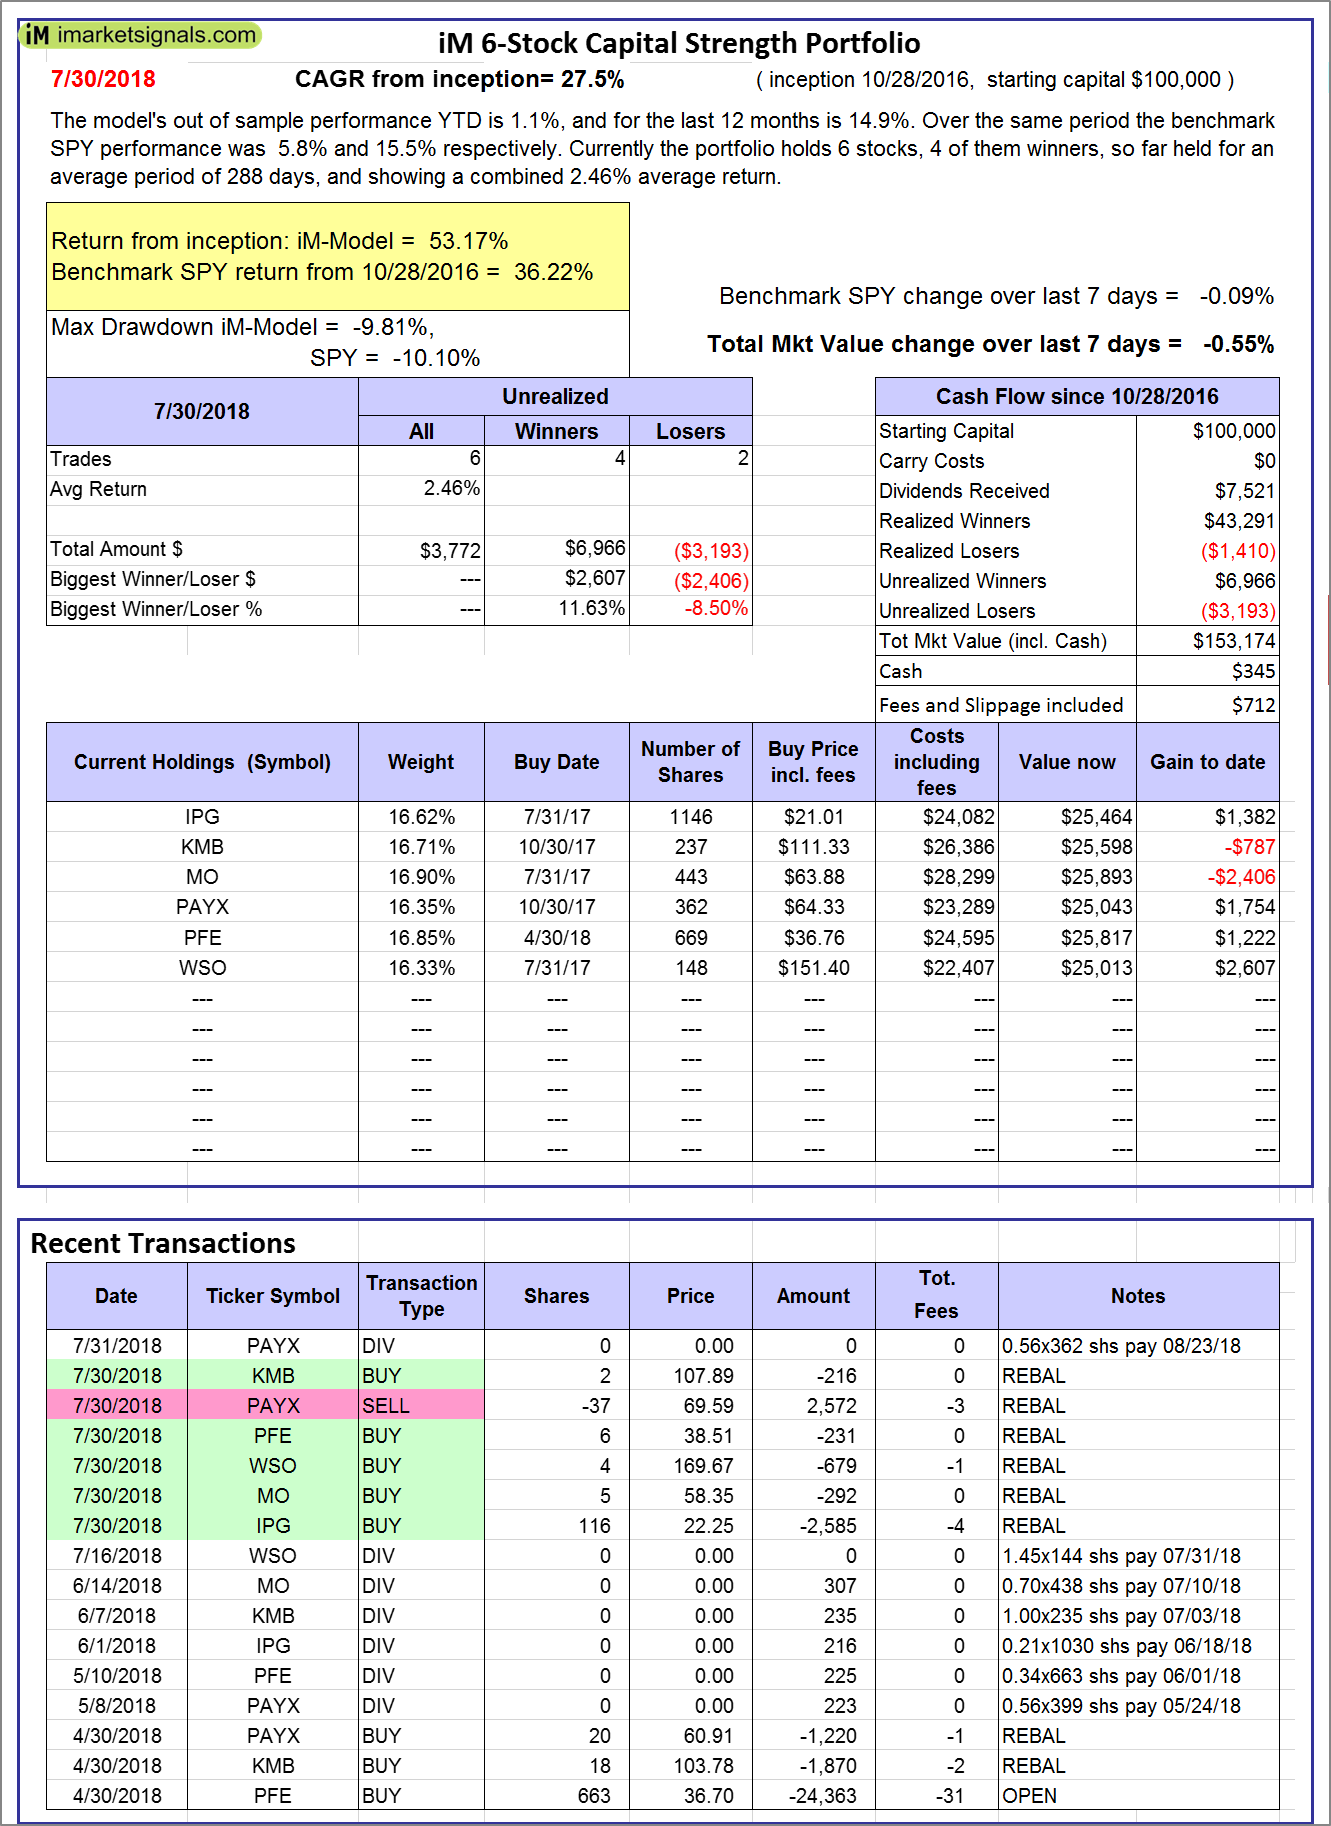 |
iM 6-Stock Capital Strength Portfolio: The model’s out of sample performance YTD is 1.1%, and for the last 12 months is 14.9%. Over the same period the benchmark SPY performance was 5.8% and 15.5% respectively. Over the previous week the market value of the iM 6-Stock Capital Strength Portfolio gained -0.55% at a time when SPY gained -0.09%. A starting capital of $100,000 at inception on 10/28/2016 would have grown to $153,174 which includes $345 cash and excludes $712 spent on fees and slippage. |
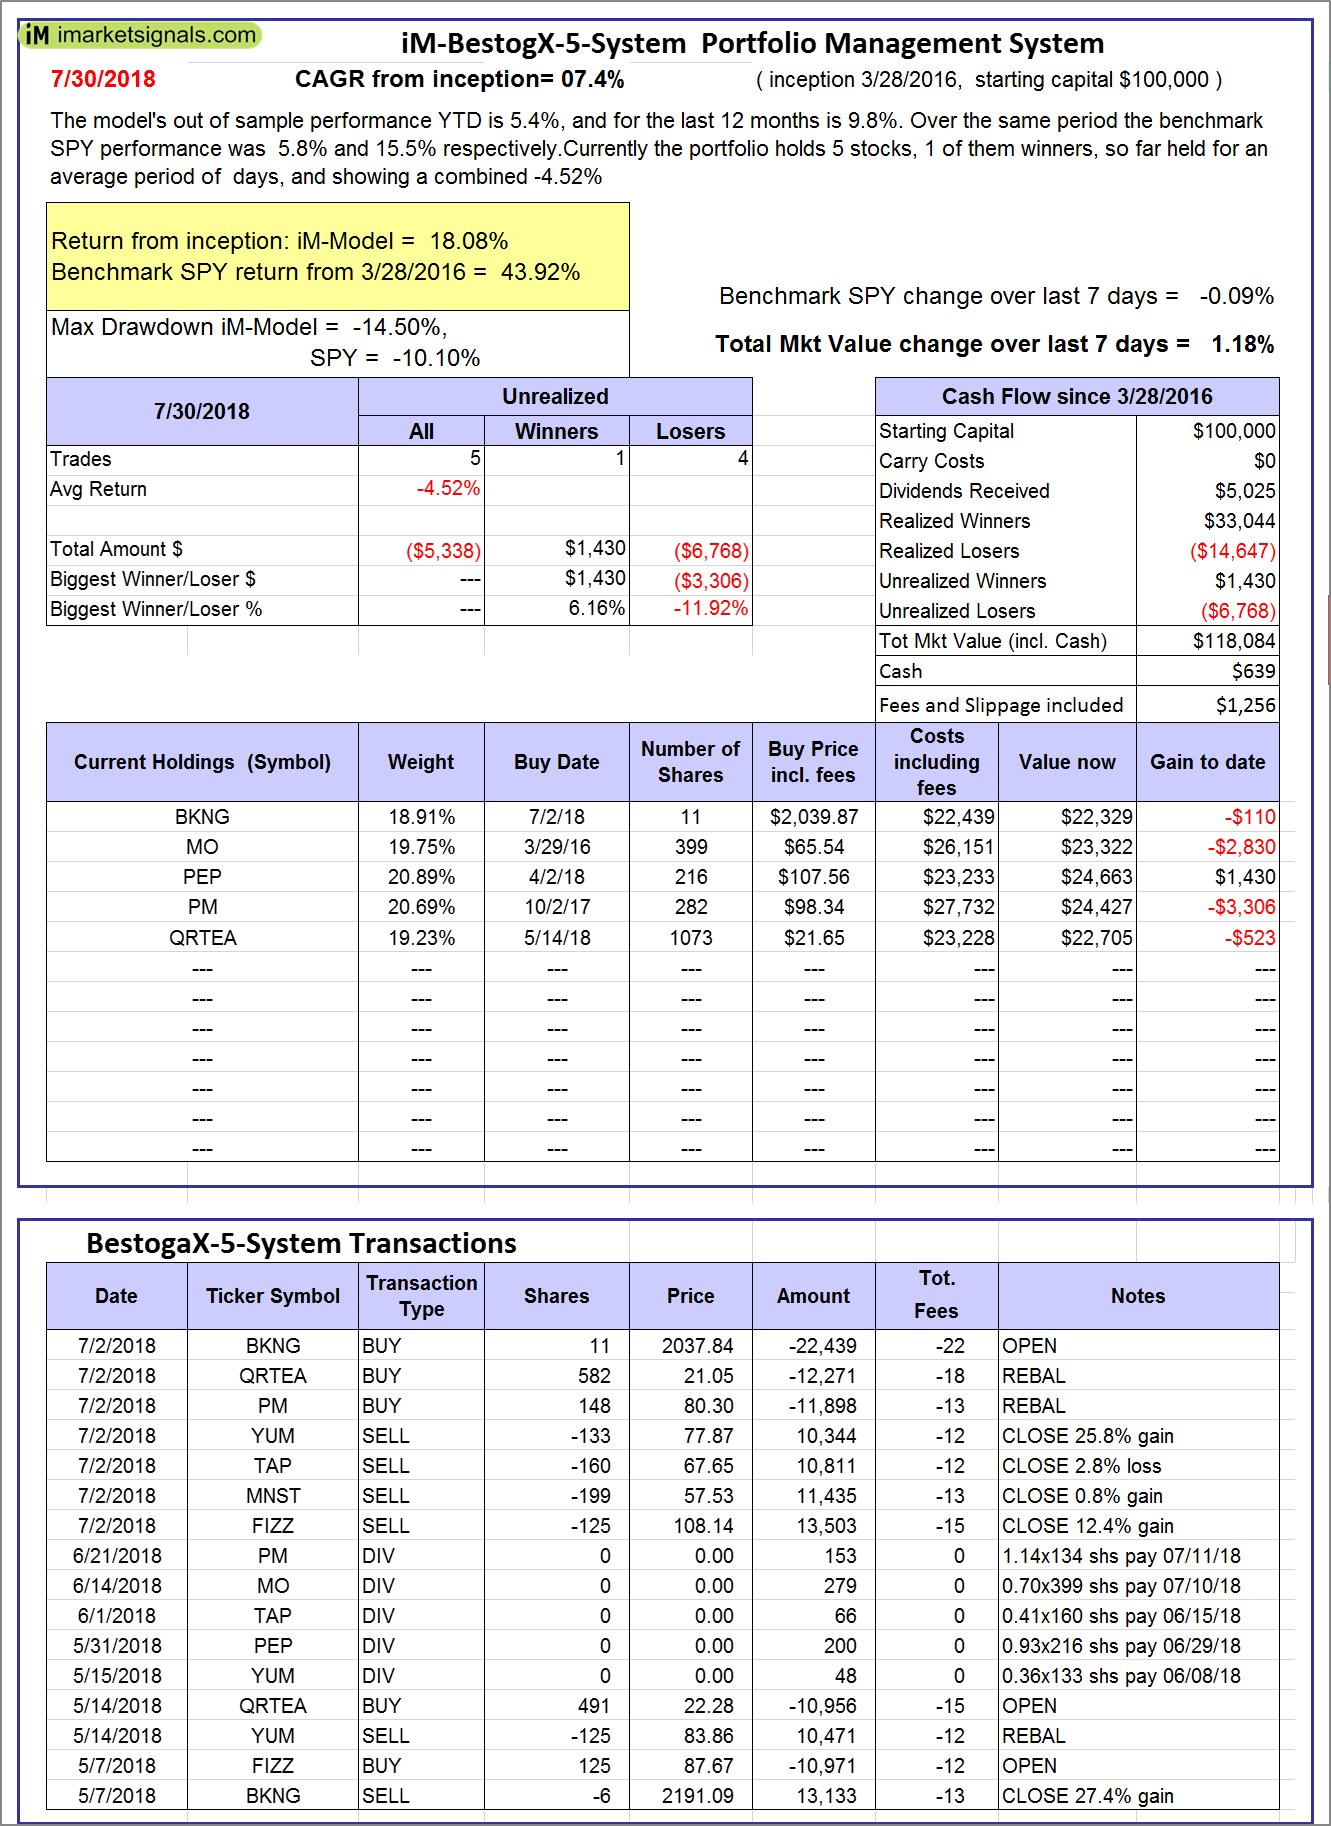 |
iM-BestogaX5-System: The model’s out of sample performance YTD is 5.4%, and for the last 12 months is 9.8%. Over the same period the benchmark SPY performance was 5.8% and 15.5% respectively. Over the previous week the market value of iM-BestogaX5-System gained 1.18% at a time when SPY gained -0.09%. A starting capital of $100,000 at inception on 3/28/2016 would have grown to $118,084 which includes $639 cash and excludes $1,256 spent on fees and slippage. |
 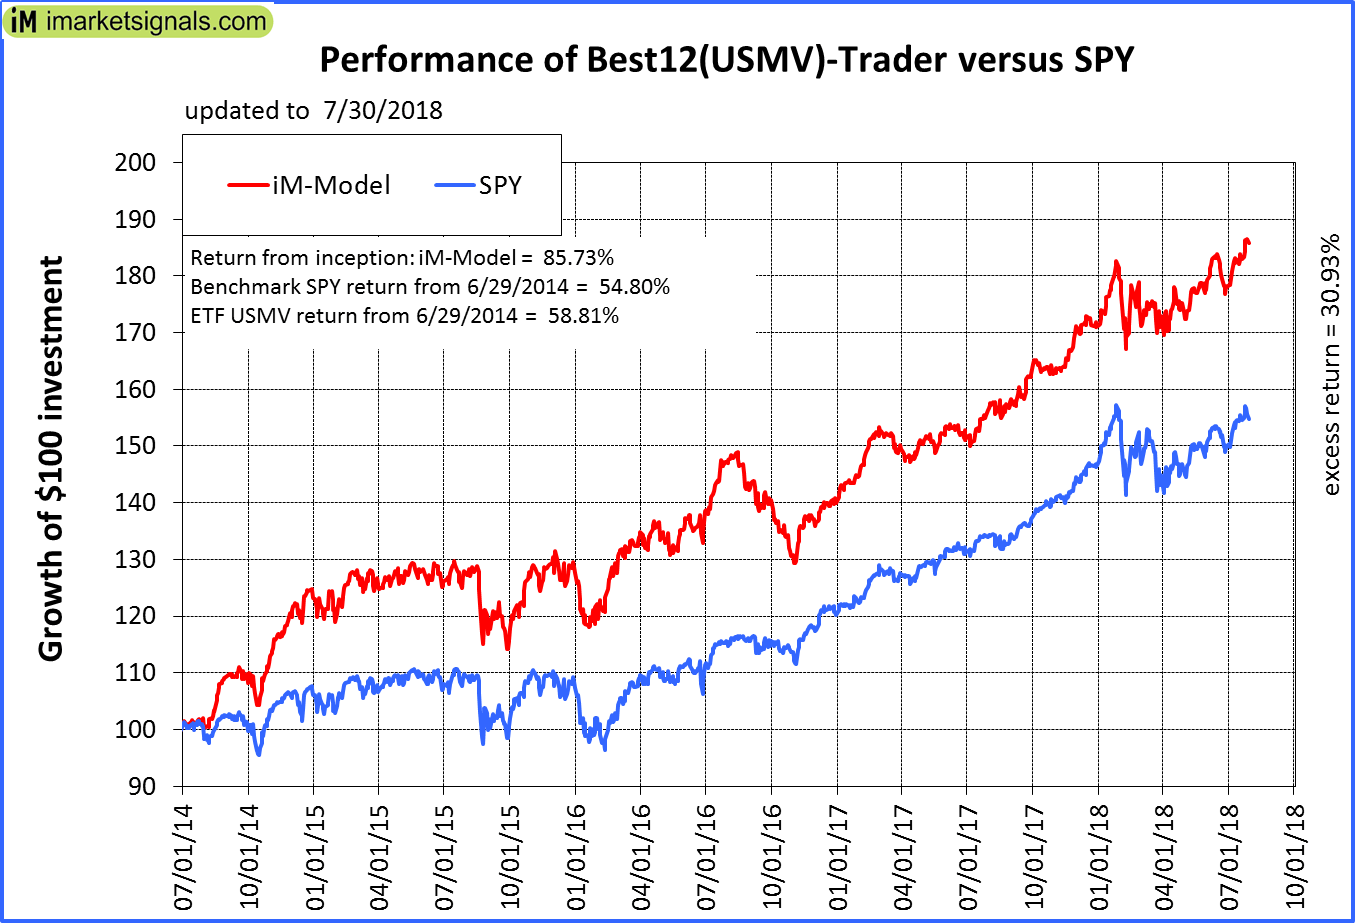 |
iM-Best12(USMV)-Trader: The model’s out of sample performance YTD is 8.6%, and for the last 12 months is 19.5%. Over the same period the benchmark SPY performance was 5.8% and 15.5% respectively. Since inception, on 6/30/2014, the model gained 85.73% while the benchmark SPY gained 54.80% and the ETF USMV gained 58.81% over the same period. Over the previous week the market value of iM-Best12(USMV)-Trader gained 1.35% at a time when SPY gained -0.09%. A starting capital of $100,000 at inception on 6/30/2014 would have grown to $185,674 which includes $503 cash and excludes $4,364 spent on fees and slippage. |
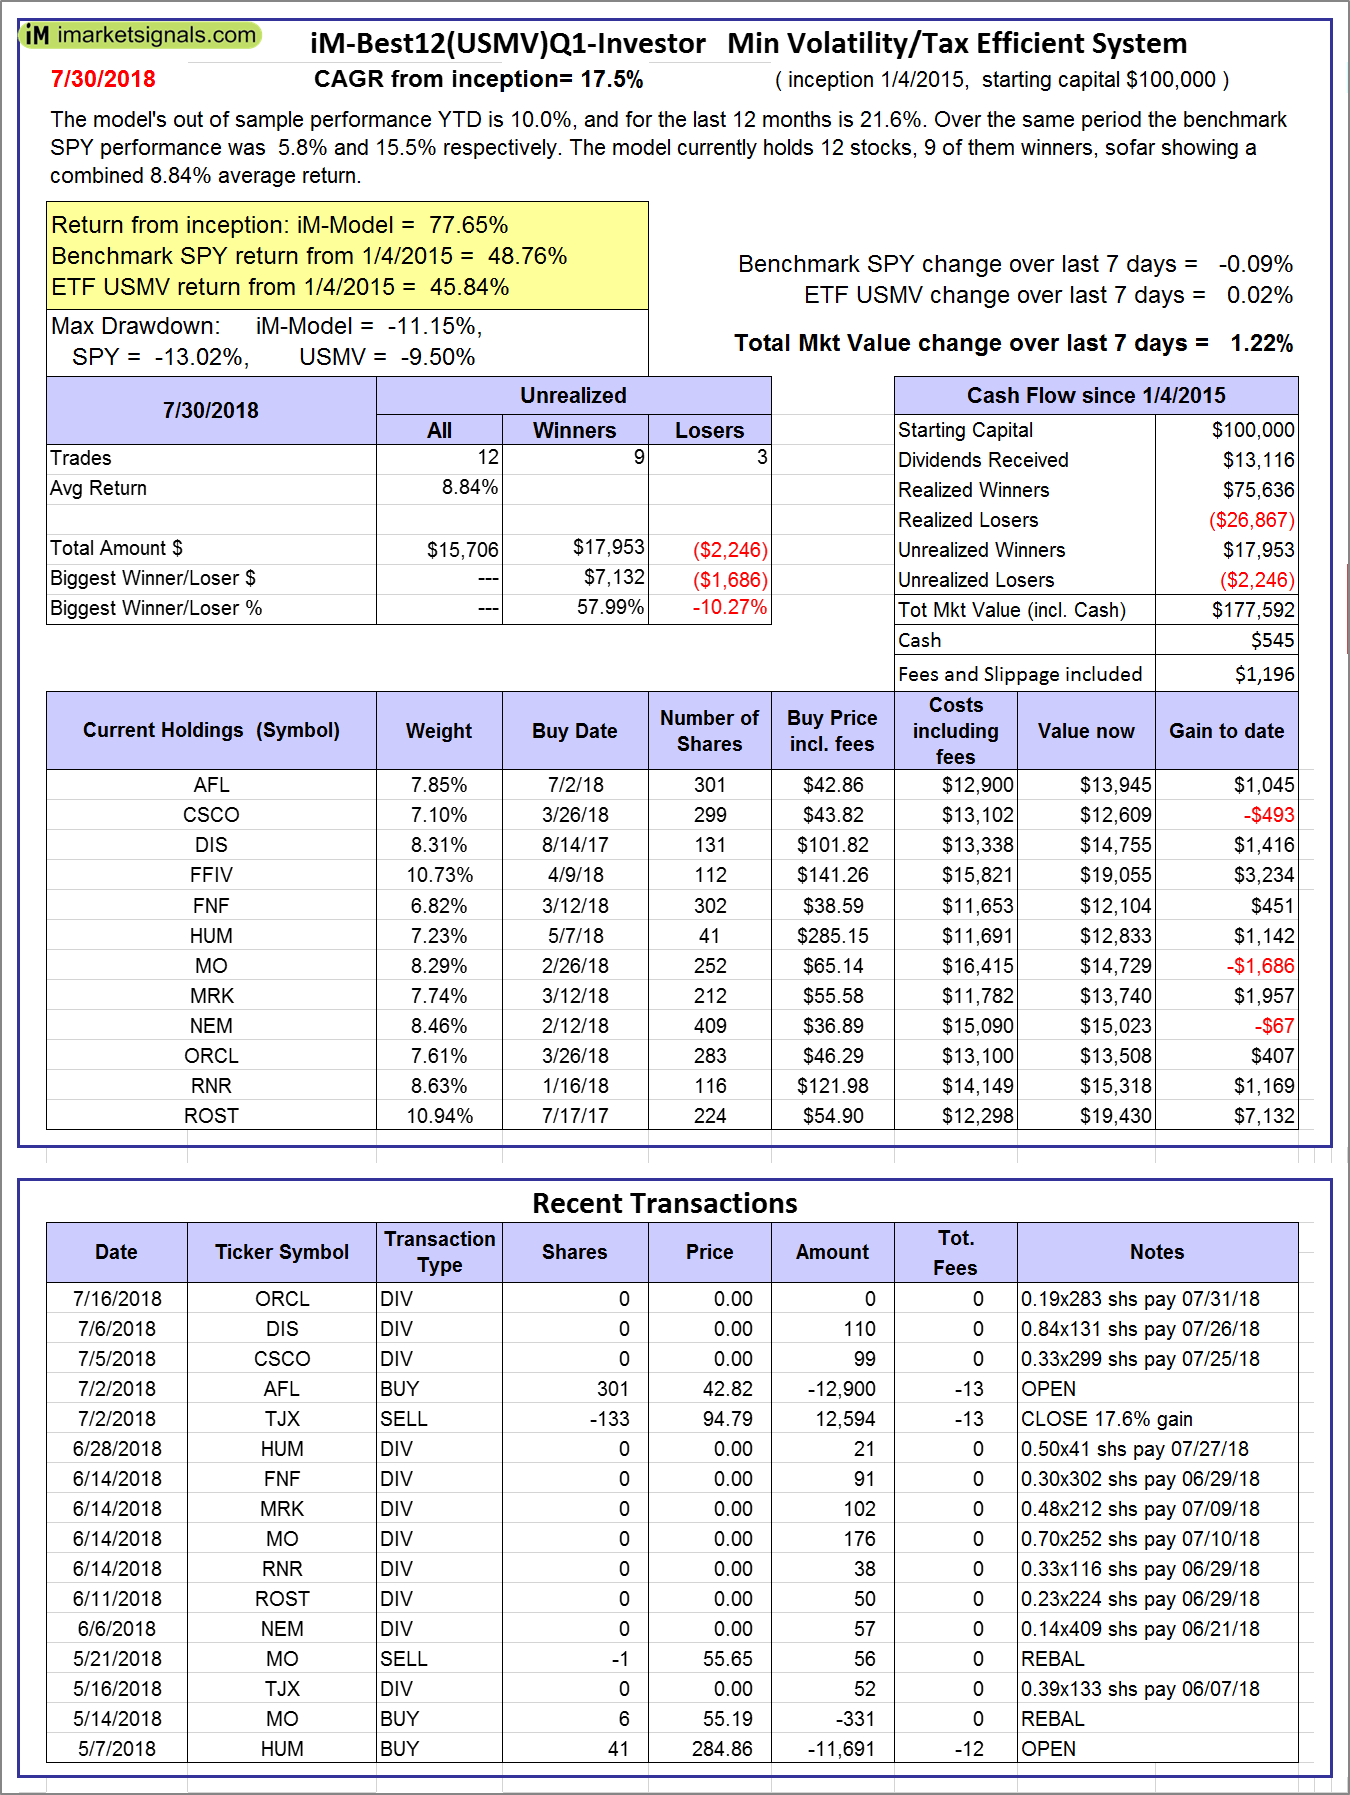  |
iM-Best12(USMV)Q1-Investor: The model’s out of sample performance YTD is 10.0%, and for the last 12 months is 21.6%. Over the same period the benchmark SPY performance was 5.8% and 15.5% respectively. Since inception, on 1/5/2015, the model gained 77.65% while the benchmark SPY gained 48.76% and the ETF USMV gained 45.84% over the same period. Over the previous week the market value of iM-Best12(USMV)Q1 gained 1.22% at a time when SPY gained -0.09%. A starting capital of $100,000 at inception on 1/5/2015 would have grown to $177,592 which includes $545 cash and excludes $1,196 spent on fees and slippage. |
  |
iM-Best12(USMV)Q2-Investor: The model’s out of sample performance YTD is 8.6%, and for the last 12 months is 14.6%. Over the same period the benchmark SPY performance was 5.8% and 15.5% respectively. Since inception, on 3/30/2015, the model gained 47.25% while the benchmark SPY gained 43.45% and the ETF USMV gained 40.86% over the same period. Over the previous week the market value of iM-Best12(USMV)Q2 gained -0.09% at a time when SPY gained -0.09%. A starting capital of $100,000 at inception on 3/30/2015 would have grown to $147,206 which includes $382 cash and excludes $1,014 spent on fees and slippage. |
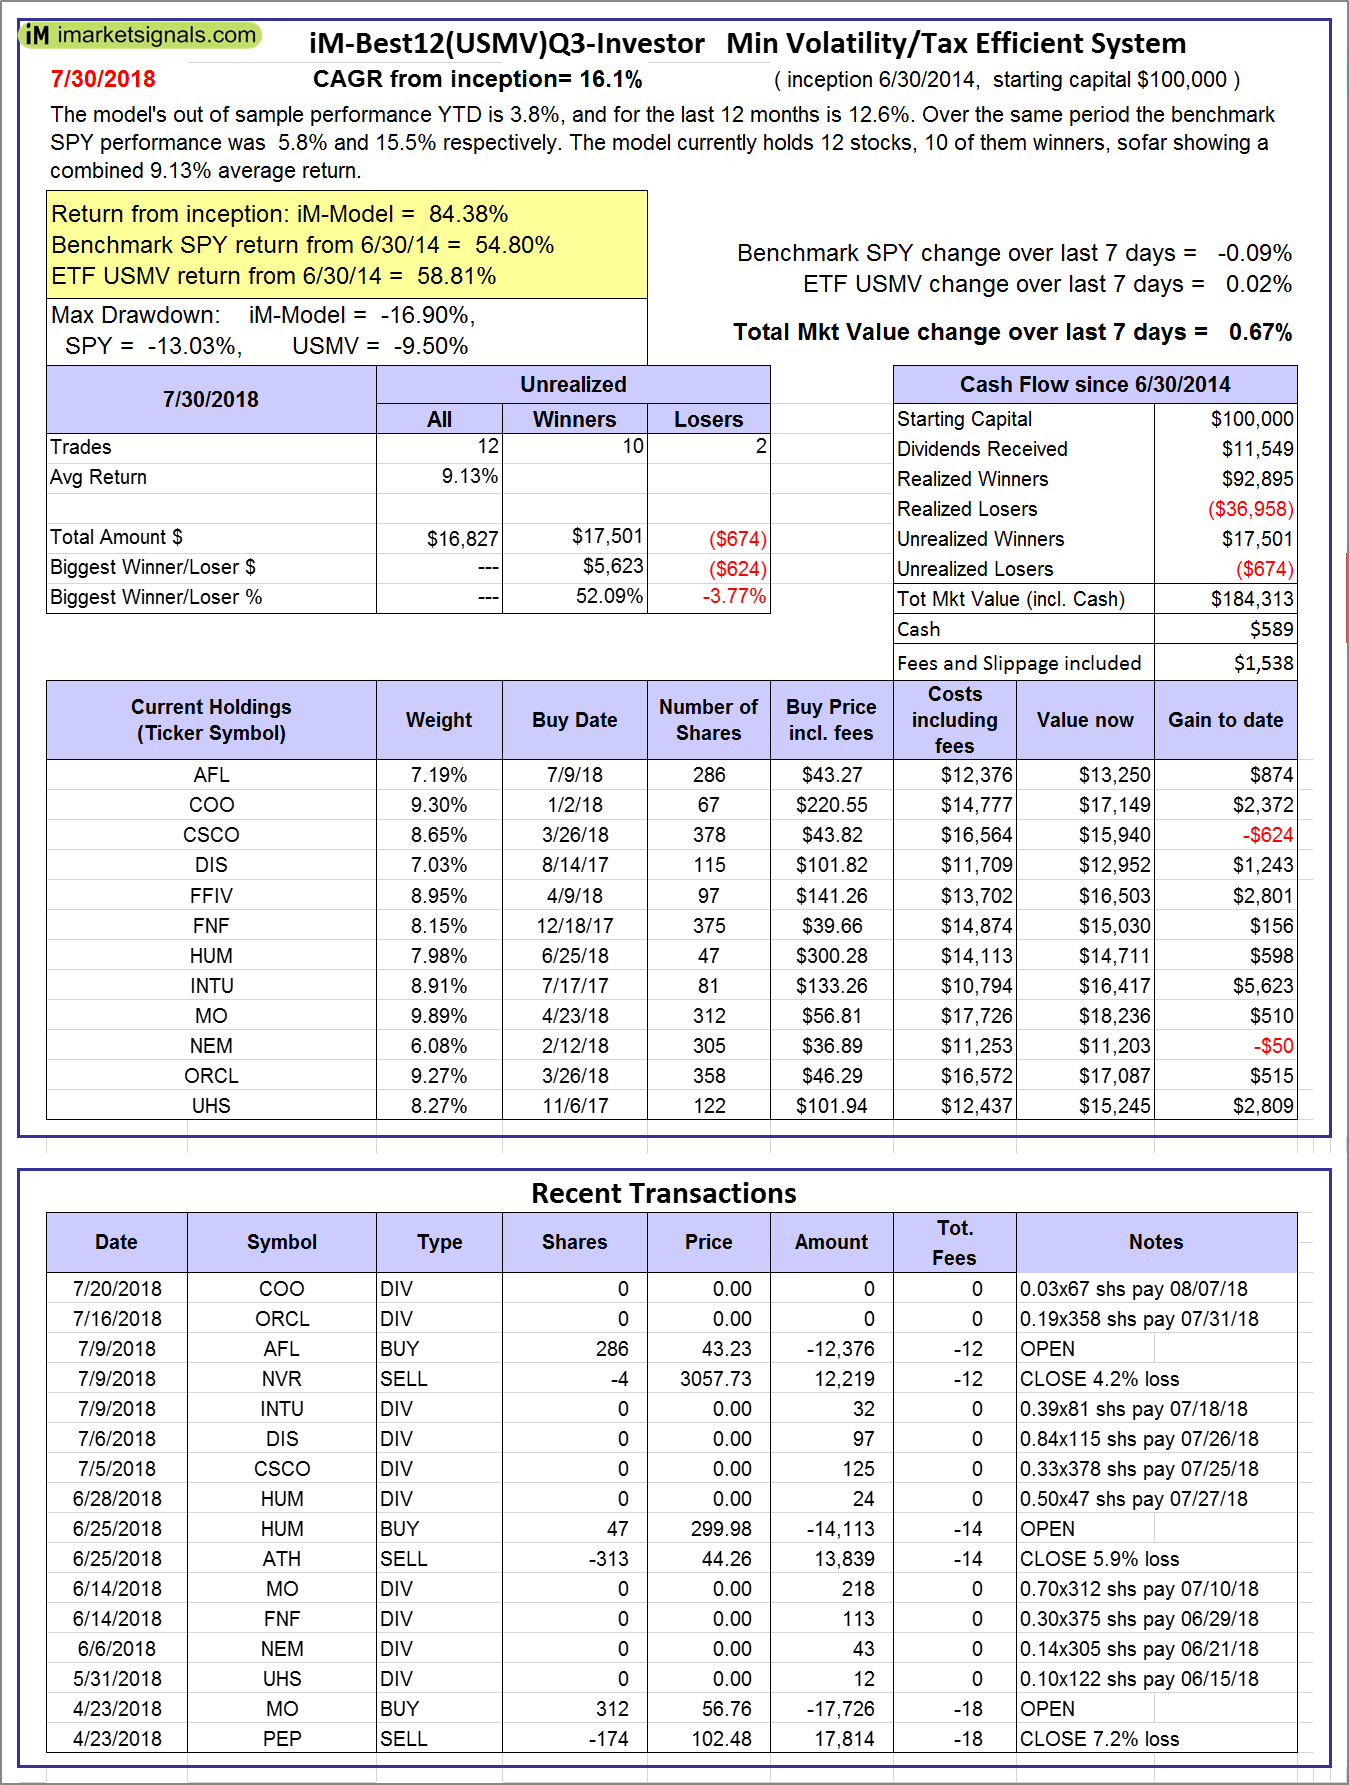  |
iM-Best12(USMV)Q3-Investor: The model’s out of sample performance YTD is 3.8%, and for the last 12 months is 12.6%. Over the same period the benchmark SPY performance was 5.8% and 15.5% respectively. Since inception, on 7/1/2014, the model gained 84.38% while the benchmark SPY gained 54.80% and the ETF USMV gained 58.81% over the same period. Over the previous week the market value of iM-Best12(USMV)Q3 gained 0.67% at a time when SPY gained -0.09%. A starting capital of $100,000 at inception on 7/1/2014 would have grown to $184,313 which includes $589 cash and excludes $1,538 spent on fees and slippage. |
 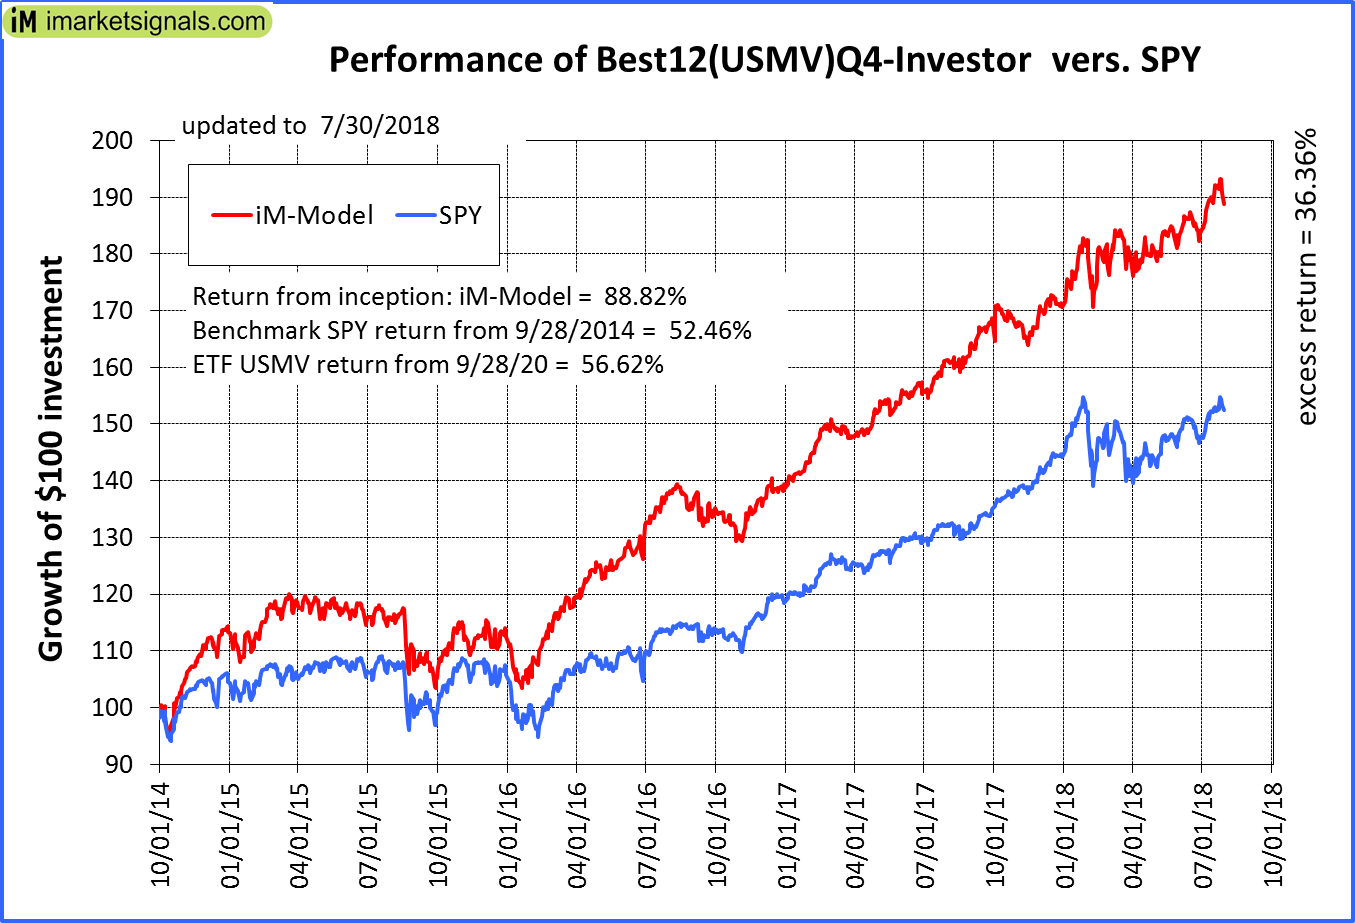 |
iM-Best12(USMV)Q4-Investor: Since inception, on 9/29/2014, the model gained 88.82% while the benchmark SPY gained 52.46% and the ETF USMV gained 56.62% over the same period. Over the previous week the market value of iM-Best12(USMV)Q4 gained -1.77% at a time when SPY gained -0.09%. A starting capital of $100,000 at inception on 9/29/2014 would have grown to $188,771 which includes $277 cash and excludes $1,340 spent on fees and slippage. |
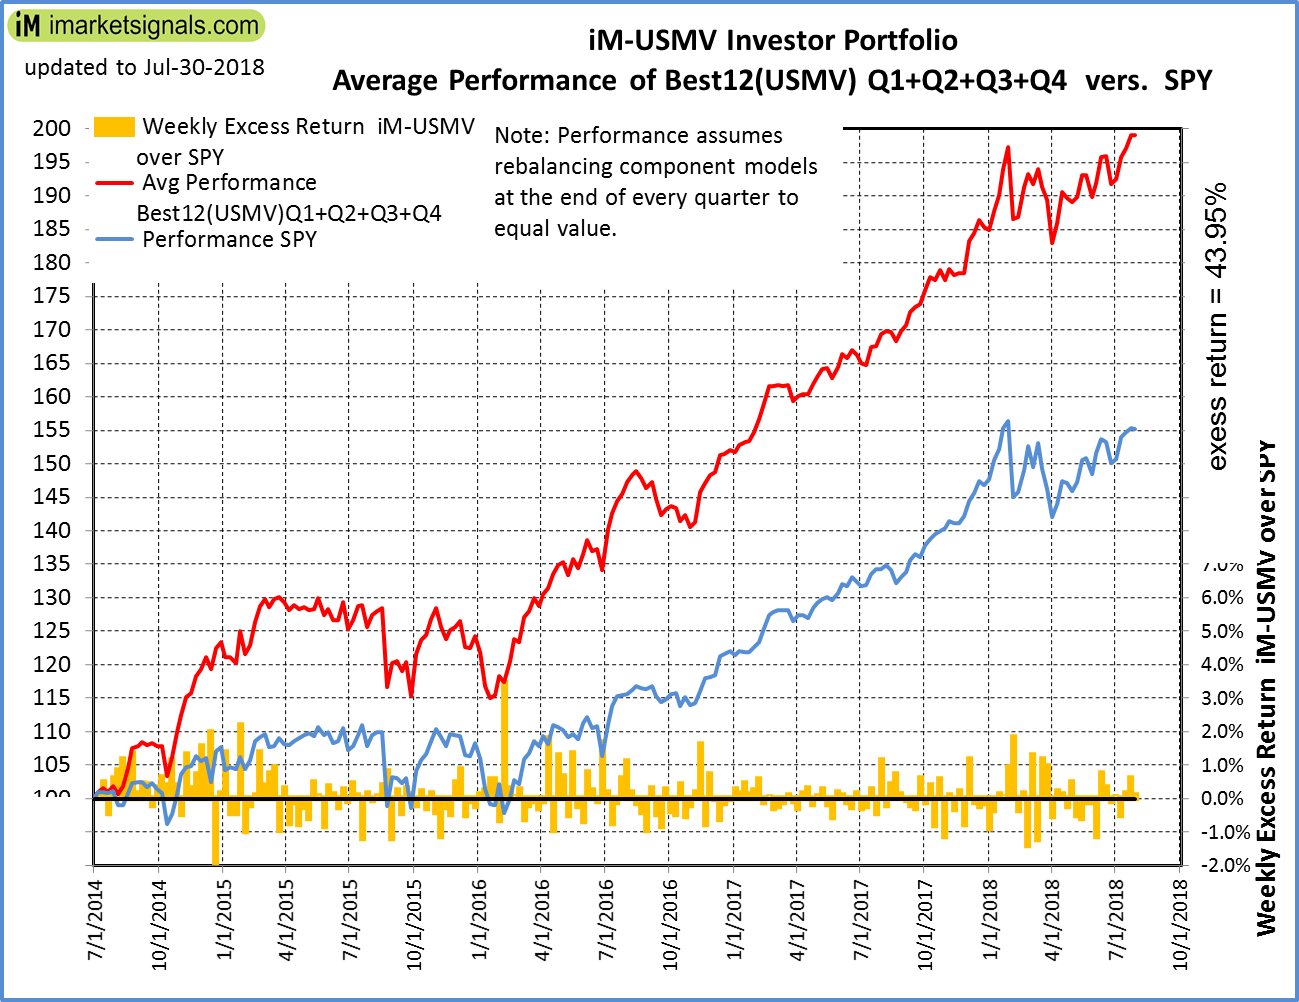 |
Average Performance of iM-Best12(USMV)Q1+Q2+Q3+Q4-Investor resulted in an excess return of 43.95% over SPY. (see iM-USMV Investor Portfolio) |
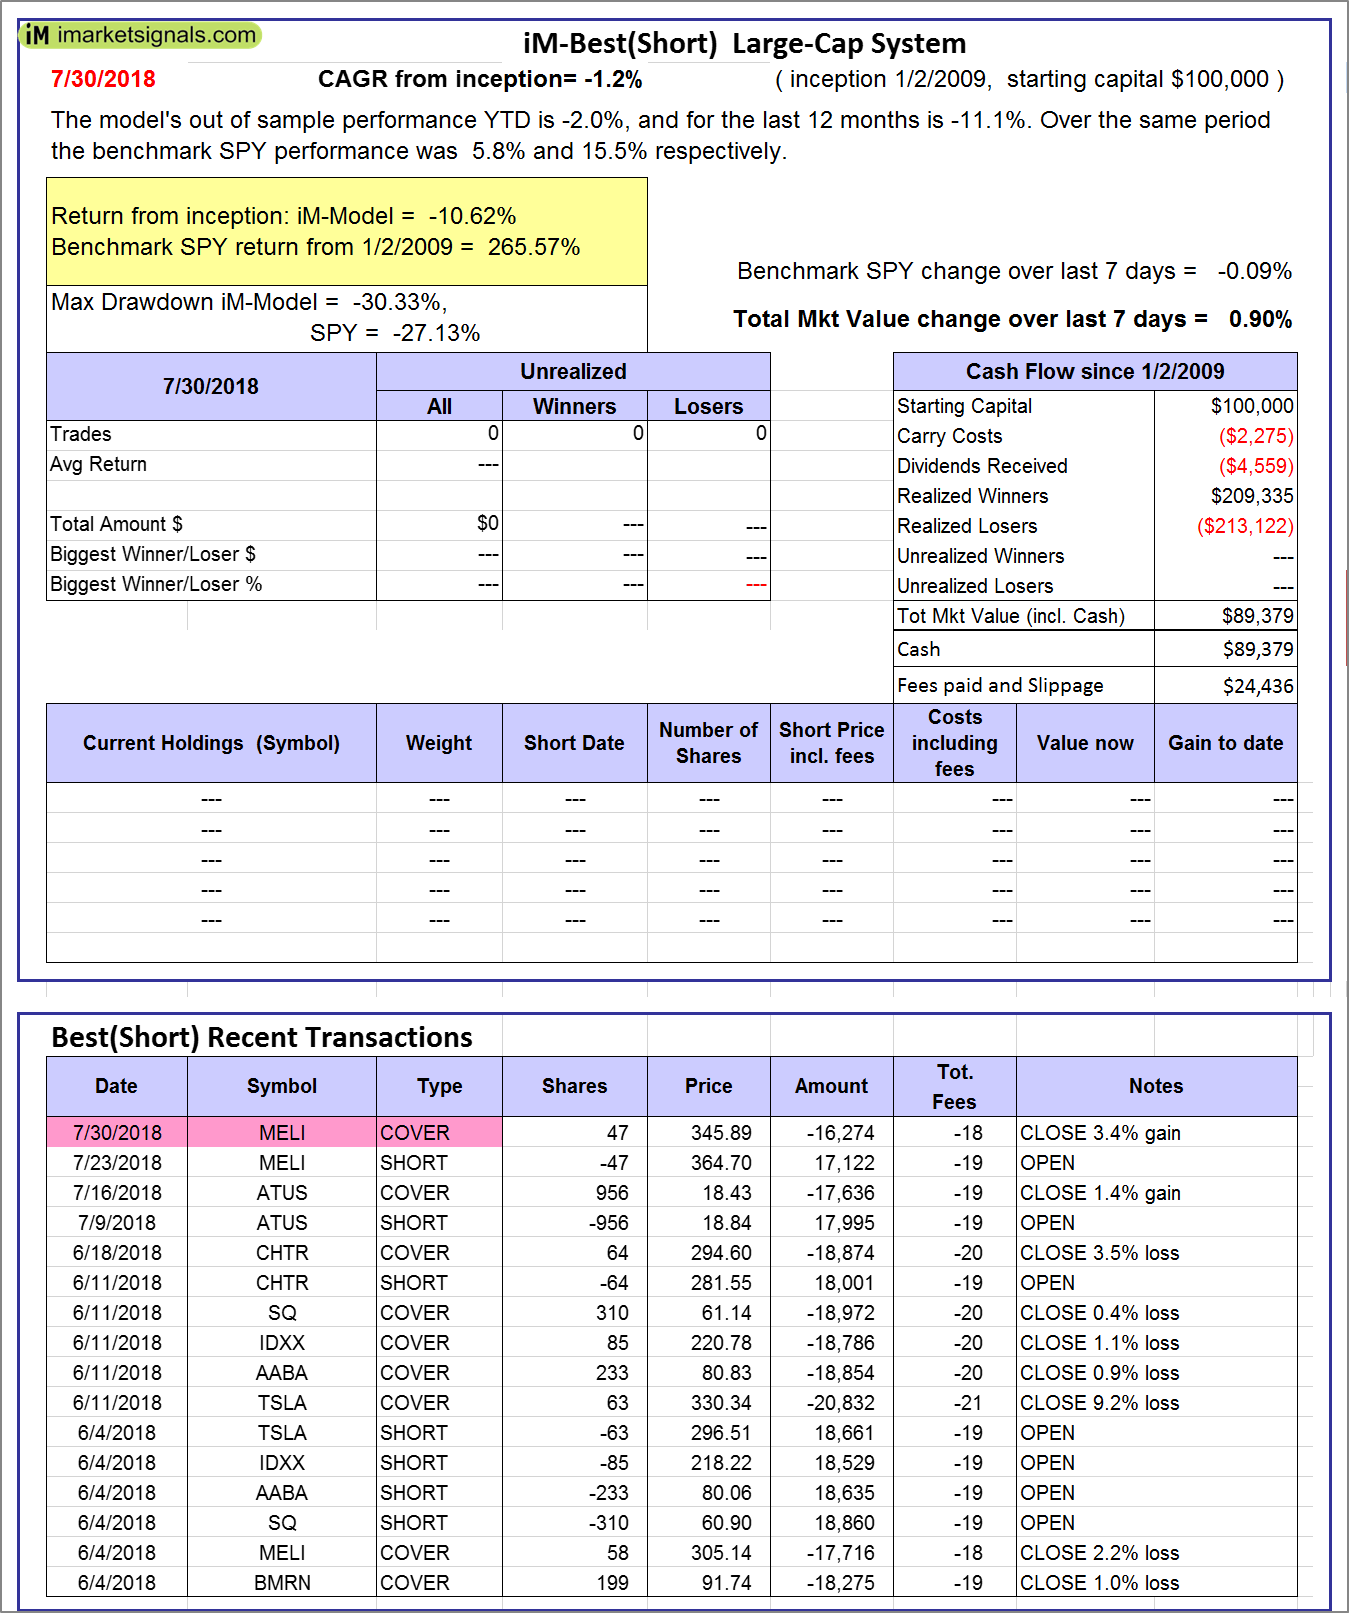 |
iM-Best(Short): The model’s out of sample performance YTD is -2.0%, and for the last 12 months is -11.1%. Over the same period the benchmark SPY performance was 5.8% and 15.5% respectively. Over the previous week the market value of iM-Best(Short) gained 0.90% at a time when SPY gained -0.09%. Over the period 1/2/2009 to 7/30/2018 the starting capital of $100,000 would have grown to $89,379 which includes $89,379 cash and excludes $24,436 spent on fees and slippage. |
 |
iM-Best2 MC-Score ETF System: The model’s out of sample performance YTD is -0.5%, and for the last 12 months is 5.1%. Over the same period the benchmark SPY performance was 5.8% and 15.5% respectively. Over the previous week the market value of the iM-Best2 MC-Score ETF System gained 0.72% at a time when SPY gained -0.09%. A starting capital of $100,000 at inception on 6/30/2016 would have grown to $111,825 which includes $1,980 cash and excludes $115 spent on fees and slippage. |
 |
iM-Best4 MC-Score Vanguard System: The model’s out of sample performance YTD is -0.3%, and for the last 12 months is 3.3%. Over the same period the benchmark SPY performance was 5.8% and 15.5% respectively. Over the previous week the market value of the iM-Best4 MC-Score Vanguard System gained 0.44% at a time when SPY gained -0.09%. A starting capital of $100,000 at inception on 6/30/2016 would have grown to $110,568 which includes $4,783 cash and excludes $00 spent on fees and slippage. |
 |
iM-Composite (SH-RSP) Timer: The model’s out of sample performance YTD is 4.0%, and for the last 12 months is 12.5%. Over the same period the benchmark SPY performance was 5.8% and 15.5% respectively. Over the previous week the market value of the iM-Composite (SH-RSP) Timer gained 0.16% at a time when SPY gained -0.09%. A starting capital of $100,000 at inception on 6/30/2016 would have grown to $135,214 which includes $3,223 cash and excludes $513 spent on fees and slippage. |
 |
iM-Composite (SPY-IEF) Timer: The model’s out of sample performance YTD is 5.7%, and for the last 12 months is 15.9%. Over the same period the benchmark SPY performance was 5.8% and 15.5% respectively. Over the previous week the market value of the iM-Composite (SPY-IEF) Timer gained -0.09% at a time when SPY gained -0.09%. A starting capital of $100,000 at inception on 6/30/2016 would have grown to $140,338 which includes $2,042 cash and excludes $1,390 spent on fees and slippage. |
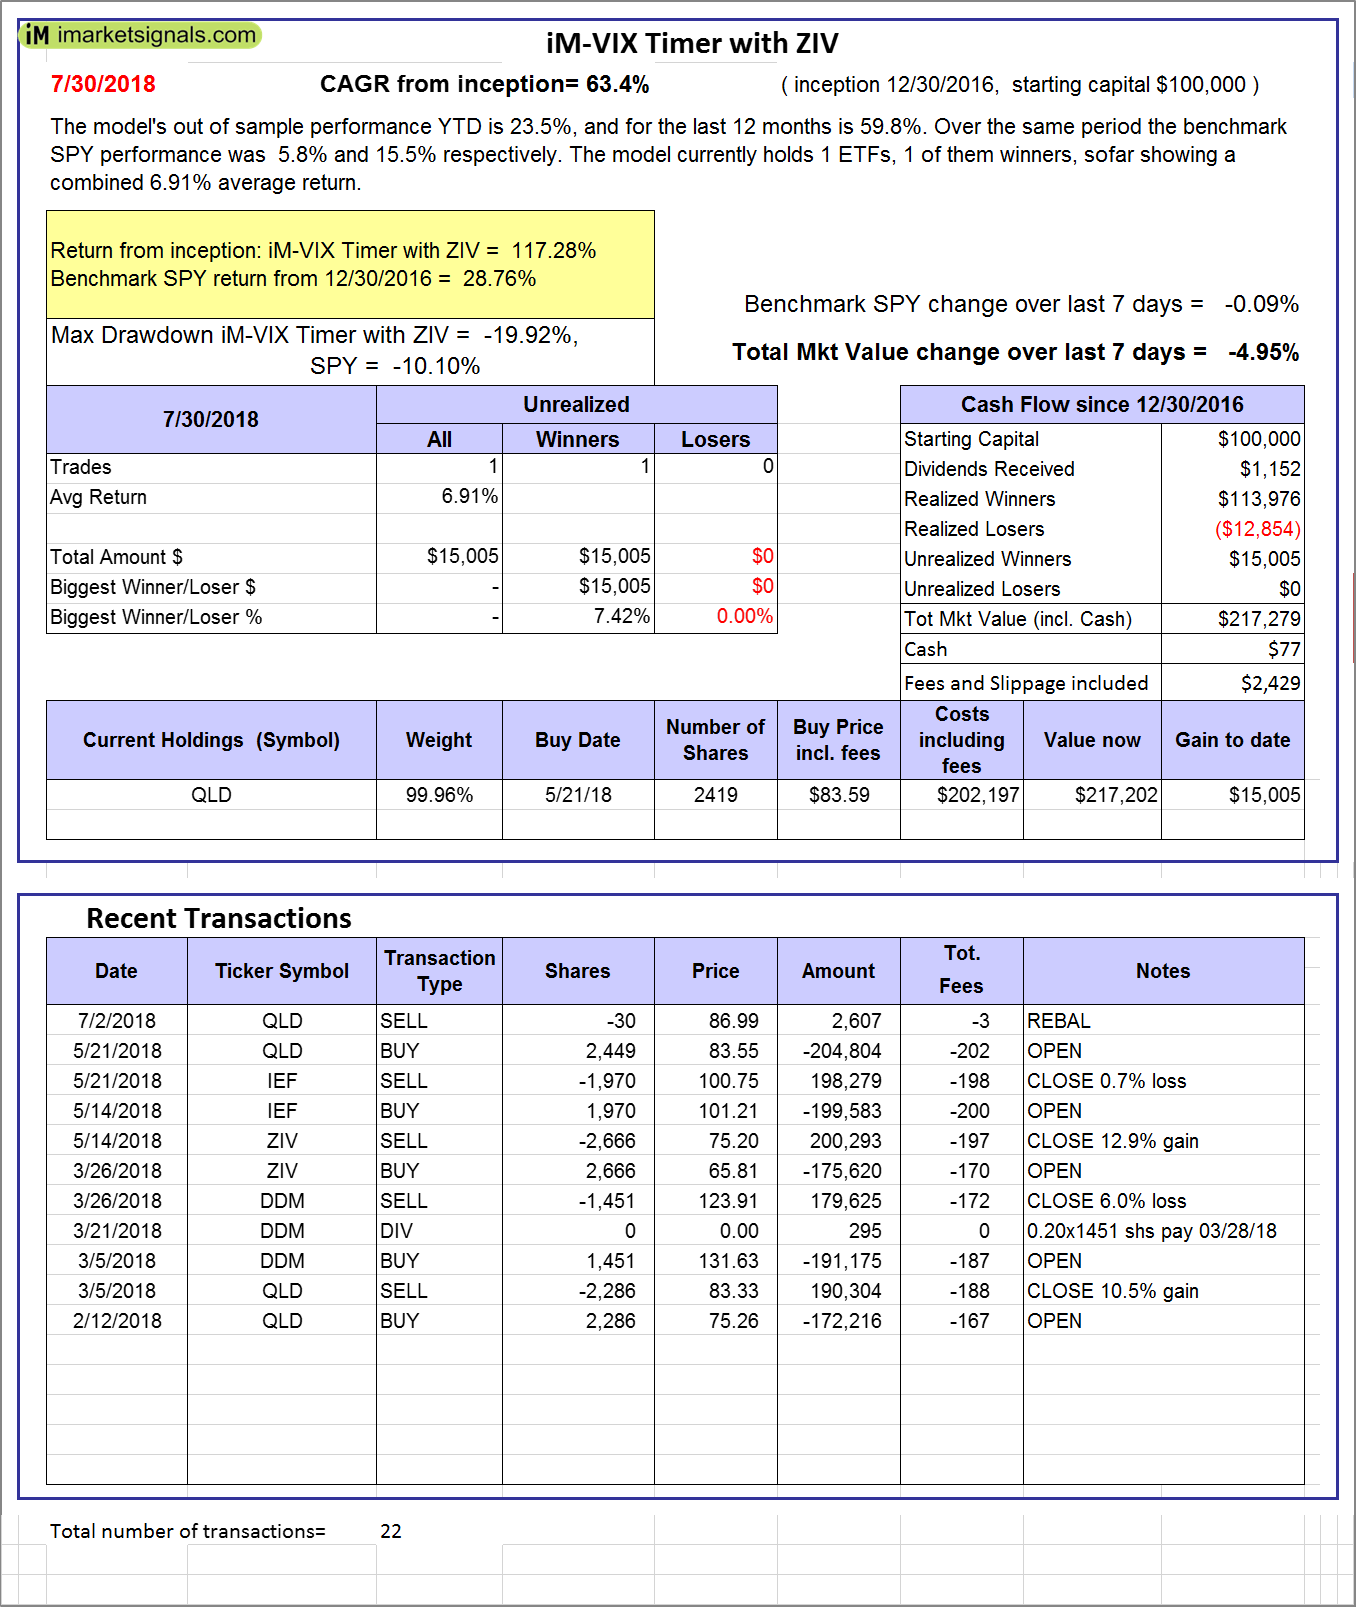 |
iM-VIX Timer with ZIV: The model’s out of sample performance YTD is 23.5%, and for the last 12 months is 59.8%. Over the same period the benchmark SPY performance was 5.8% and 15.5% respectively. Over the previous week the market value of the iM-VIX Timer with ZIV gained -4.95% at a time when SPY gained -0.09%. A starting capital of $100,000 at inception on 6/30/2016 would have grown to $217,279 which includes $77 cash and excludes $2,429 spent on fees and slippage. |
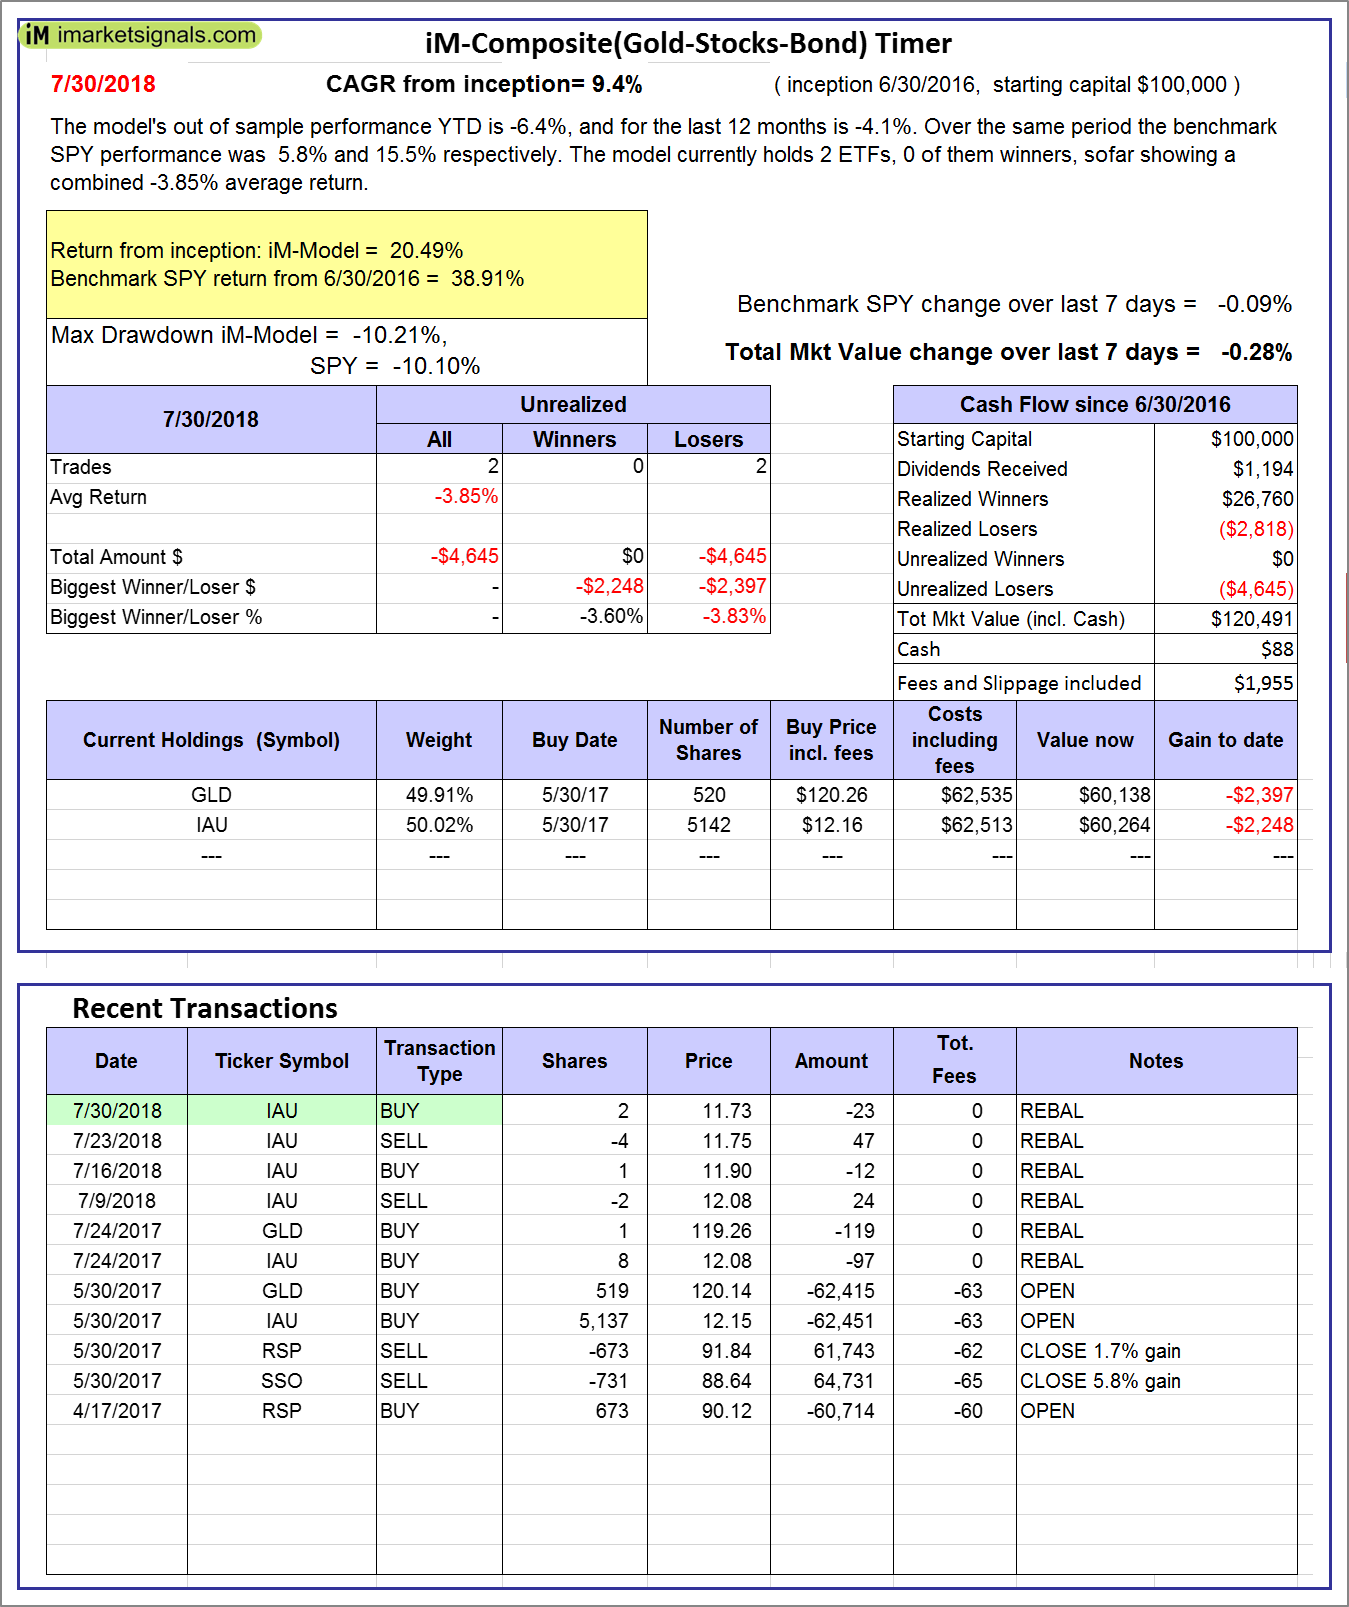 |
iM-Composite(Gold-Stocks-Bond) Timer: The model’s out of sample performance YTD is -6.4%, and for the last 12 months is -4.1%. Over the same period the benchmark SPY performance was 5.8% and 15.5% respectively. Over the previous week the market value of the iM-Composite(Gold-Stocks-Bond) Timer gained -0.28% at a time when SPY gained -0.09%. A starting capital of $100,000 at inception on 6/30/2016 would have grown to $120,491 which includes $88 cash and excludes $1,955 spent on fees and slippage. |
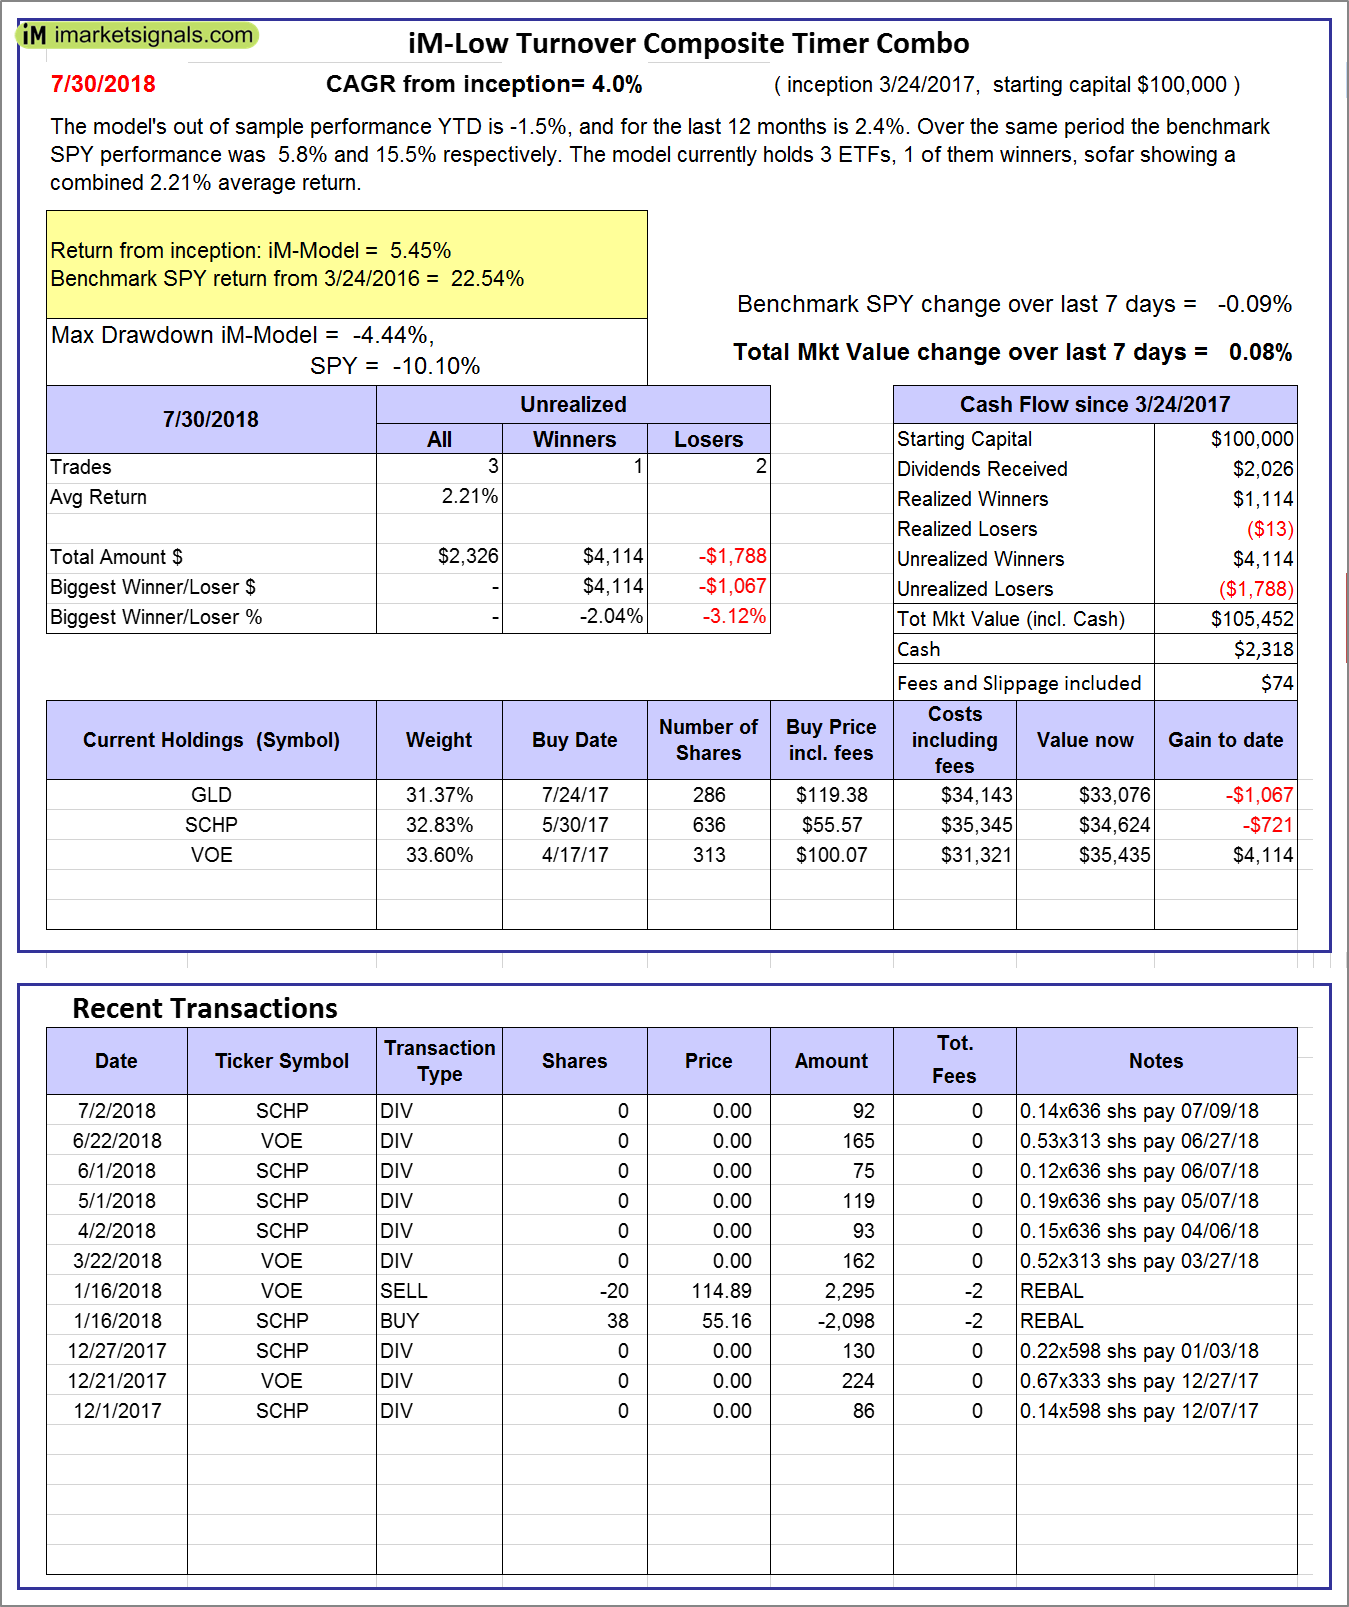 |
iM-Low Turnover Composite Timer Combo: The model’s out of sample performance YTD is -1.5%, and for the last 12 months is 2.4%. Over the same period the benchmark SPY performance was 5.8% and 15.5% respectively. Over the previous week the market value of the iM-Low Turnover Composite Timer Combo gained 0.08% at a time when SPY gained -0.09%. A starting capital of $100,000 at inception on 3/24/27 would have grown to $105,452 which includes $2,318 cash and excludes $74 spent on fees and slippage. |
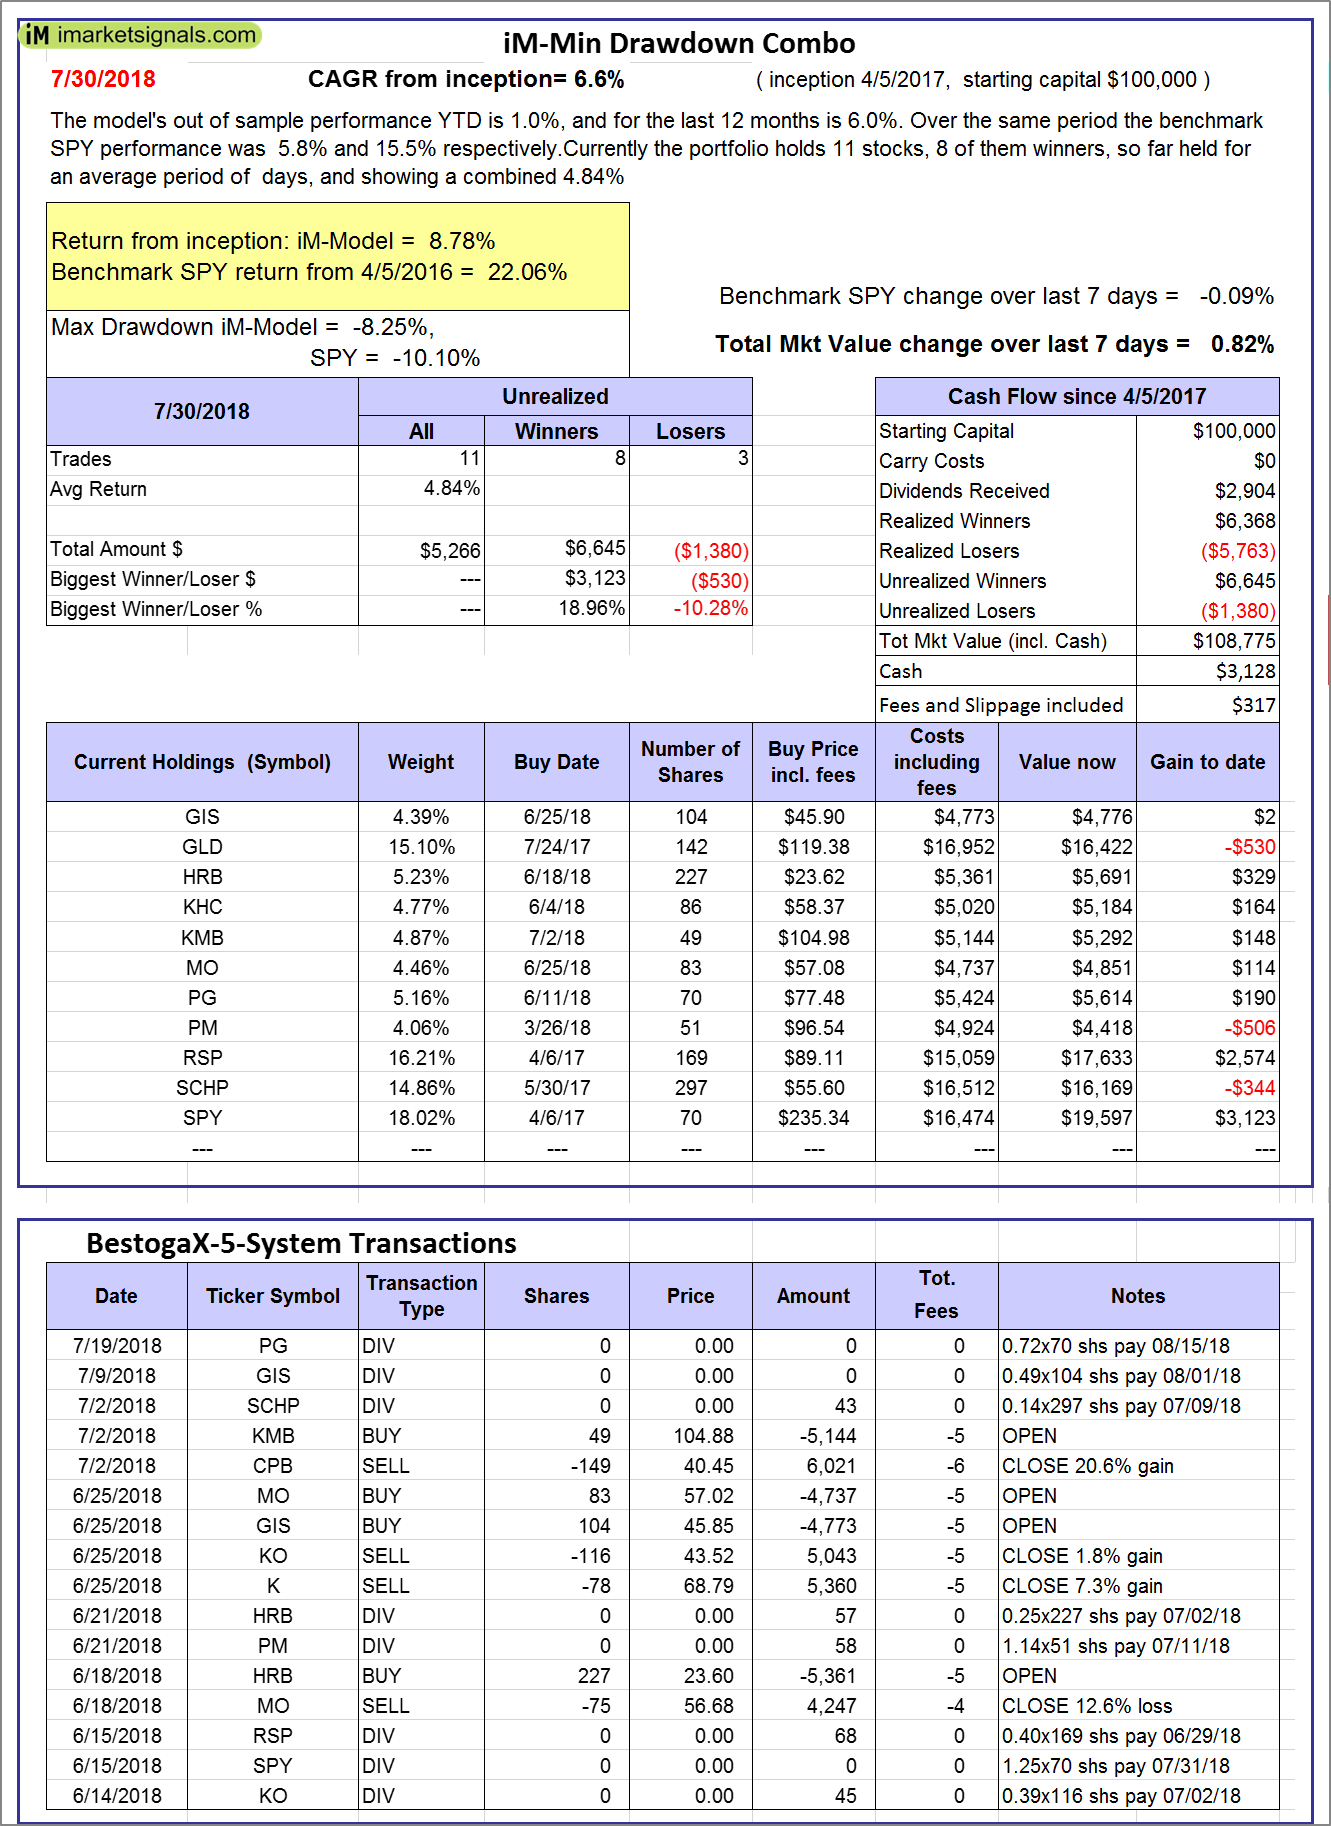 |
iM-Min Drawdown Combo: The model’s out of sample performance YTD is 1.0%, and for the last 12 months is 6.0%. Over the same period the benchmark SPY performance was 5.8% and 15.5% respectively. Over the previous week the market value of the iM-Min Drawdown Combo gained 0.82% at a time when SPY gained -0.09%. A starting capital of $100,000 at inception on 4/5/2017 would have grown to $108,775 which includes $3,128 cash and excludes $317 spent on fees and slippage. |
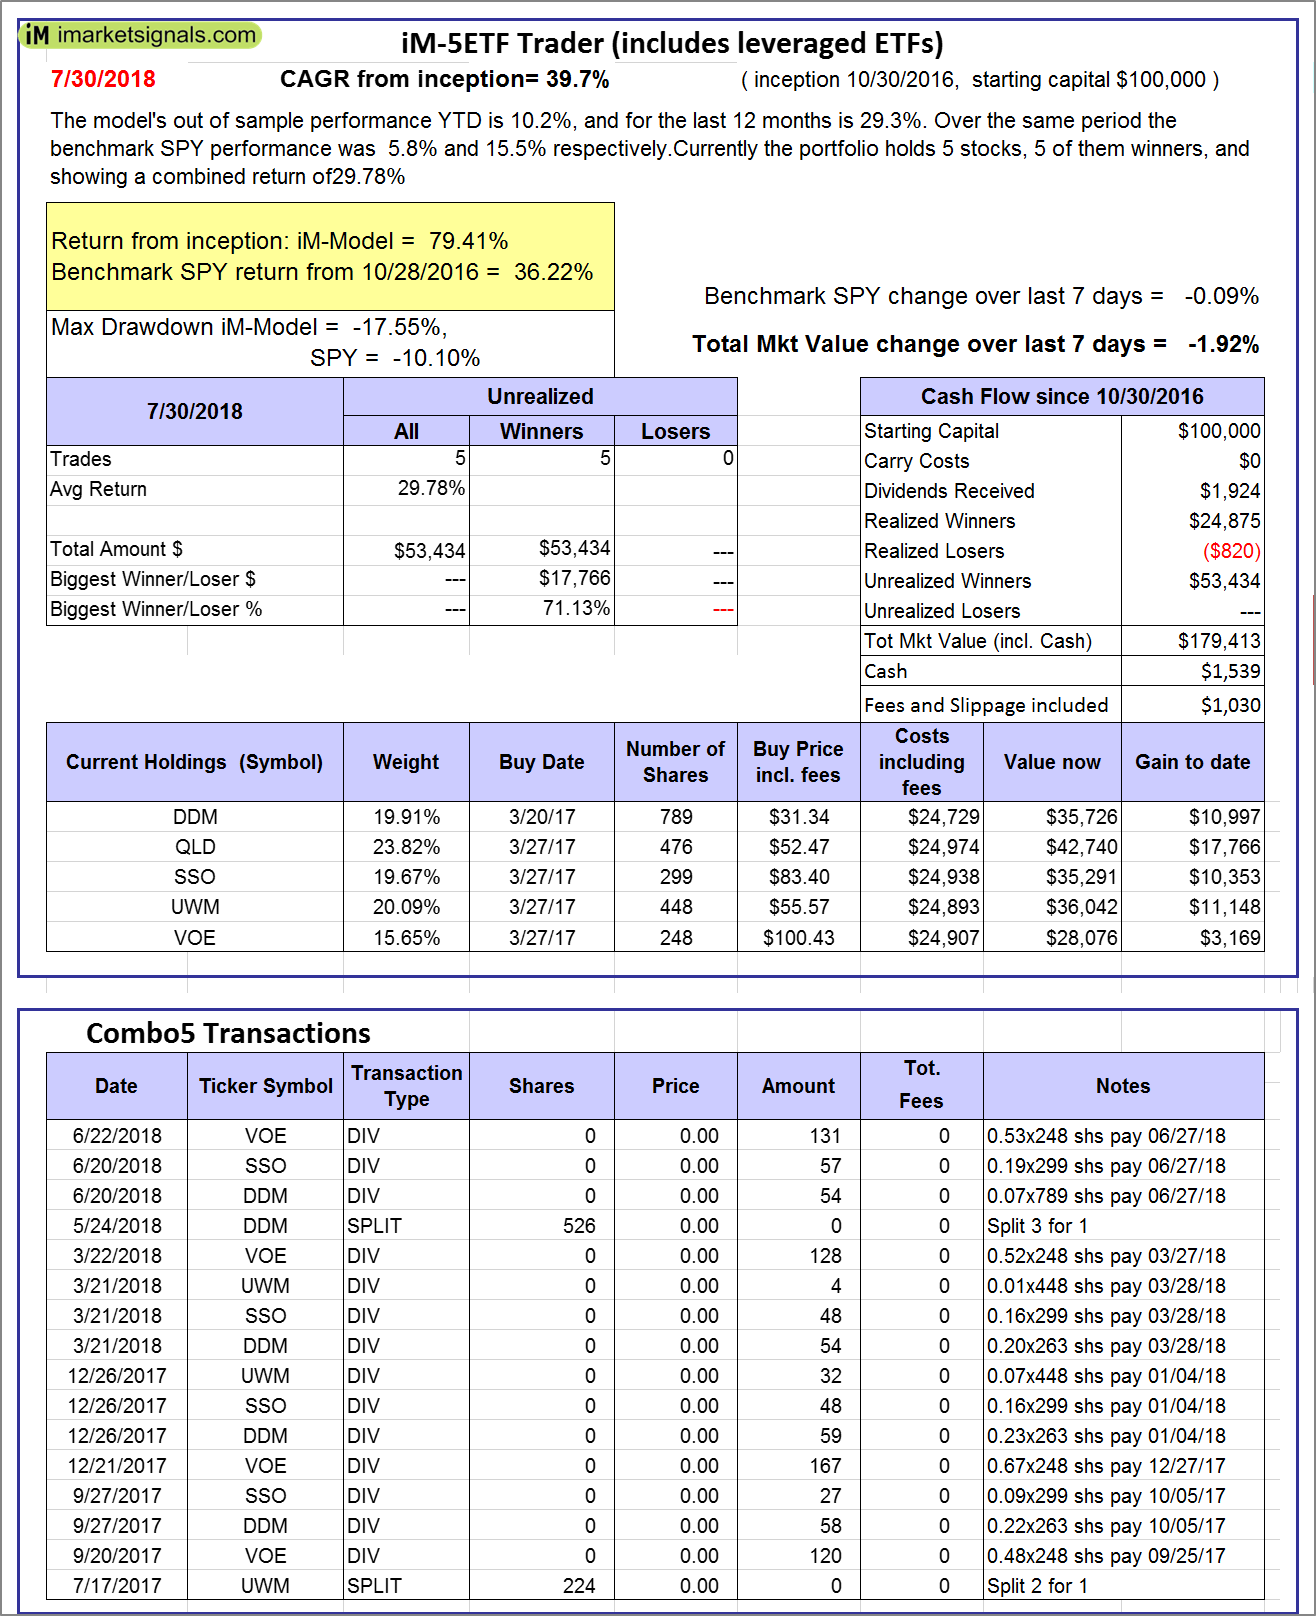 |
iM-5ETF Trader (includes leveraged ETFs): The model’s out of sample performance YTD is 10.2%, and for the last 12 months is 29.3%. Over the same period the benchmark SPY performance was 5.8% and 15.5% respectively. Over the previous week the market value of the iM-5ETF Trader (includes leveraged ETFs) gained -1.92% at a time when SPY gained -0.09%. A starting capital of $100,000 at inception on 10/30/2016 would have grown to $179,413 which includes $1,539 cash and excludes $1,030 spent on fees and slippage. |
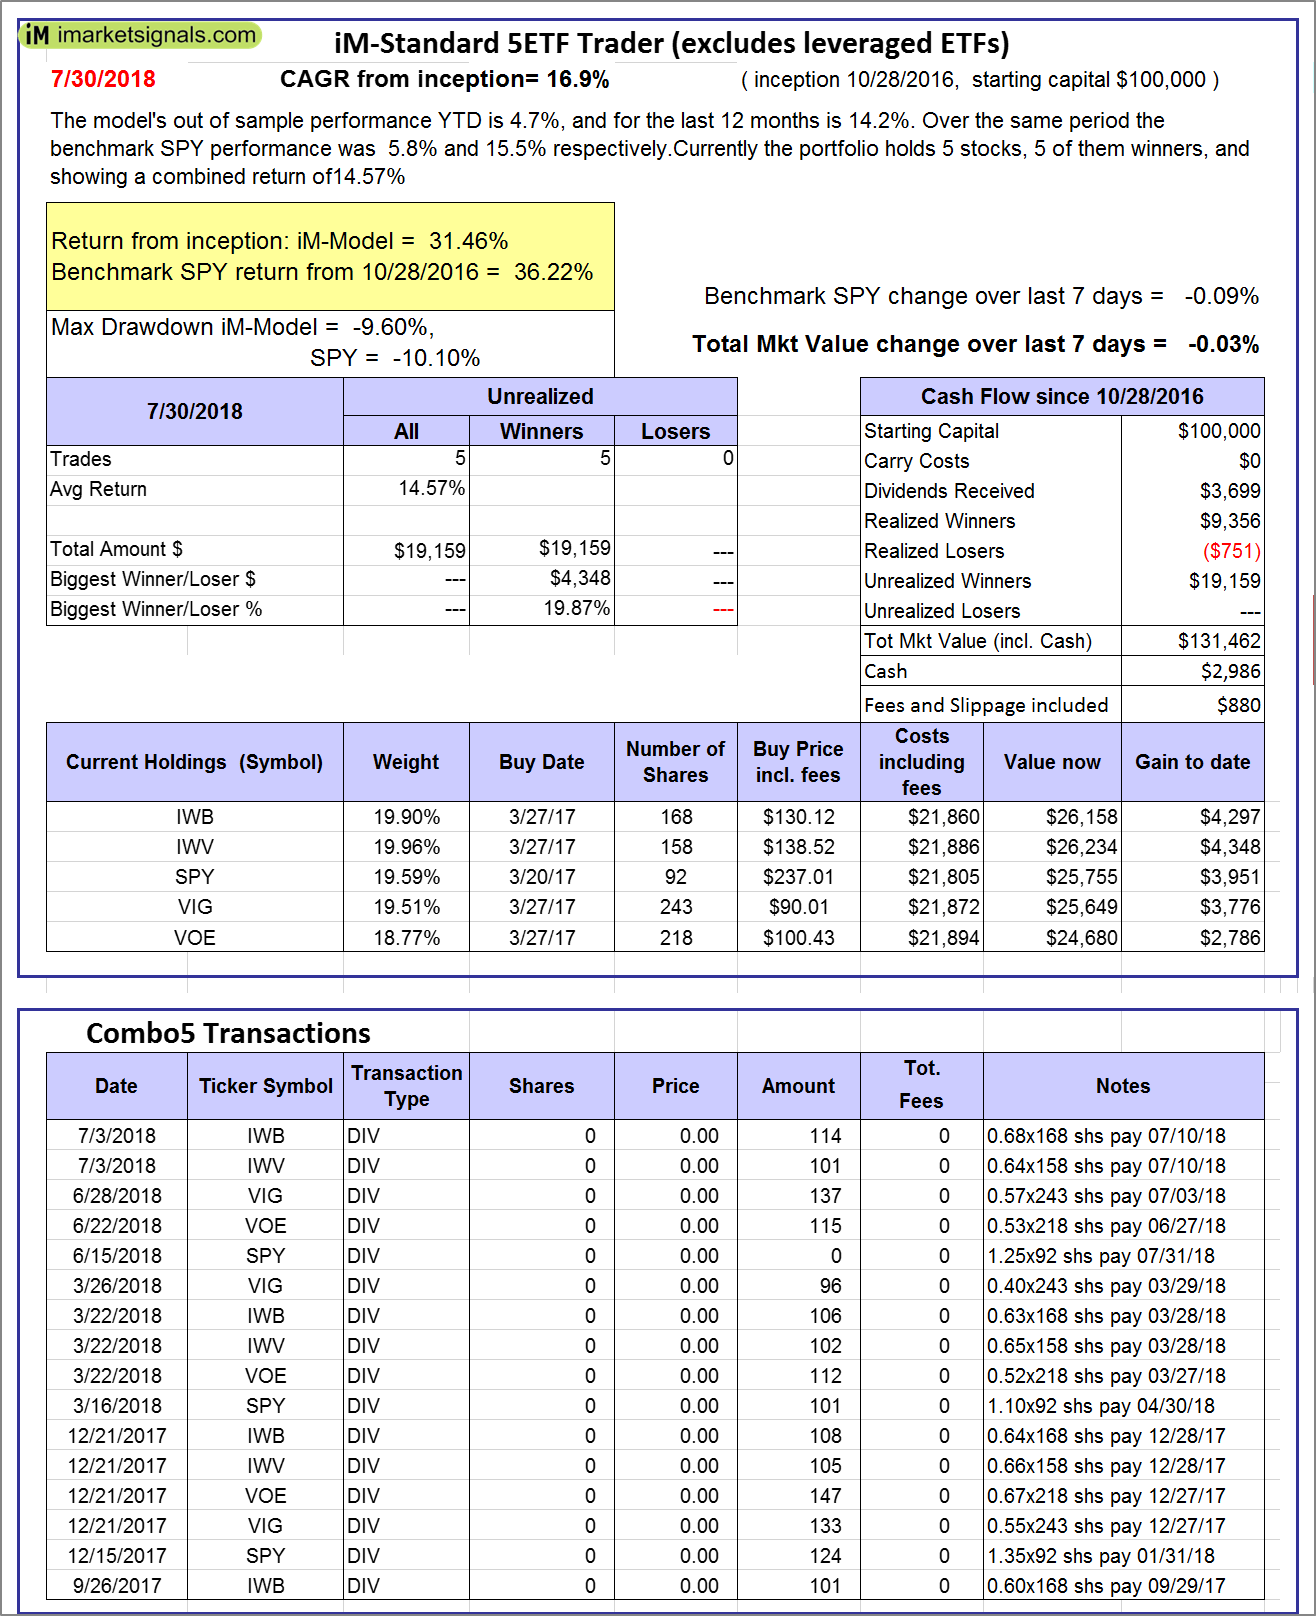 |
iM-Standard 5ETF Trader (excludes leveraged ETFs): The model’s out of sample performance YTD is 4.7%, and for the last 12 months is 14.2%. Over the same period the benchmark SPY performance was 5.8% and 15.5% respectively. Over the previous week the market value of the iM-Standard 5ETF Trader (excludes leveraged ETFs) gained -0.03% at a time when SPY gained -0.09%. A starting capital of $100,000 at inception on 10/30/2016 would have grown to $131,462 which includes $2,986 cash and excludes $880 spent on fees and slippage. |
Posted in pmp SPY-SH
With reference to Section 202(a)(11)(D) of the Investment Advisers Act:
We are Engineers and not Investment Advisers,
read more ...
By the mere act of reading this page and navigating this site you acknowledge, agree to, and abide by the
Terms of Use / Disclaimer