  |
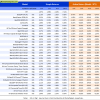
Out of sample performance summary of our models for the past 1, 2, 4 and 13 week periods. The active active return indicates how the models over- or underperformed the benchmark ETF SPY. Also the YTD, and the 1-, 3-, 5- and 10-year annualized returns are shown in the second table |
|
|
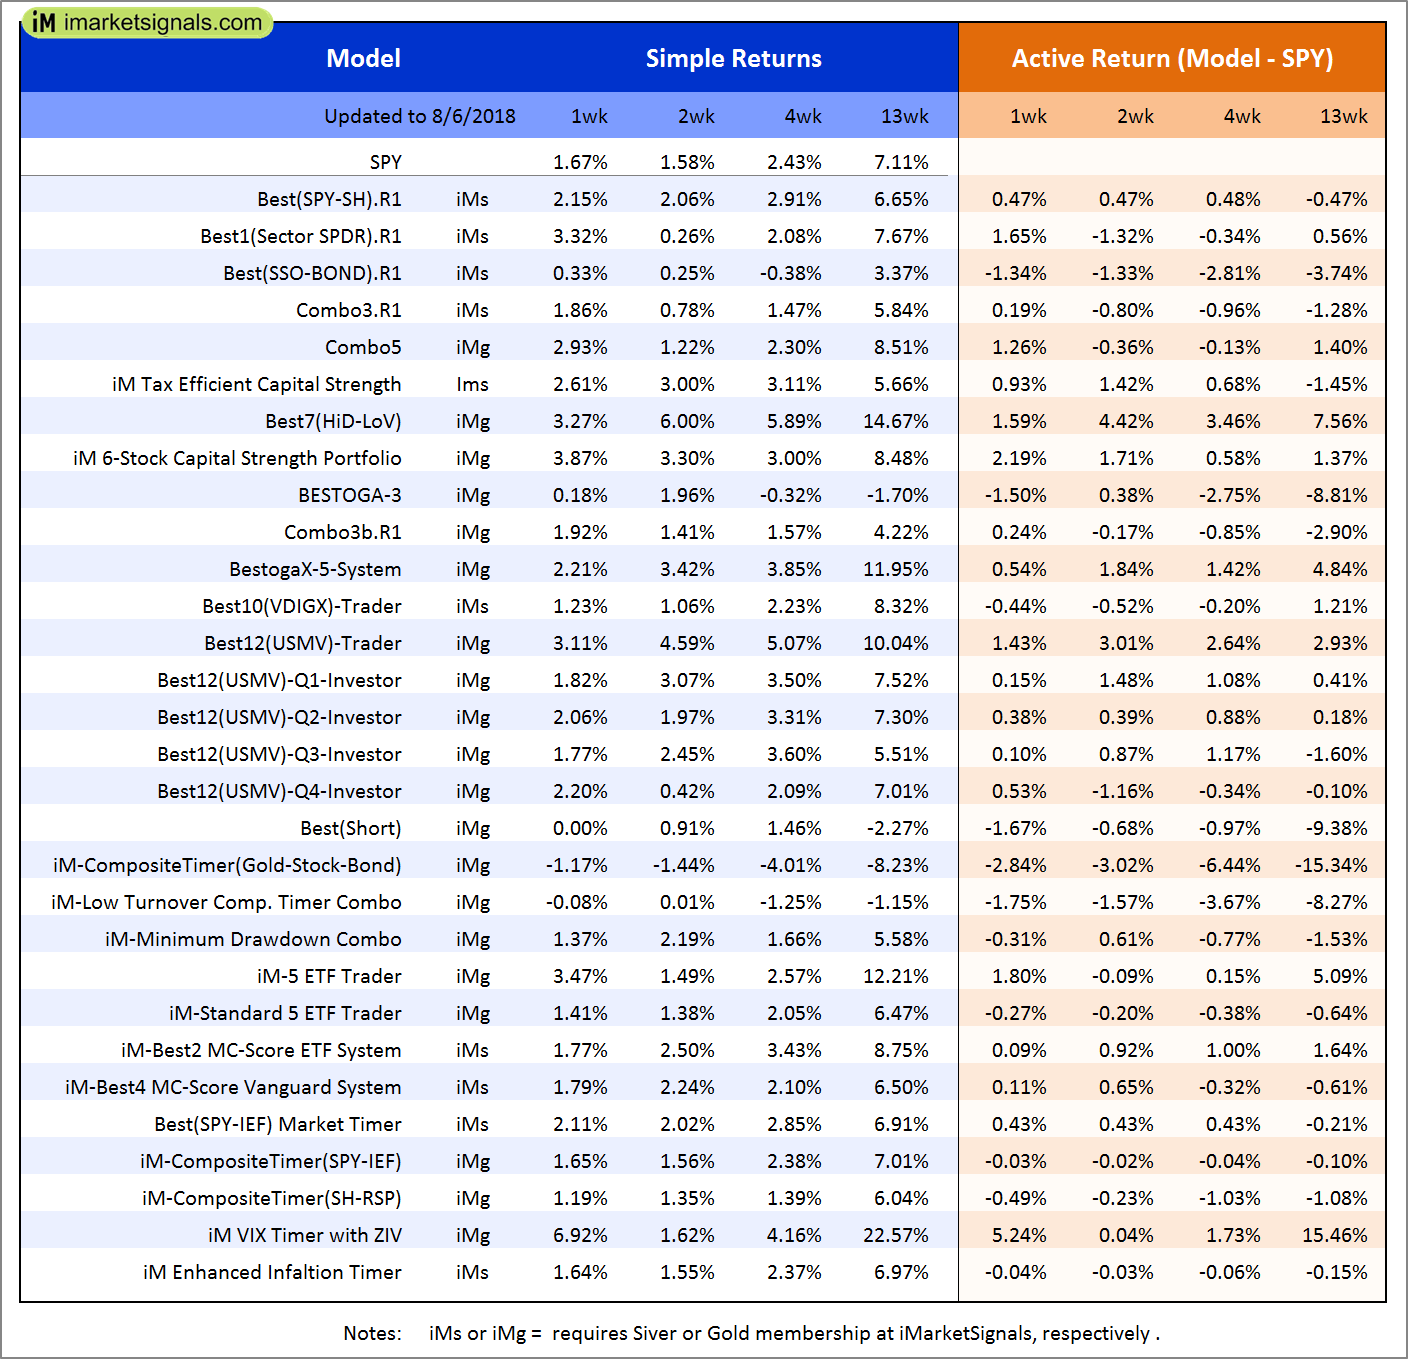
iM-Best(SPY-SH).R1: The model’s out of sample performance YTD is 7.1%, and for the last 12 months is 16.6%. Over the same period the benchmark SPY performance was 7.6% and 17.2% respectively. Over the previous week the market value of Best(SPY-SH) gained 1.69% at a time when SPY gained 1.68%. A starting capital of $100,000 at inception on 1/2/2009 would have grown to $605,343 which includes -$4,925 cash and excludes $17,694 spent on fees and slippage. |
|
|
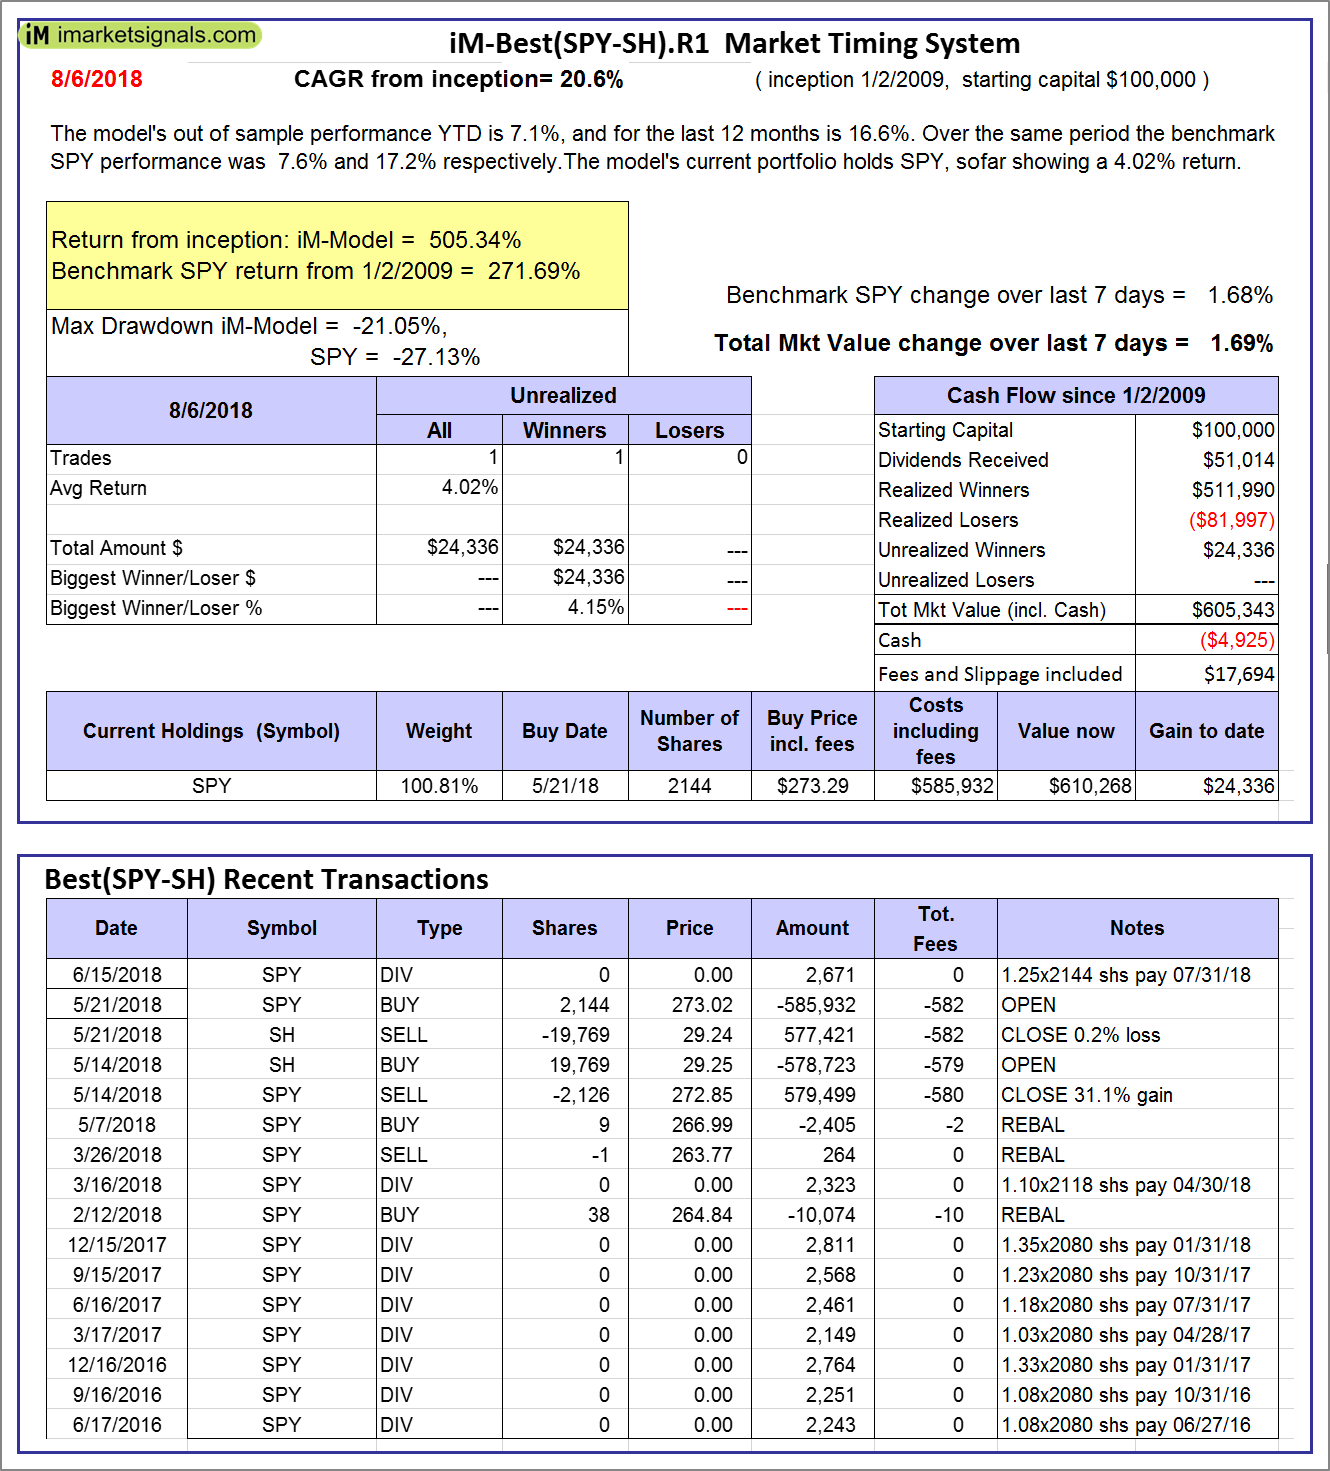
iM-Combo3.R1: The model’s out of sample performance YTD is 8.2%, and for the last 12 months is 22.0%. Over the same period the benchmark SPY performance was 7.6% and 17.2% respectively. Over the previous week the market value of iM-Combo3.R1 gained 1.77% at a time when SPY gained 1.68%. A starting capital of $100,000 at inception on 2/3/2014 would have grown to $170,830 which includes -$1,759 cash and excludes $4,008 spent on fees and slippage. |
|
|
iM-Combo5: The model’s out of sample performance YTD is 10.4%, and for the last 12 months is 24.7%. Over the same period the benchmark SPY performance was 7.6% and 17.2% respectively. Over the previous week the market value of iM-Combo5 gained 2.75% at a time when SPY gained 1.68%. A starting capital of $100,000 at inception on 2/22/2016 would have grown to $141,264 which includes $1,965 cash and excludes $983 spent on fees and slippage. |
|
|
iM-Best10(VDIGX)-Trader: The model’s out of sample performance YTD is 5.8%, and for the last 12 months is 14.2%. Over the same period the benchmark SPY performance was 7.6% and 17.2% respectively. Since inception, on 7/1/2014, the model gained 88.63% while the benchmark SPY gained 57.40% and VDIGX gained 49.50% over the same period. Over the previous week the market value of iM-Best10(VDIGX) gained 1.03% at a time when SPY gained 1.68%. A starting capital of $100,000 at inception on 7/1/2014 would have grown to $188,259 which includes $426 cash and excludes $2,343 spent on fees and slippage. |
|
|
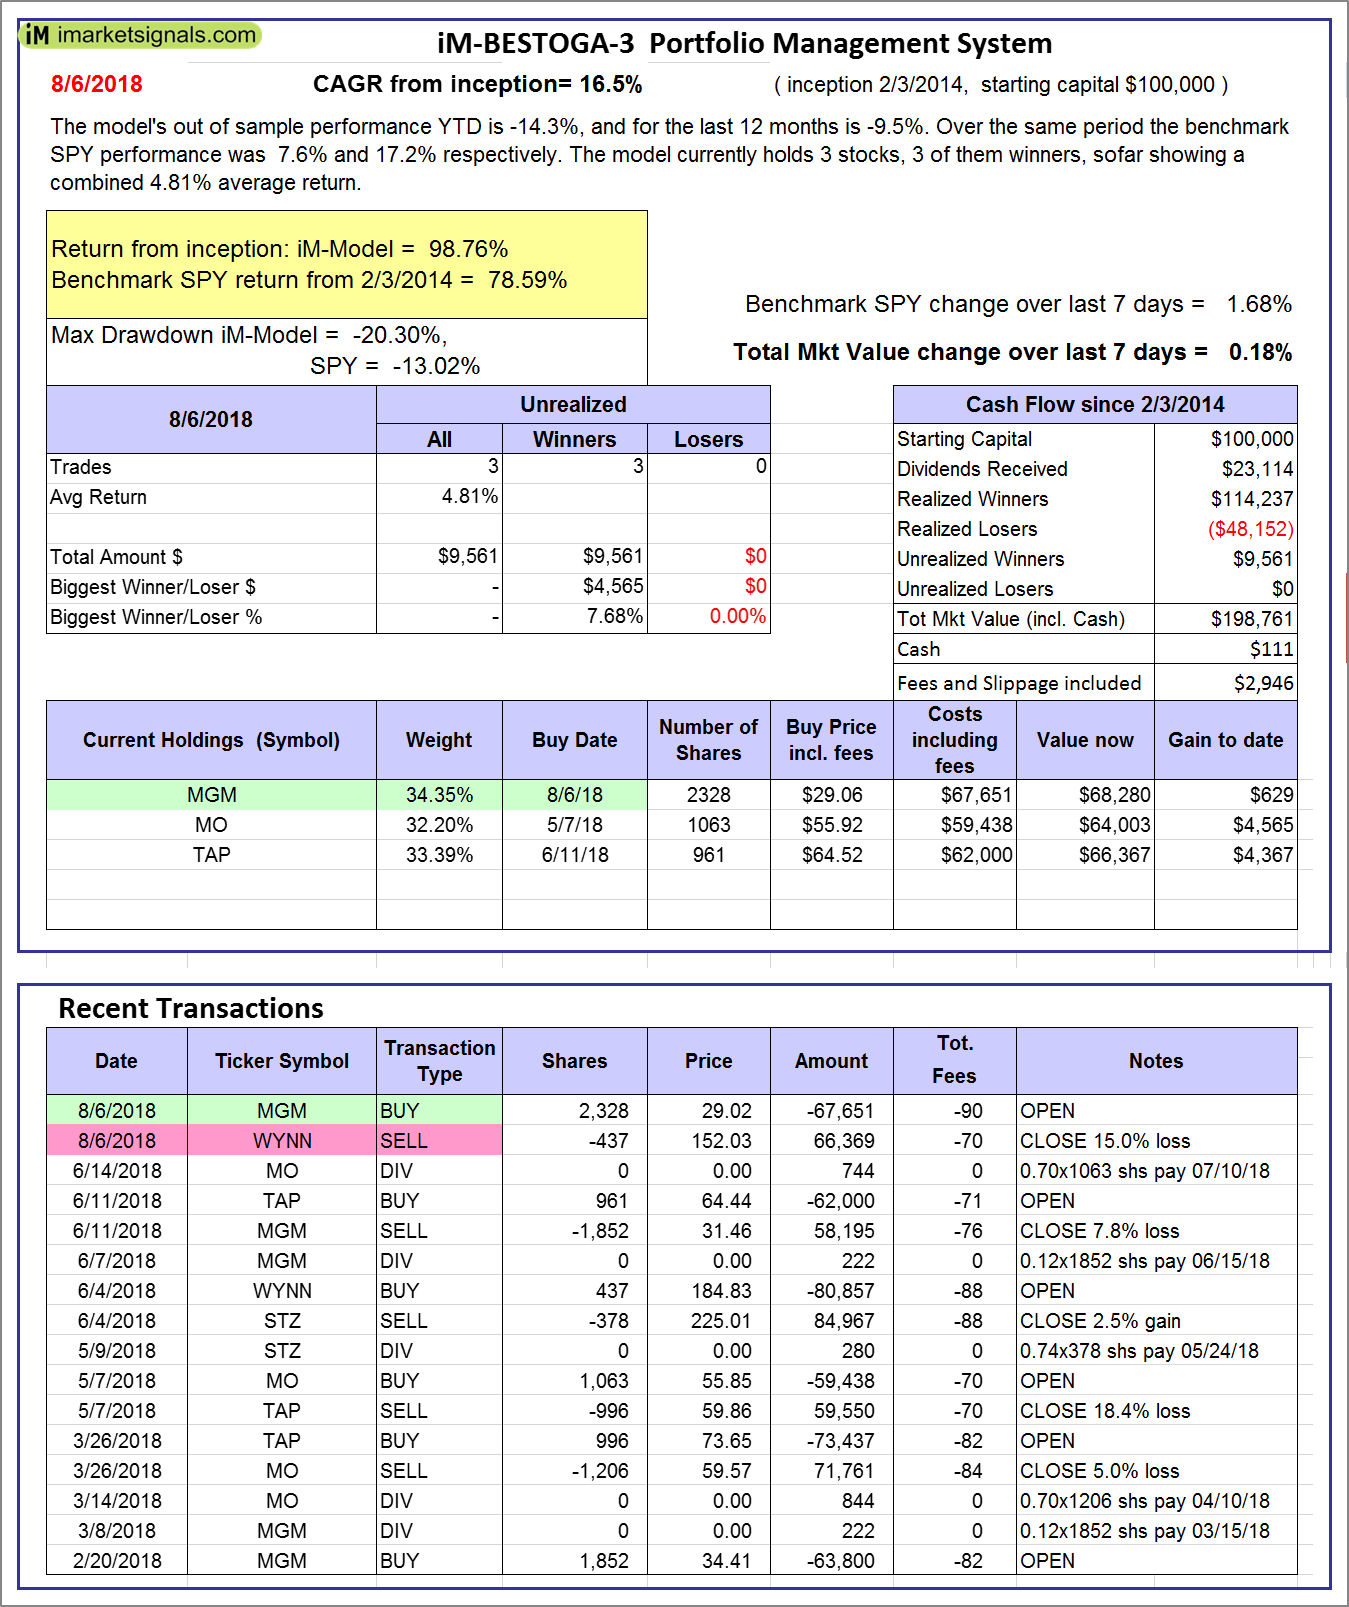
iM-BESTOGA-3: The model’s out of sample performance YTD is -14.3%, and for the last 12 months is -9.5%. Over the same period the benchmark SPY performance was 7.6% and 17.2% respectively. Over the previous week the market value of iM-BESTOGA-3 gained 0.18% at a time when SPY gained 1.68%. A starting capital of $100,000 at inception on 2/3/2014 would have grown to $198,761 which includes $111 cash and excludes $2,946 spent on fees and slippage. |
|
|
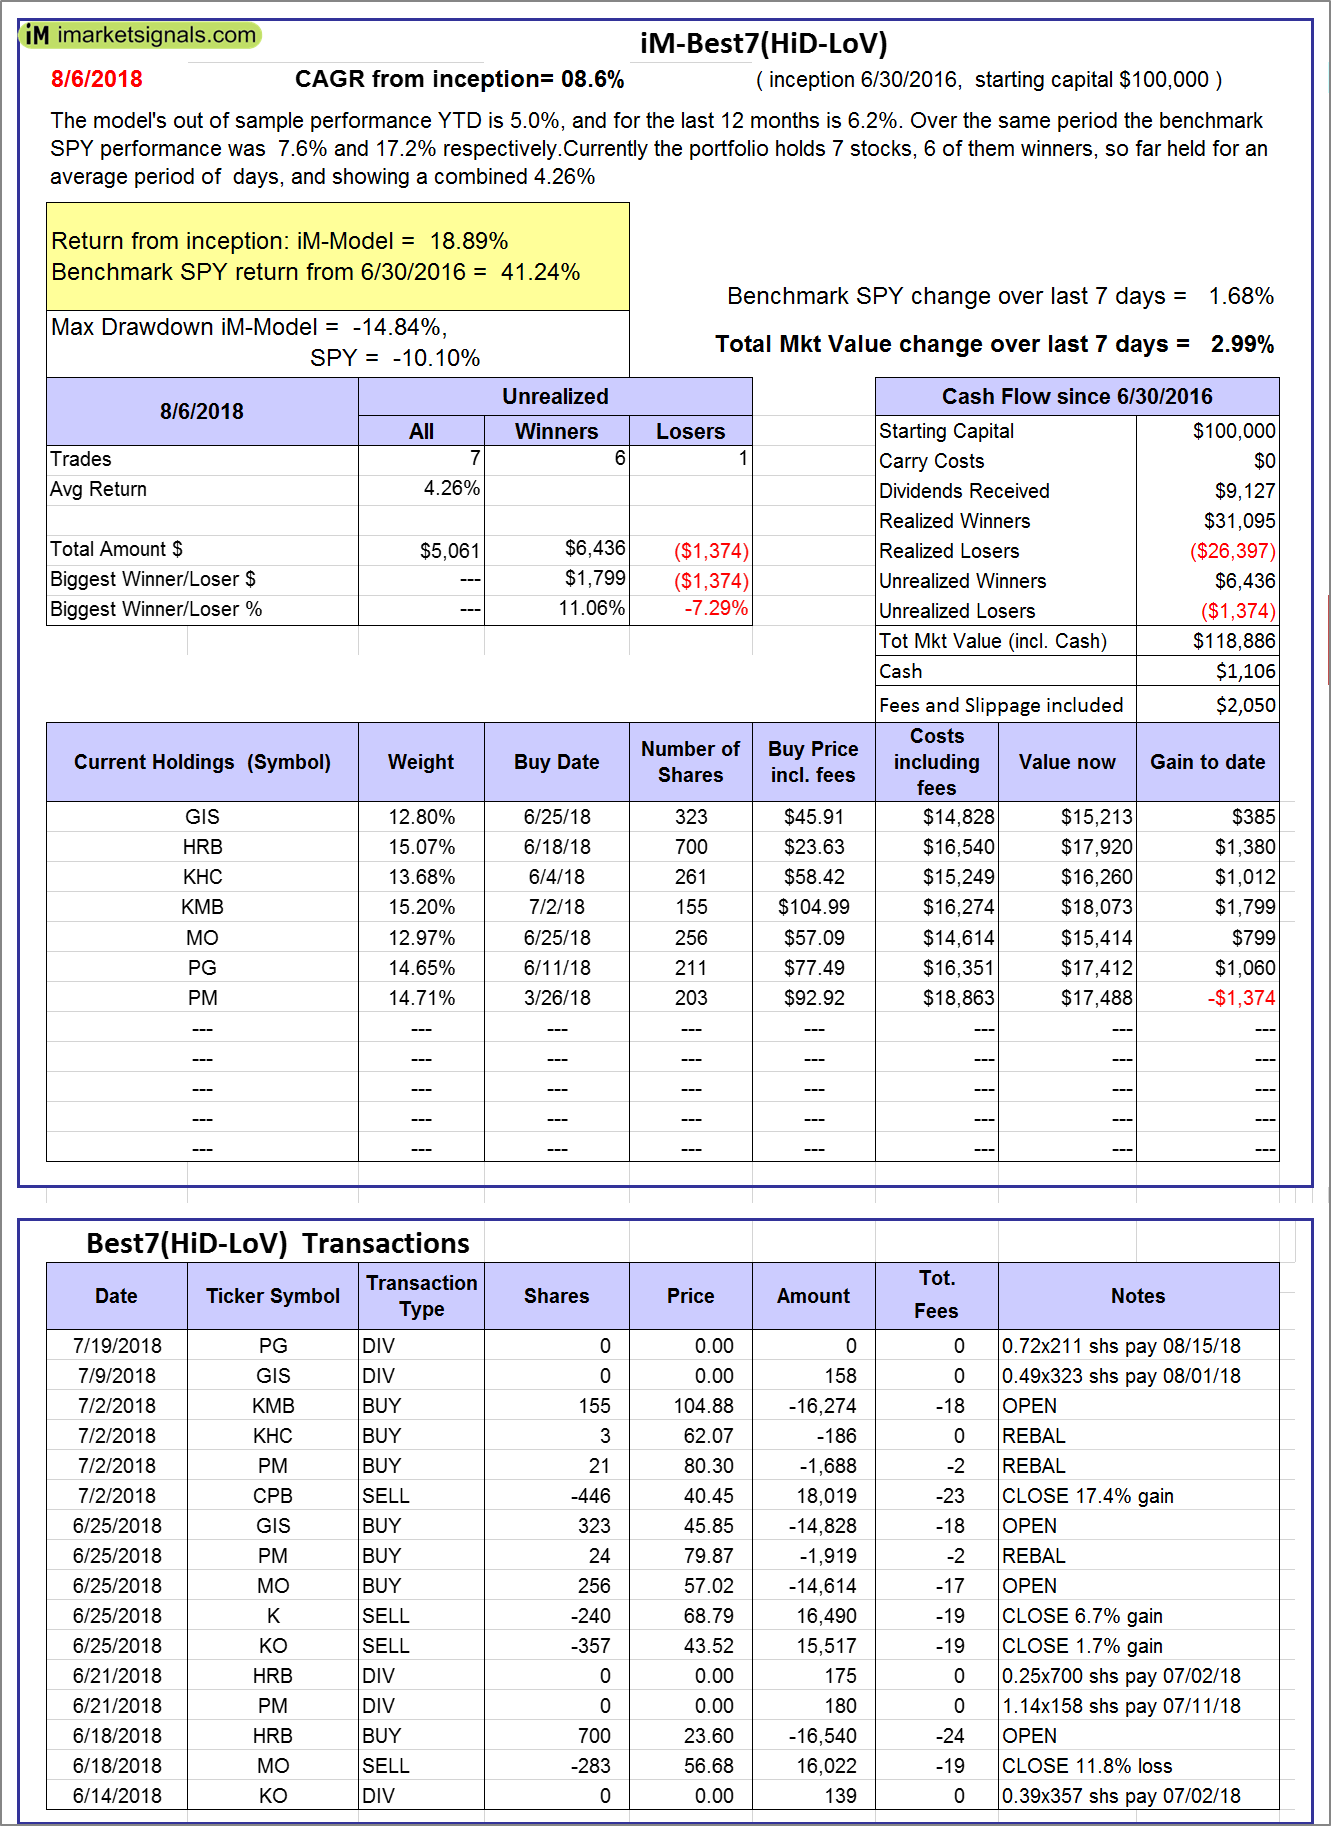
iM-Best7(HiD-LoV): The model’s out of sample performance YTD is 5.0%, and for the last 12 months is 6.2%. Over the same period the benchmark SPY performance was 7.6% and 17.2% respectively. Over the previous week the market value of iM-BESTOGA-3 gained 2.99% at a time when SPY gained 1.68%. A starting capital of $100,000 at inception on 6/30/2016 would have grown to $118,886 which includes $1,106 cash and excludes $2,050 spent on fees and slippage. |
|
|
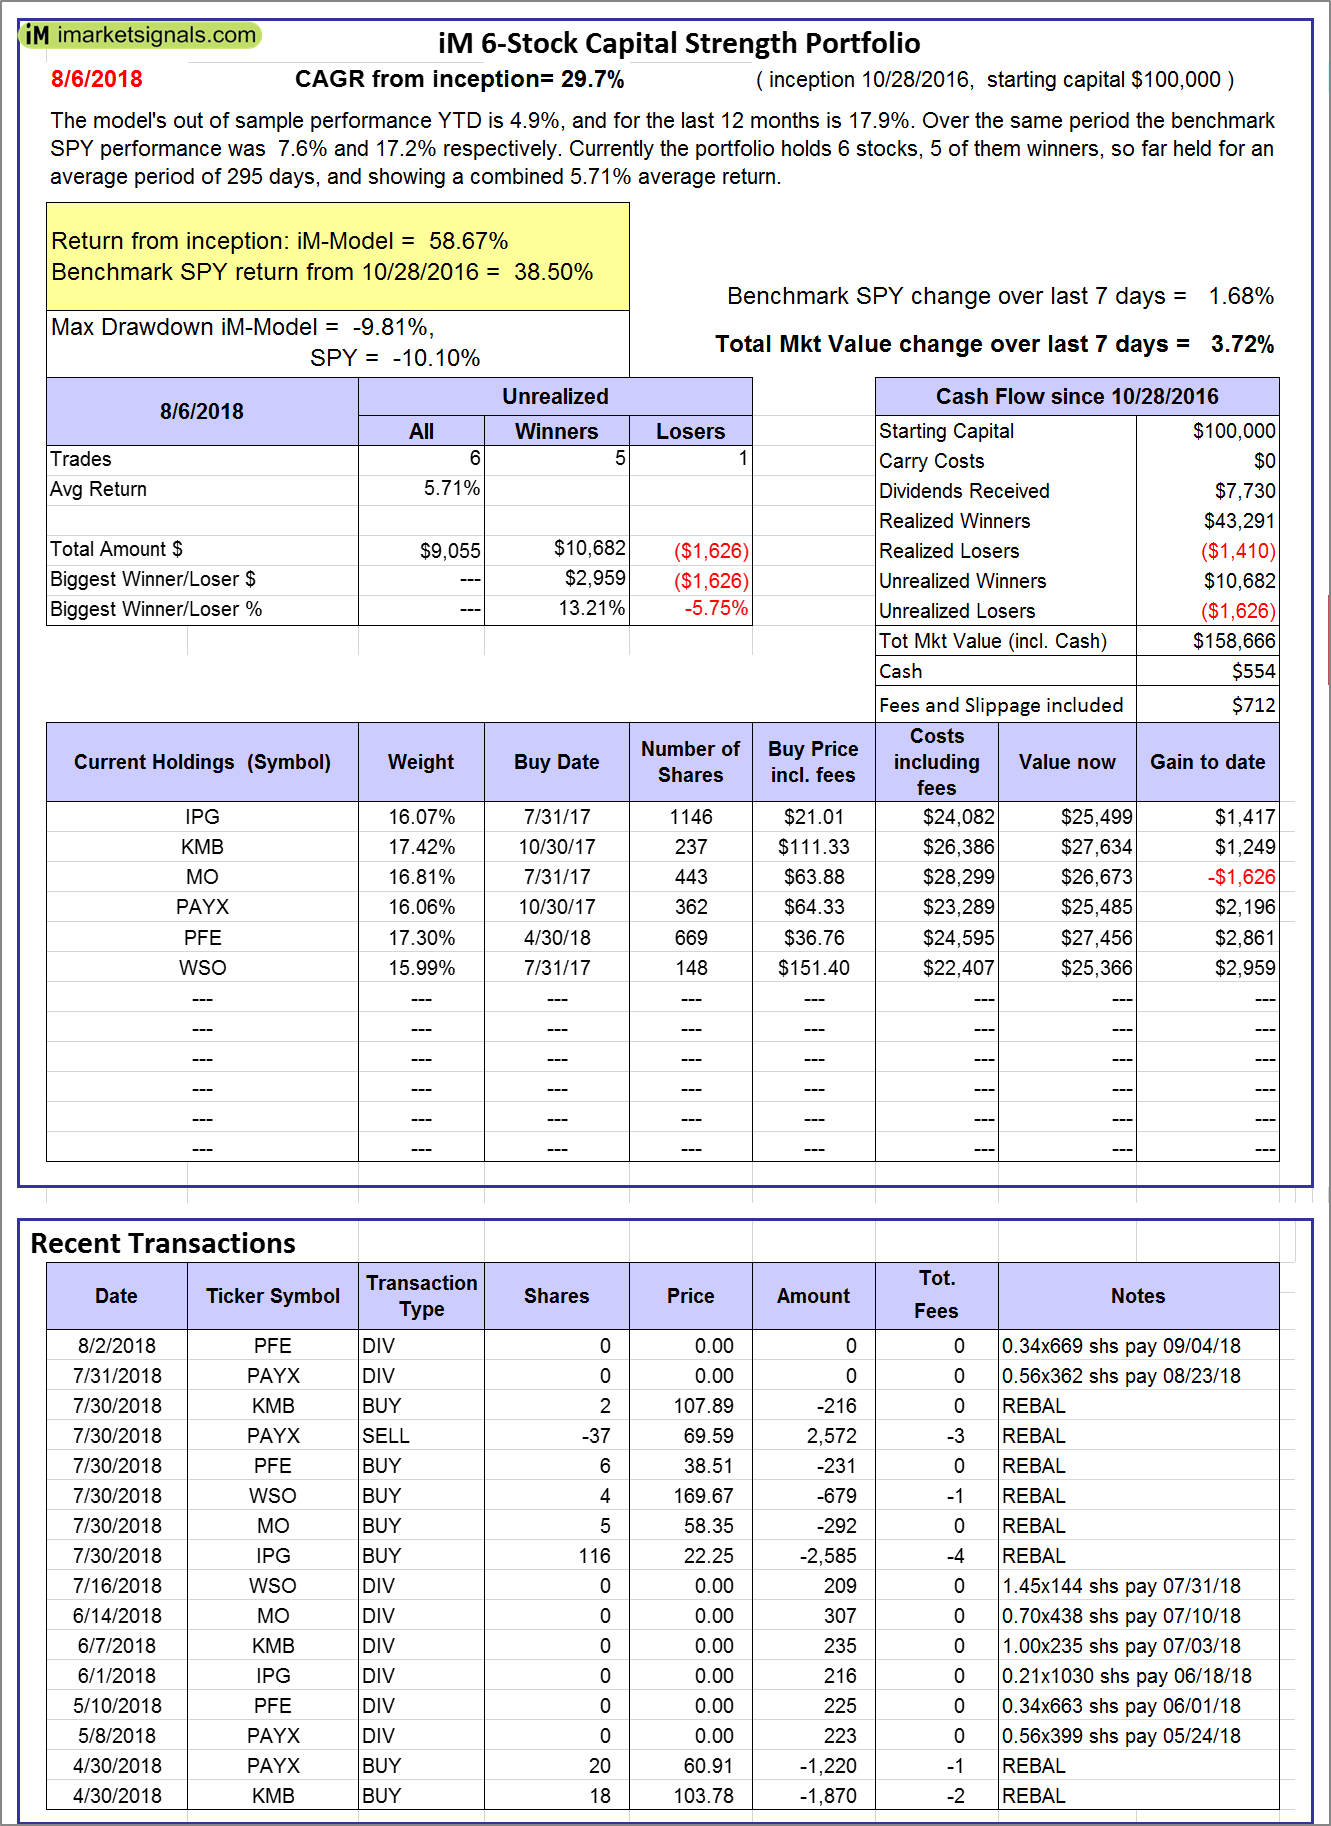
iM 6-Stock Capital Strength Portfolio: The model’s out of sample performance YTD is 4.9%, and for the last 12 months is 17.9%. Over the same period the benchmark SPY performance was 7.6% and 17.2% respectively. Over the previous week the market value of the iM 6-Stock Capital Strength Portfolio gained 3.72% at a time when SPY gained 1.68%. A starting capital of $100,000 at inception on 10/28/2016 would have grown to $158,666 which includes $554 cash and excludes $712 spent on fees and slippage. |
|
|
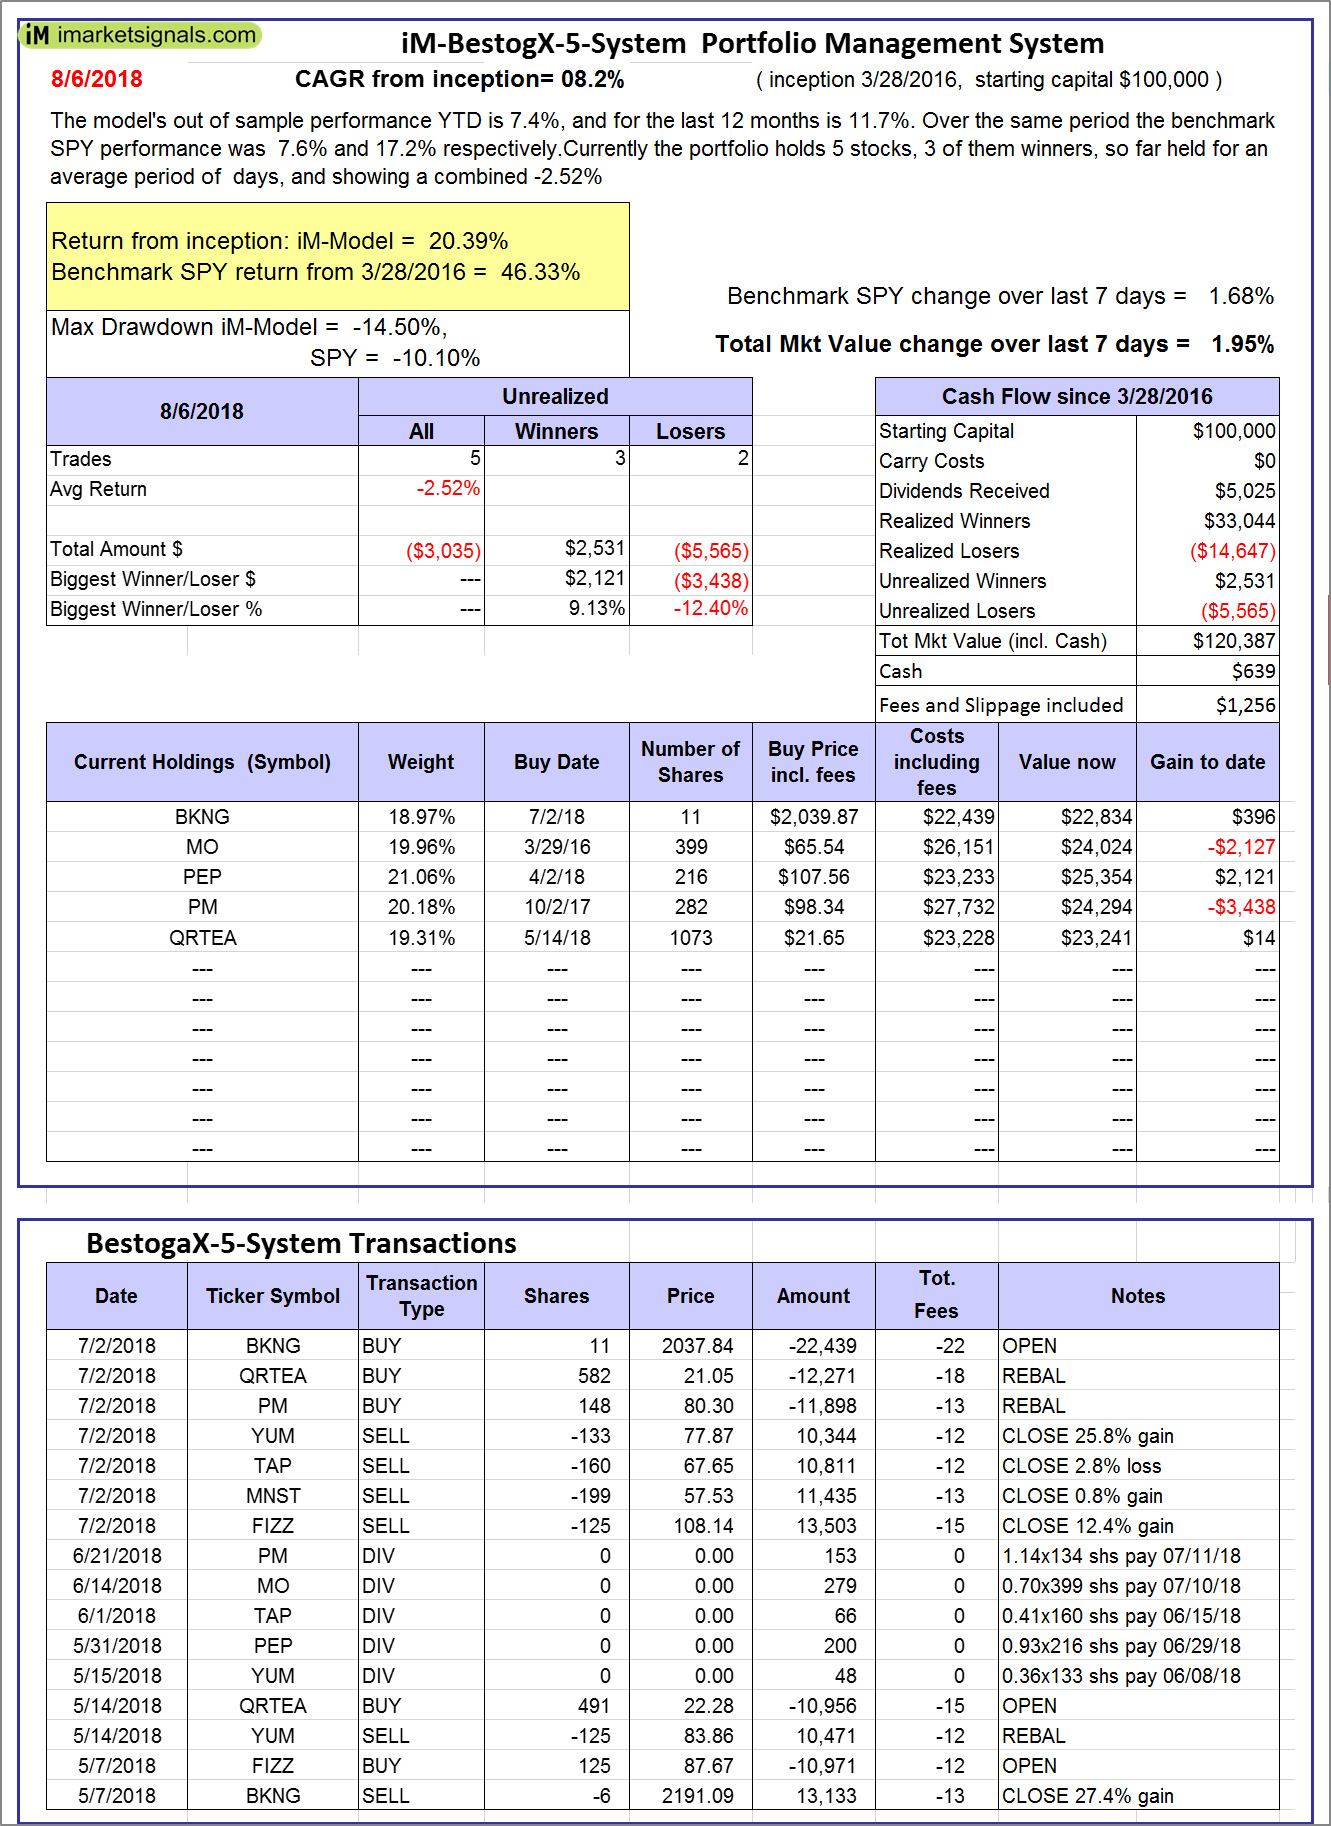
iM-BestogaX5-System: The model’s out of sample performance YTD is 7.4%, and for the last 12 months is 11.7%. Over the same period the benchmark SPY performance was 7.6% and 17.2% respectively. Over the previous week the market value of iM-BestogaX5-System gained 1.95% at a time when SPY gained 1.68%. A starting capital of $100,000 at inception on 3/28/2016 would have grown to $120,387 which includes $639 cash and excludes $1,256 spent on fees and slippage. |
|
|
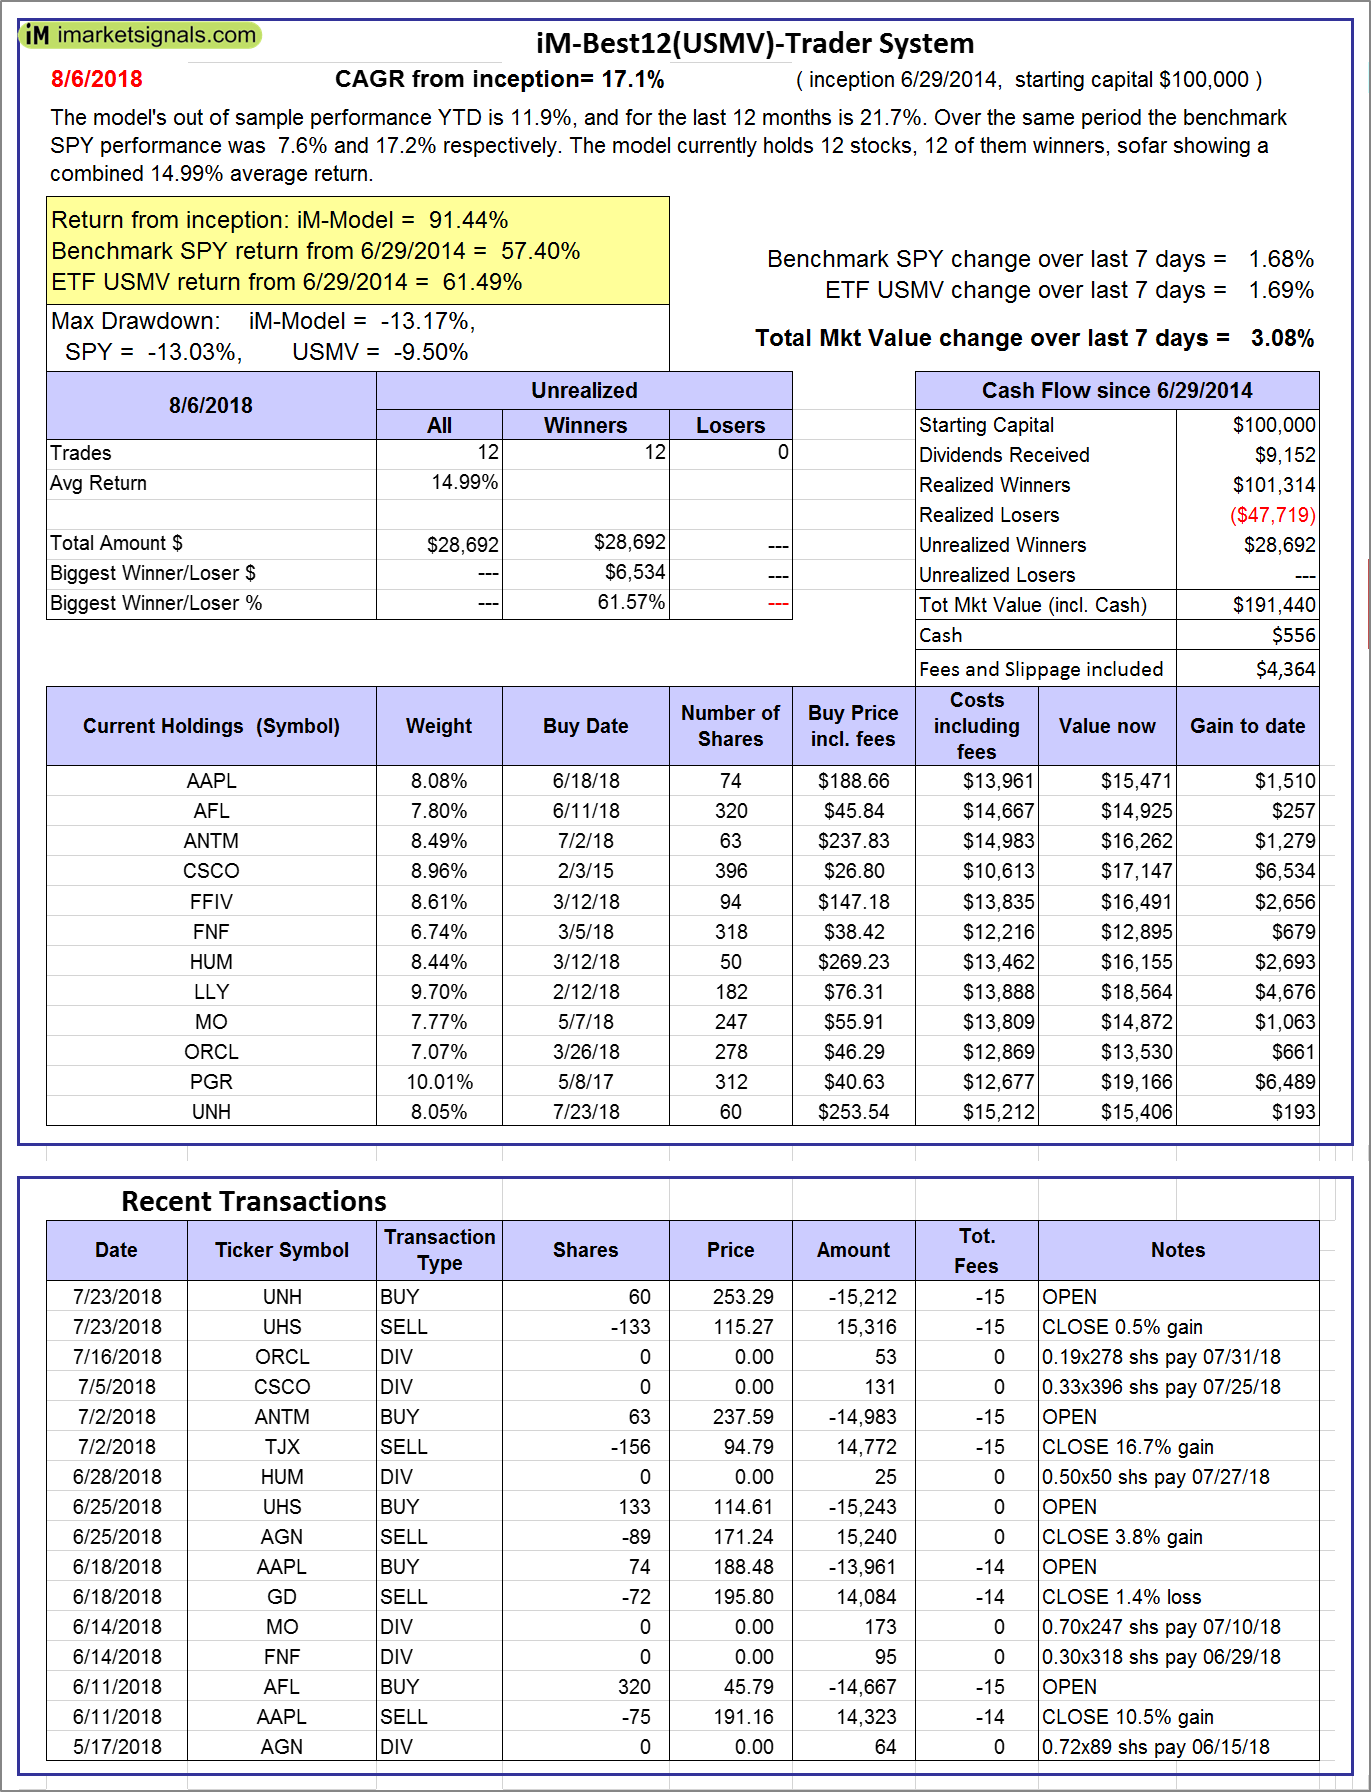
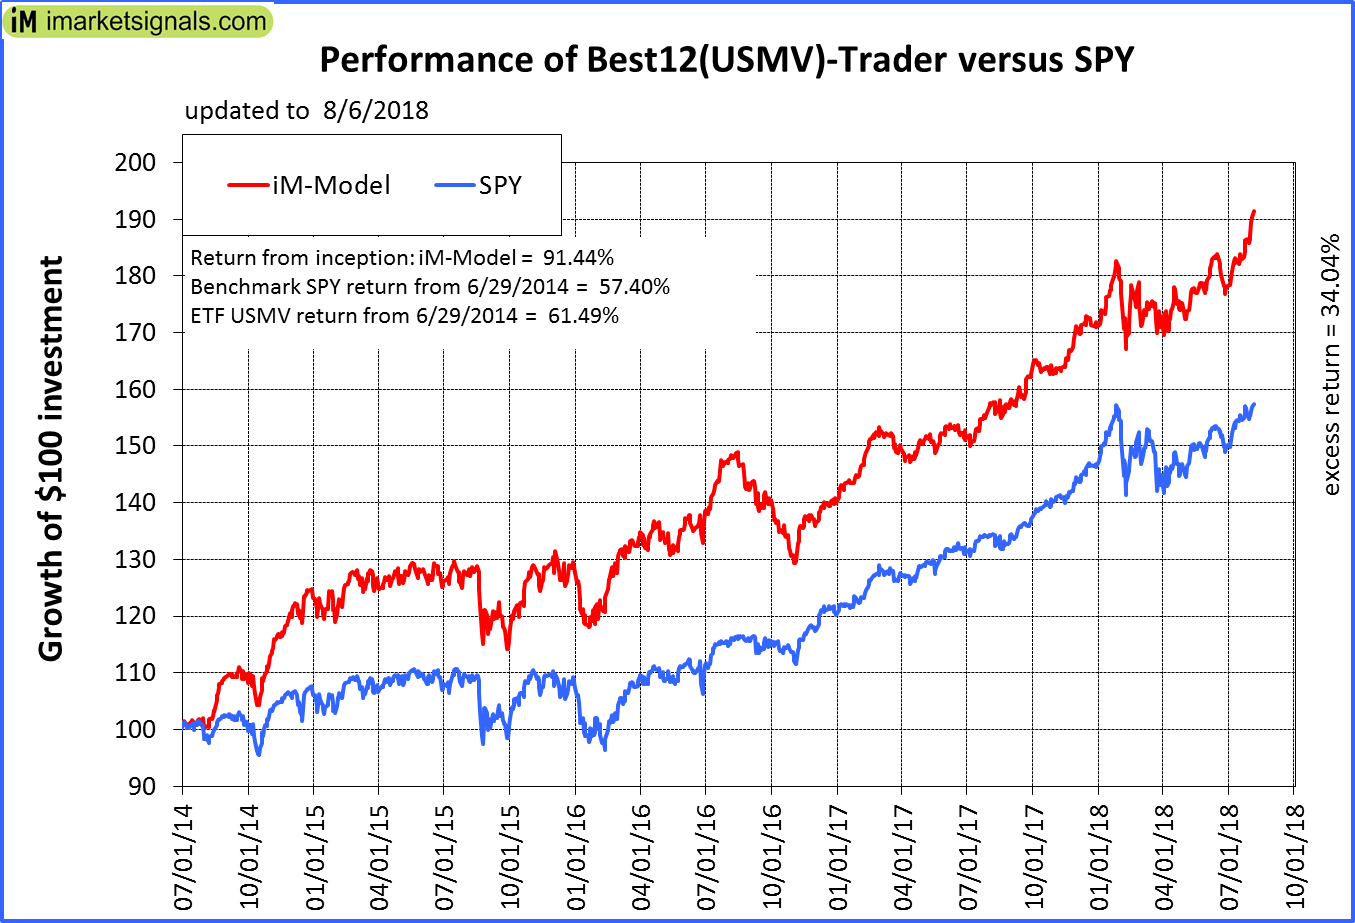
iM-Best12(USMV)-Trader: The model’s out of sample performance YTD is 11.9%, and for the last 12 months is 21.7%. Over the same period the benchmark SPY performance was 7.6% and 17.2% respectively. Since inception, on 6/30/2014, the model gained 91.44% while the benchmark SPY gained 57.40% and the ETF USMV gained 61.49% over the same period. Over the previous week the market value of iM-Best12(USMV)-Trader gained 3.08% at a time when SPY gained 1.68%. A starting capital of $100,000 at inception on 6/30/2014 would have grown to $191,440 which includes $556 cash and excludes $4,364 spent on fees and slippage. |
|
|
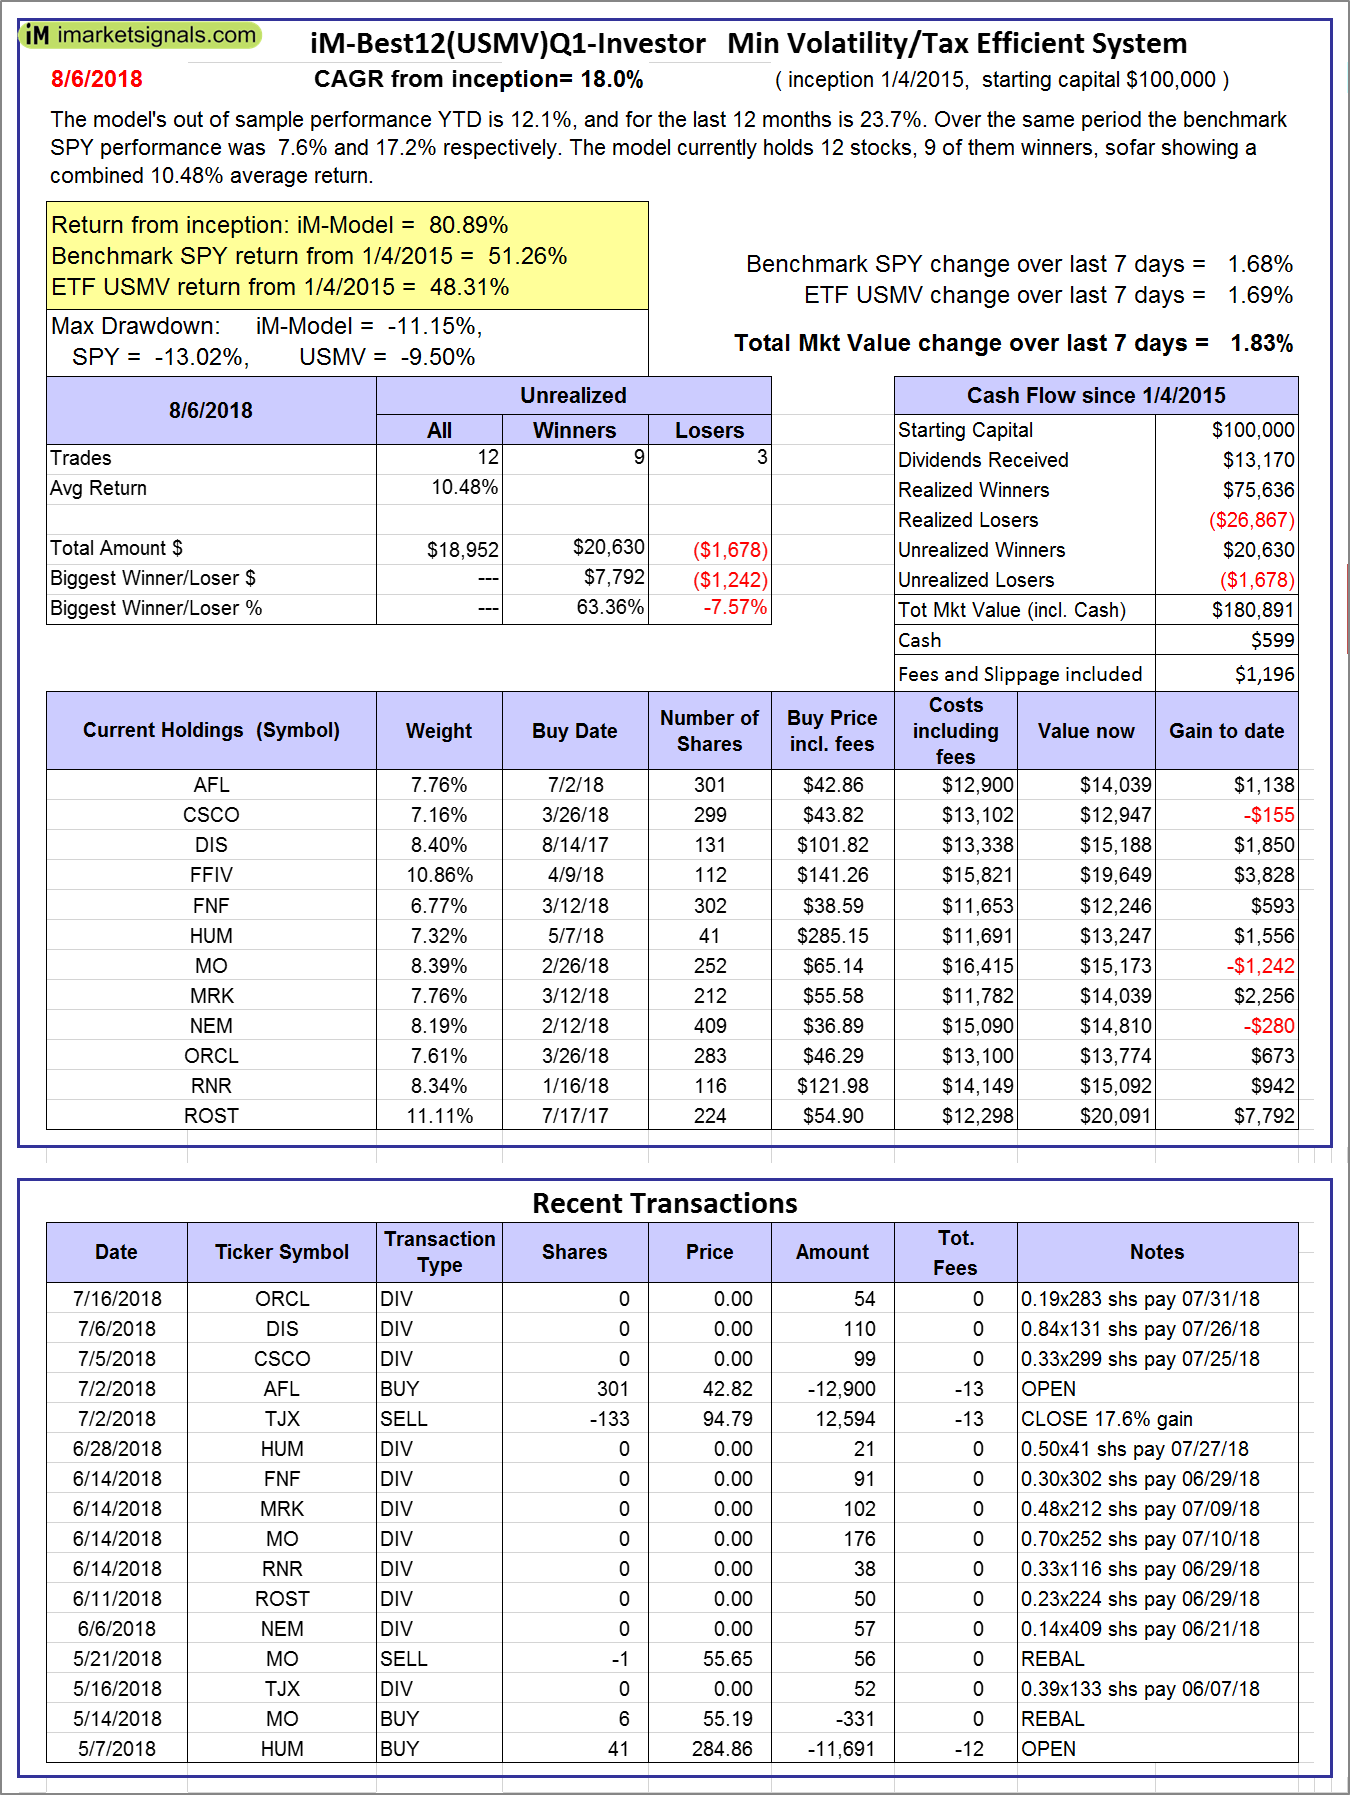
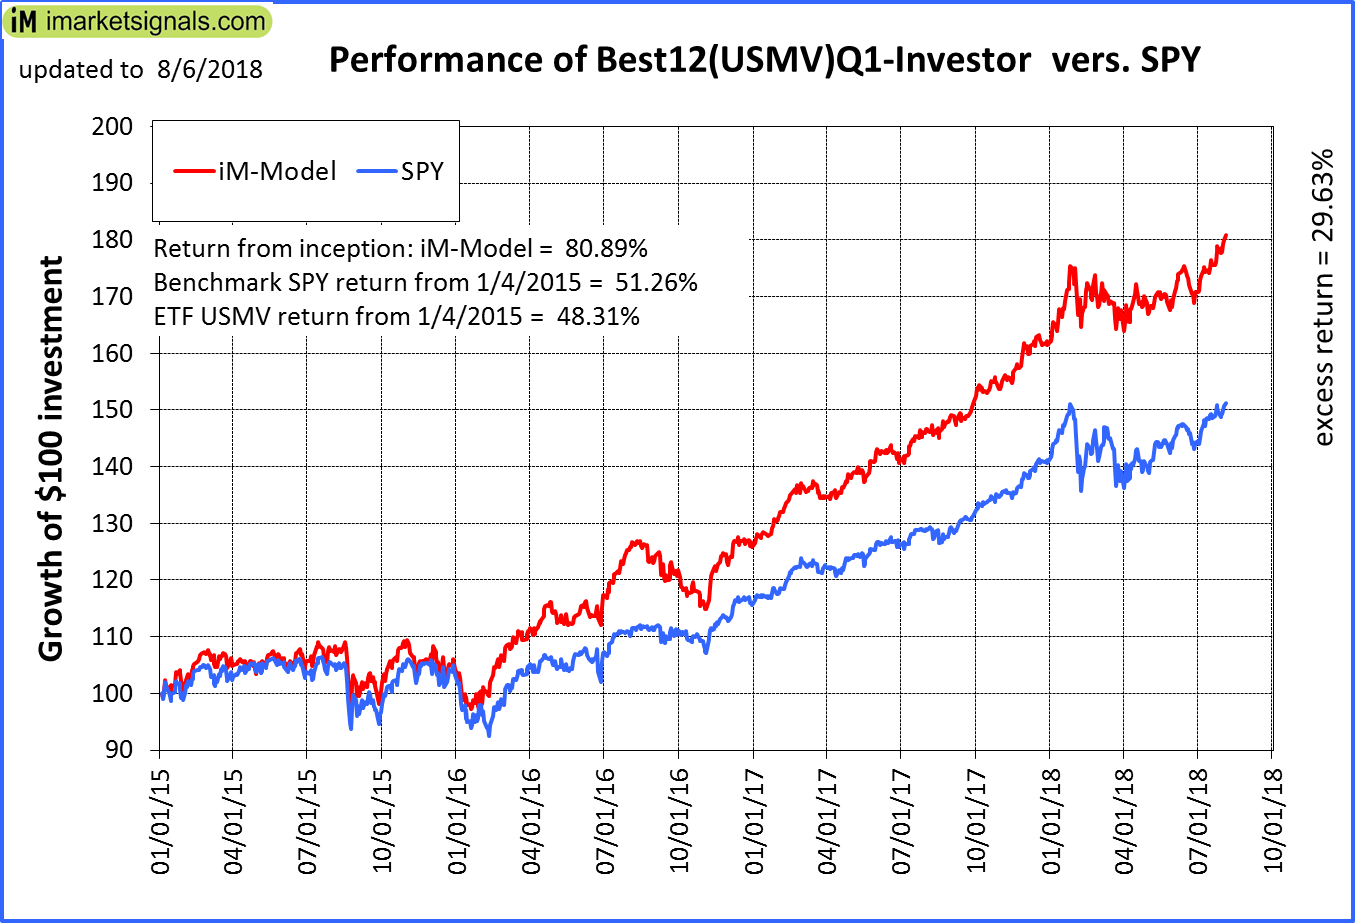
iM-Best12(USMV)Q1-Investor: The model’s out of sample performance YTD is 12.1%, and for the last 12 months is 23.7%. Over the same period the benchmark SPY performance was 7.6% and 17.2% respectively. Since inception, on 1/5/2015, the model gained 80.89% while the benchmark SPY gained 51.26% and the ETF USMV gained 48.31% over the same period. Over the previous week the market value of iM-Best12(USMV)Q1 gained 1.83% at a time when SPY gained 1.68%. A starting capital of $100,000 at inception on 1/5/2015 would have grown to $180,891 which includes $599 cash and excludes $1,196 spent on fees and slippage. |
|
|
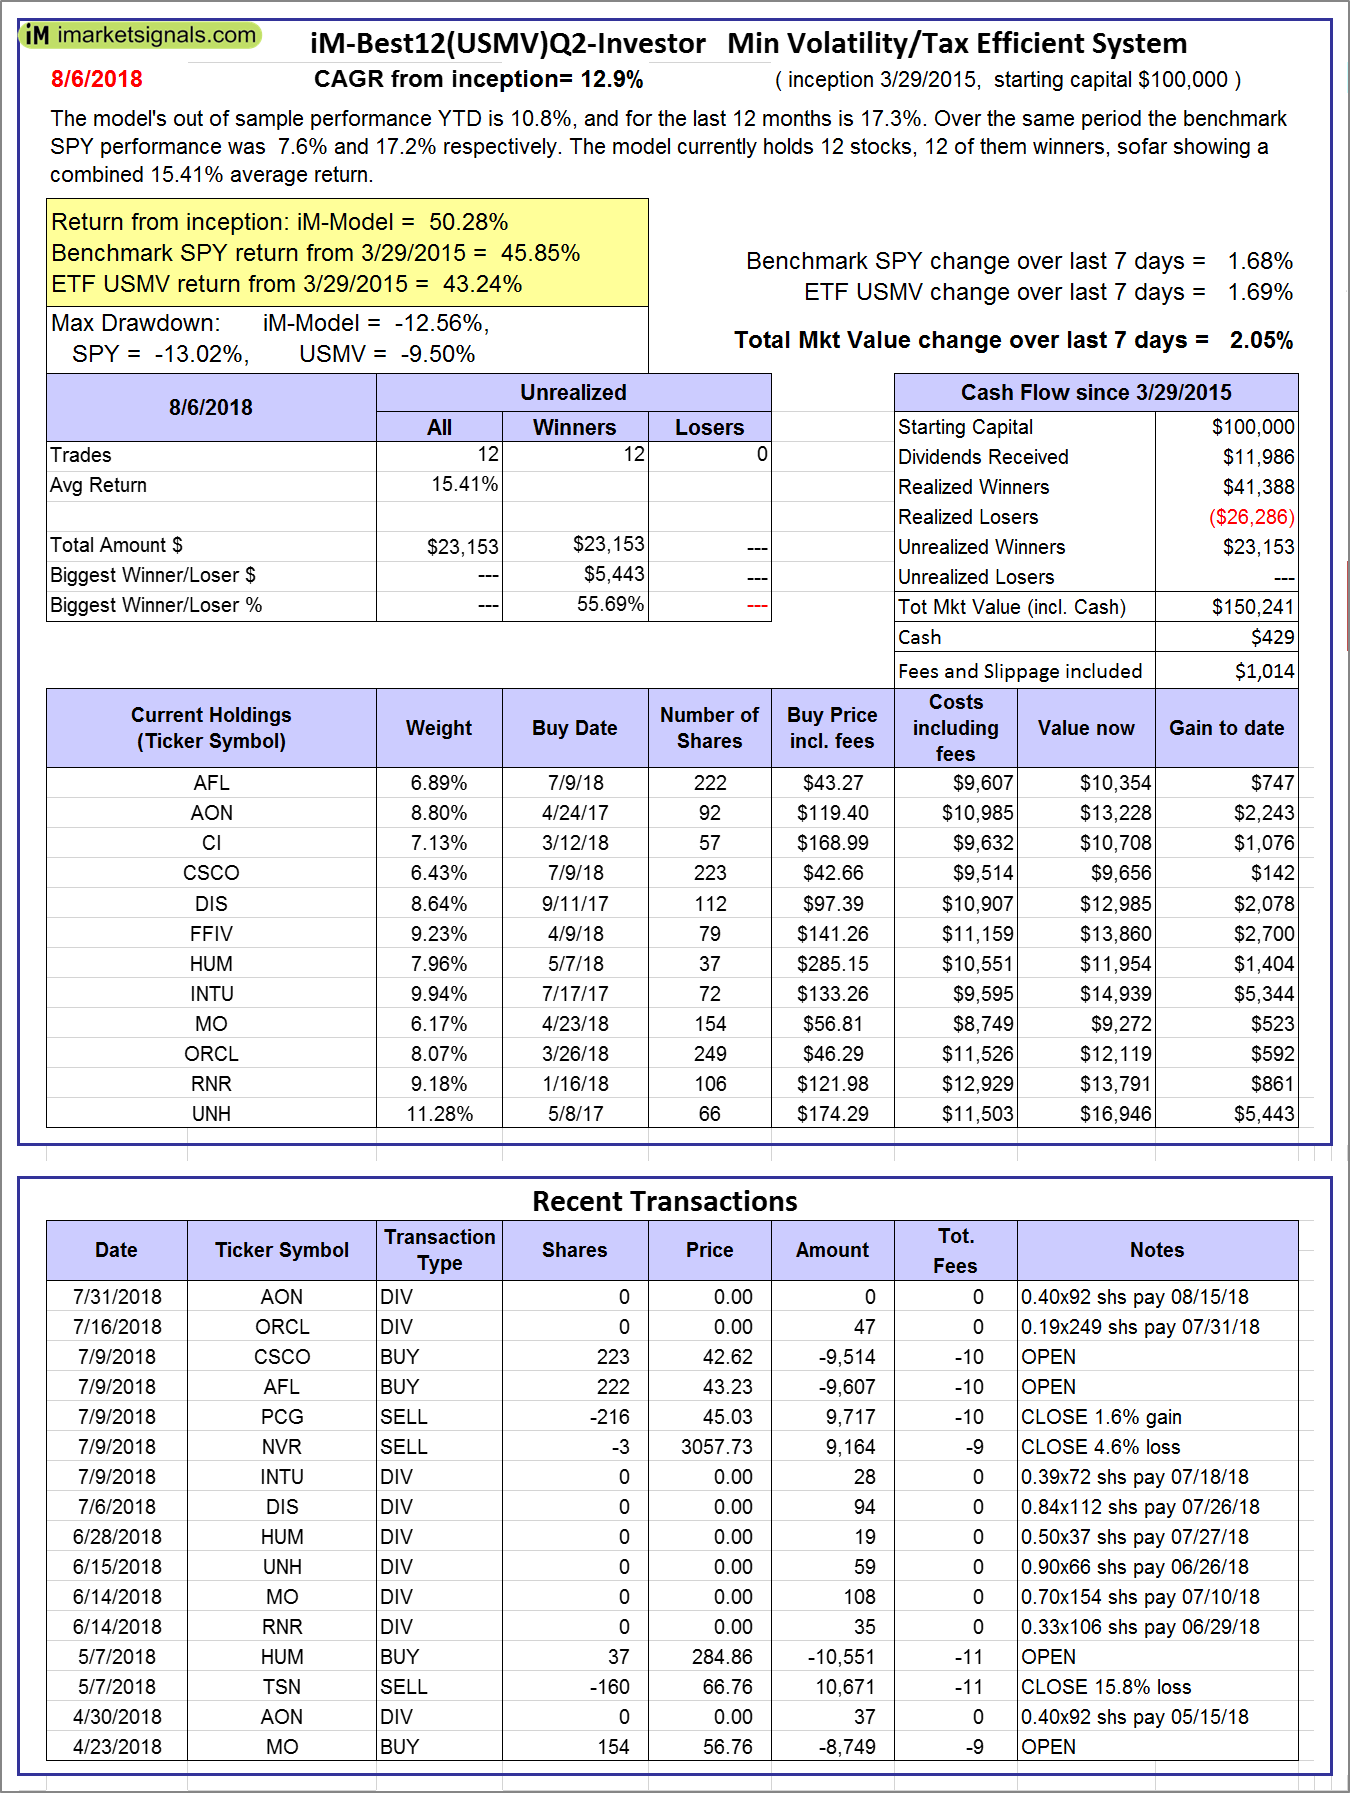
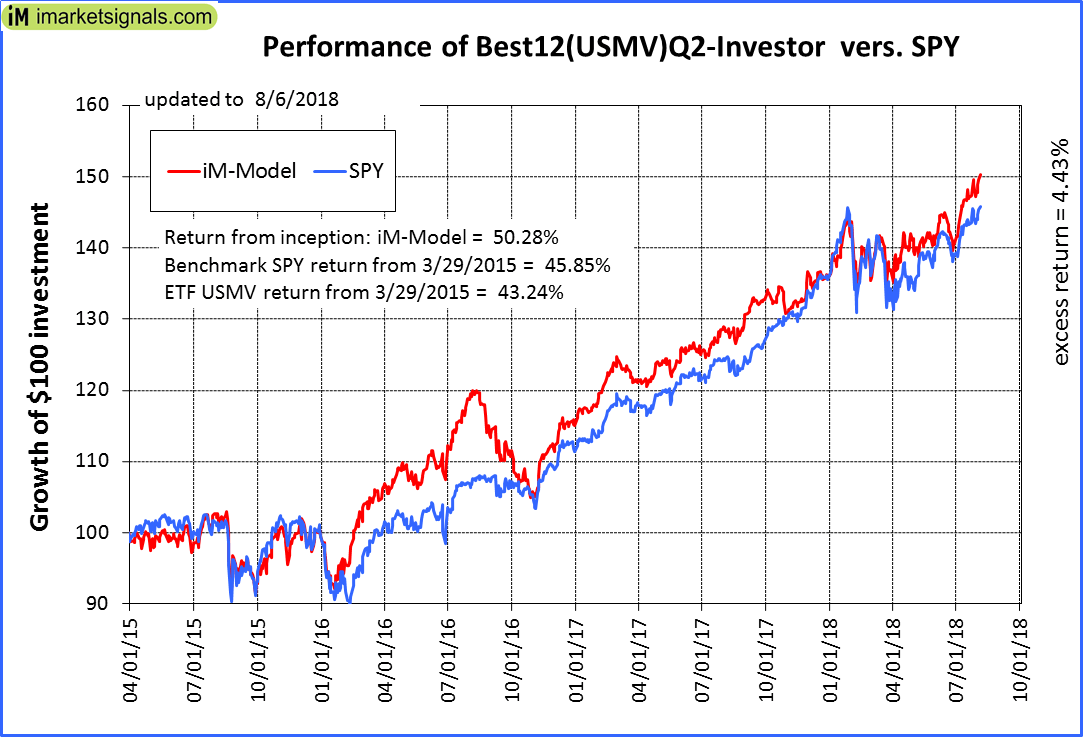
iM-Best12(USMV)Q2-Investor: The model’s out of sample performance YTD is 10.8%, and for the last 12 months is 17.3%. Over the same period the benchmark SPY performance was 7.6% and 17.2% respectively. Since inception, on 3/30/2015, the model gained 50.28% while the benchmark SPY gained 45.85% and the ETF USMV gained 43.24% over the same period. Over the previous week the market value of iM-Best12(USMV)Q2 gained 2.05% at a time when SPY gained 1.68%. A starting capital of $100,000 at inception on 3/30/2015 would have grown to $150,241 which includes $429 cash and excludes $1,014 spent on fees and slippage. |
|
|
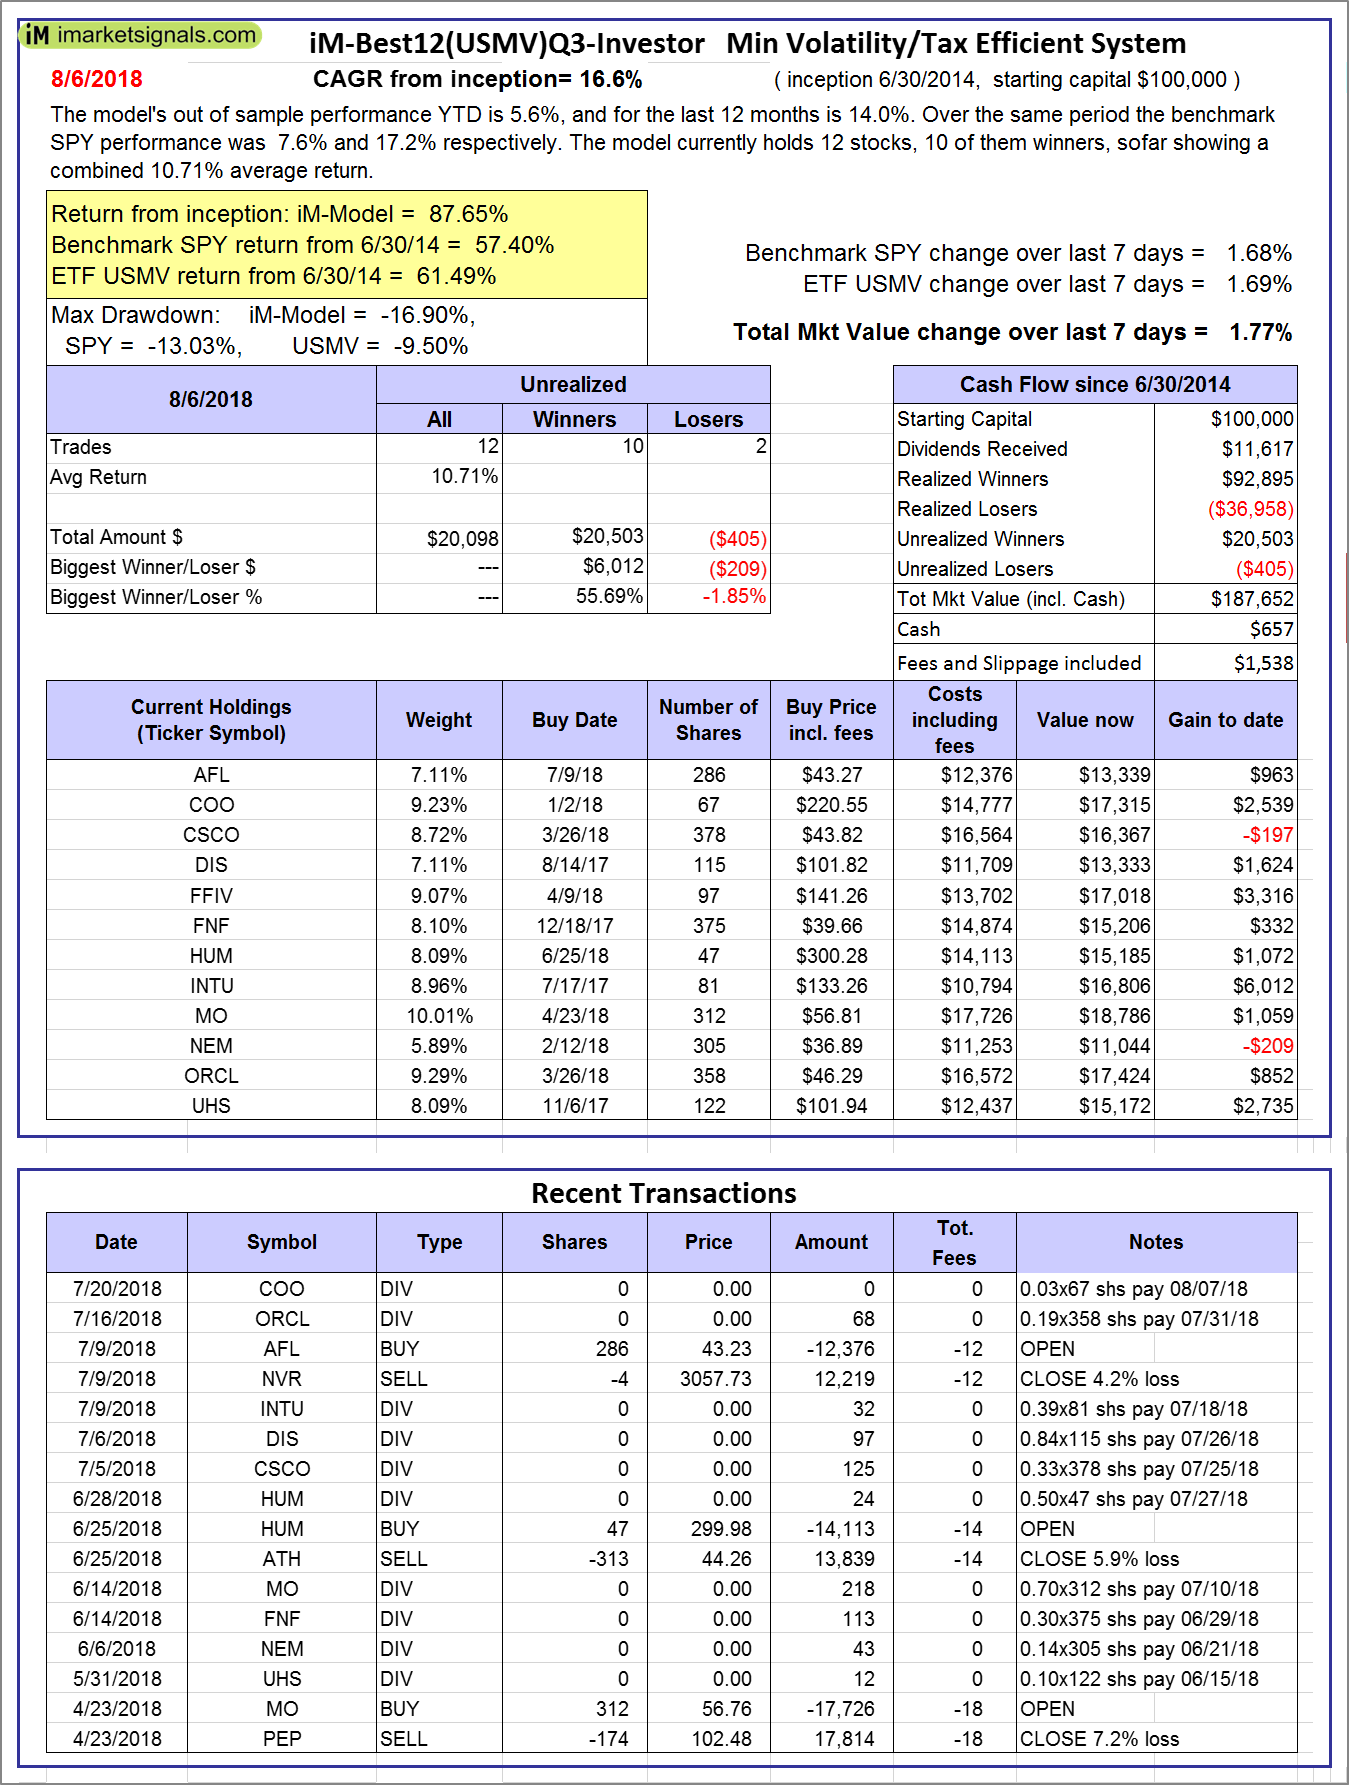
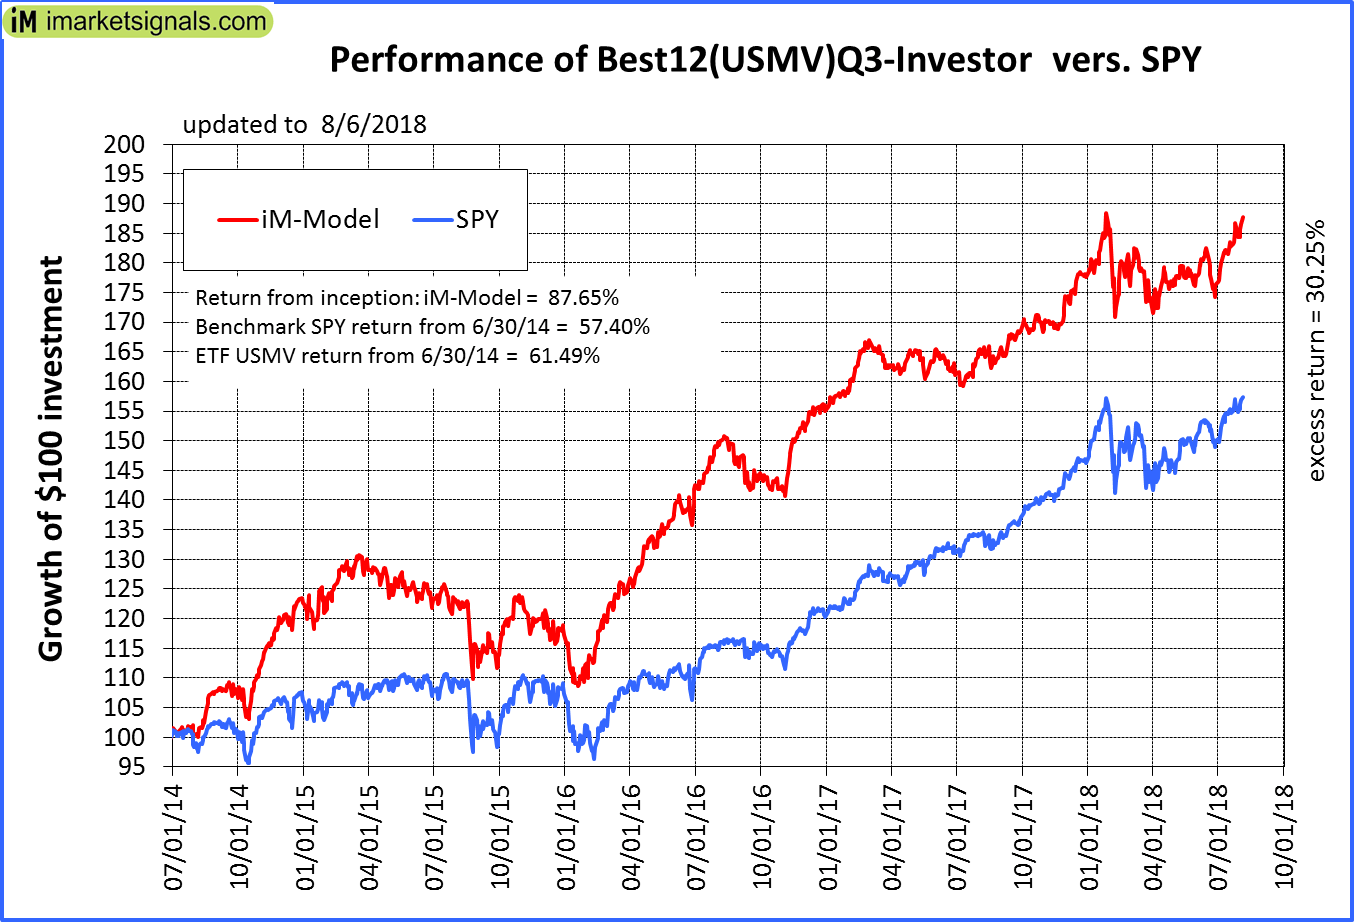
iM-Best12(USMV)Q3-Investor: The model’s out of sample performance YTD is 5.6%, and for the last 12 months is 14.0%. Over the same period the benchmark SPY performance was 7.6% and 17.2% respectively. Since inception, on 7/1/2014, the model gained 87.65% while the benchmark SPY gained 57.40% and the ETF USMV gained 61.49% over the same period. Over the previous week the market value of iM-Best12(USMV)Q3 gained 1.77% at a time when SPY gained 1.68%. A starting capital of $100,000 at inception on 7/1/2014 would have grown to $187,652 which includes $657 cash and excludes $1,538 spent on fees and slippage. |
|
|
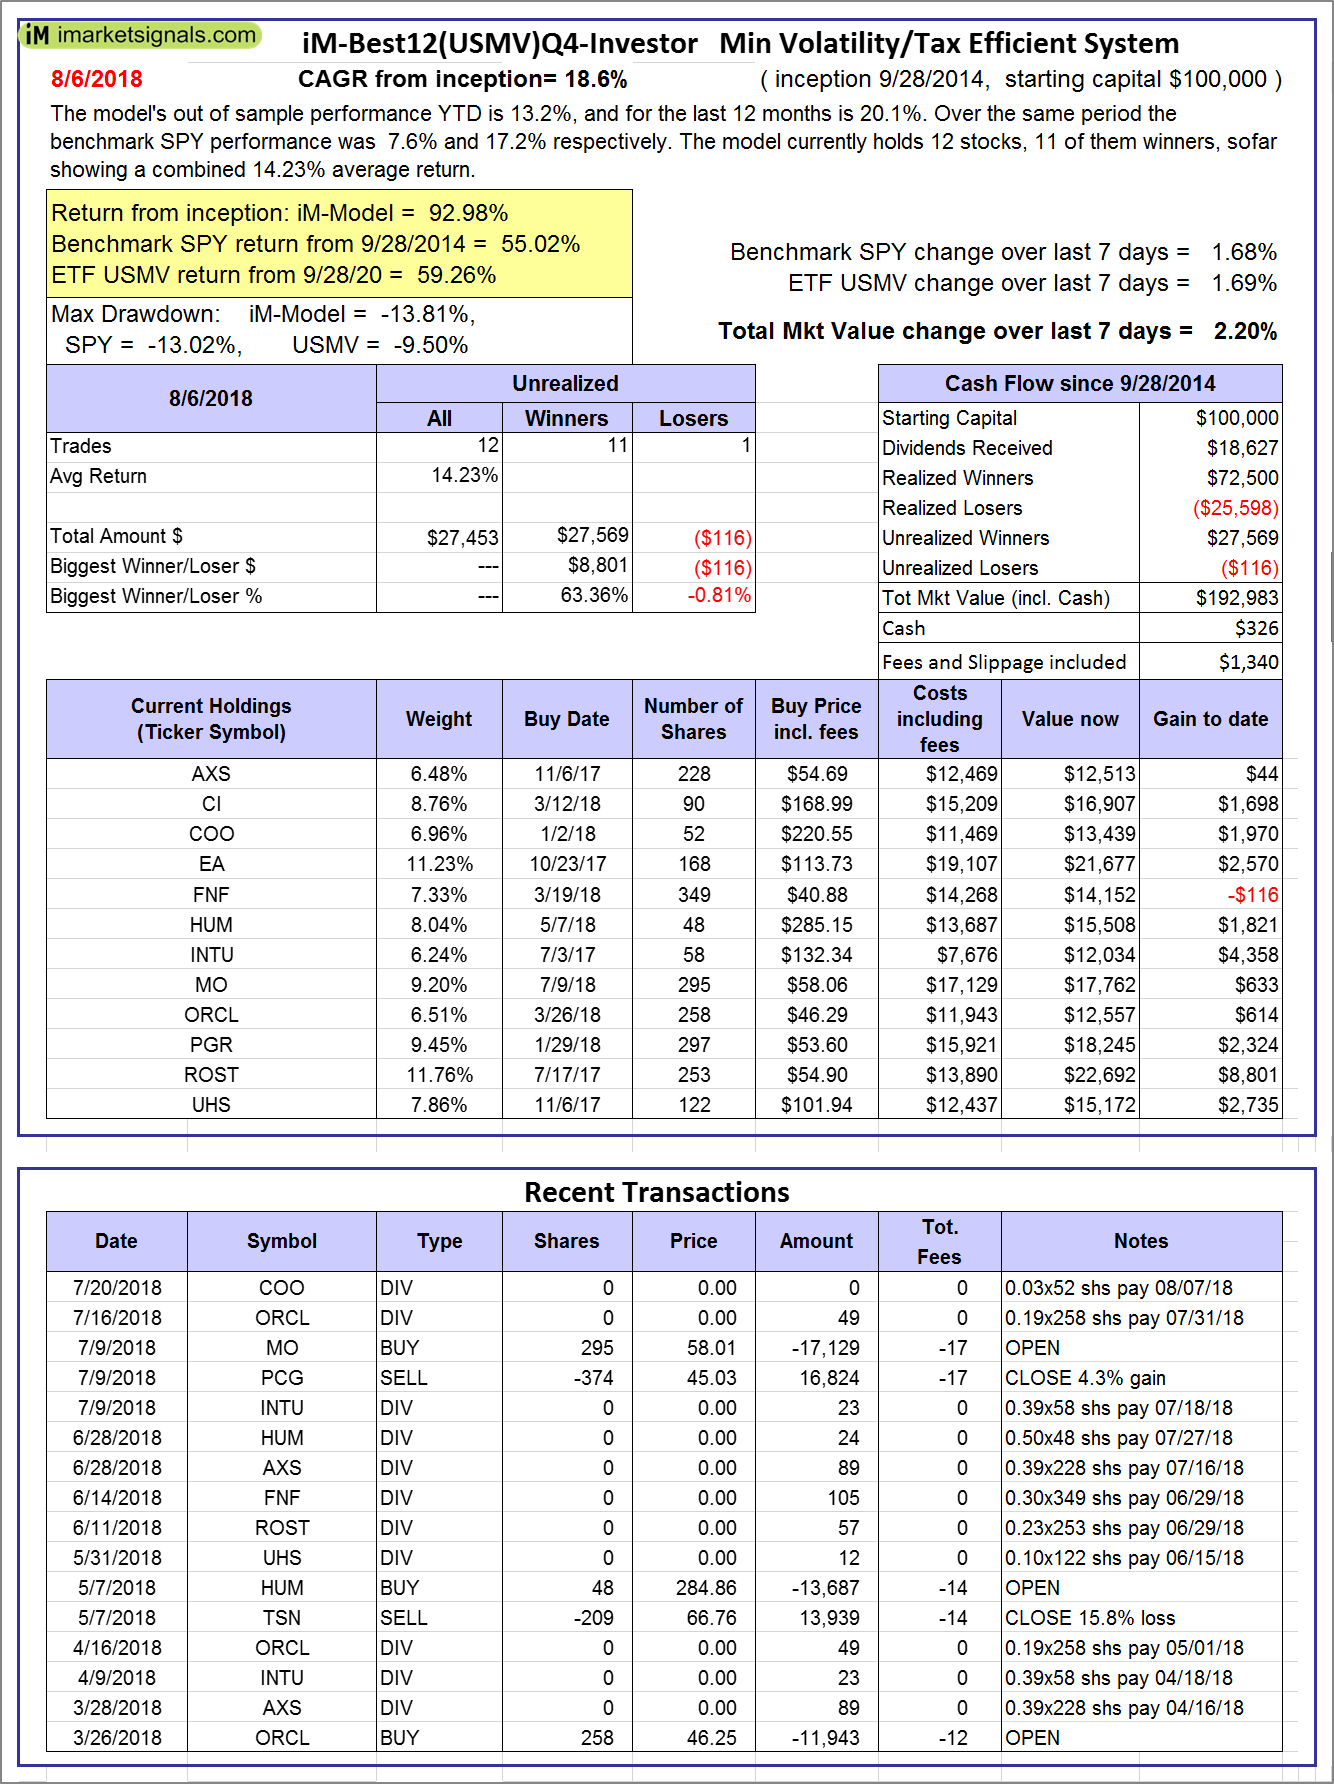
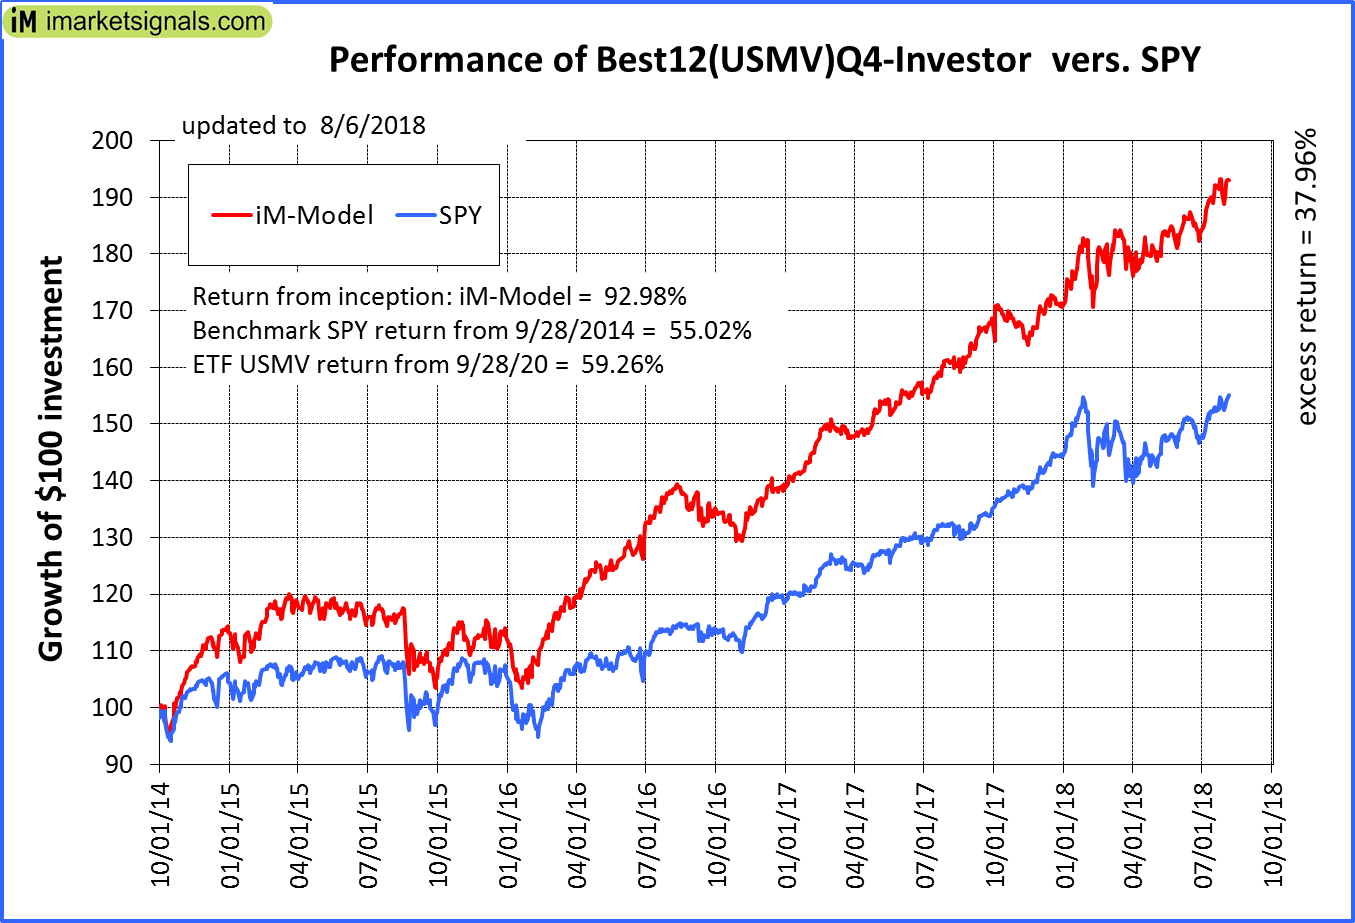
iM-Best12(USMV)Q4-Investor: Since inception, on 9/29/2014, the model gained 92.98% while the benchmark SPY gained 55.02% and the ETF USMV gained 59.26% over the same period. Over the previous week the market value of iM-Best12(USMV)Q4 gained 2.20% at a time when SPY gained 1.68%. A starting capital of $100,000 at inception on 9/29/2014 would have grown to $192,983 which includes $326 cash and excludes $1,340 spent on fees and slippage. |
|
|
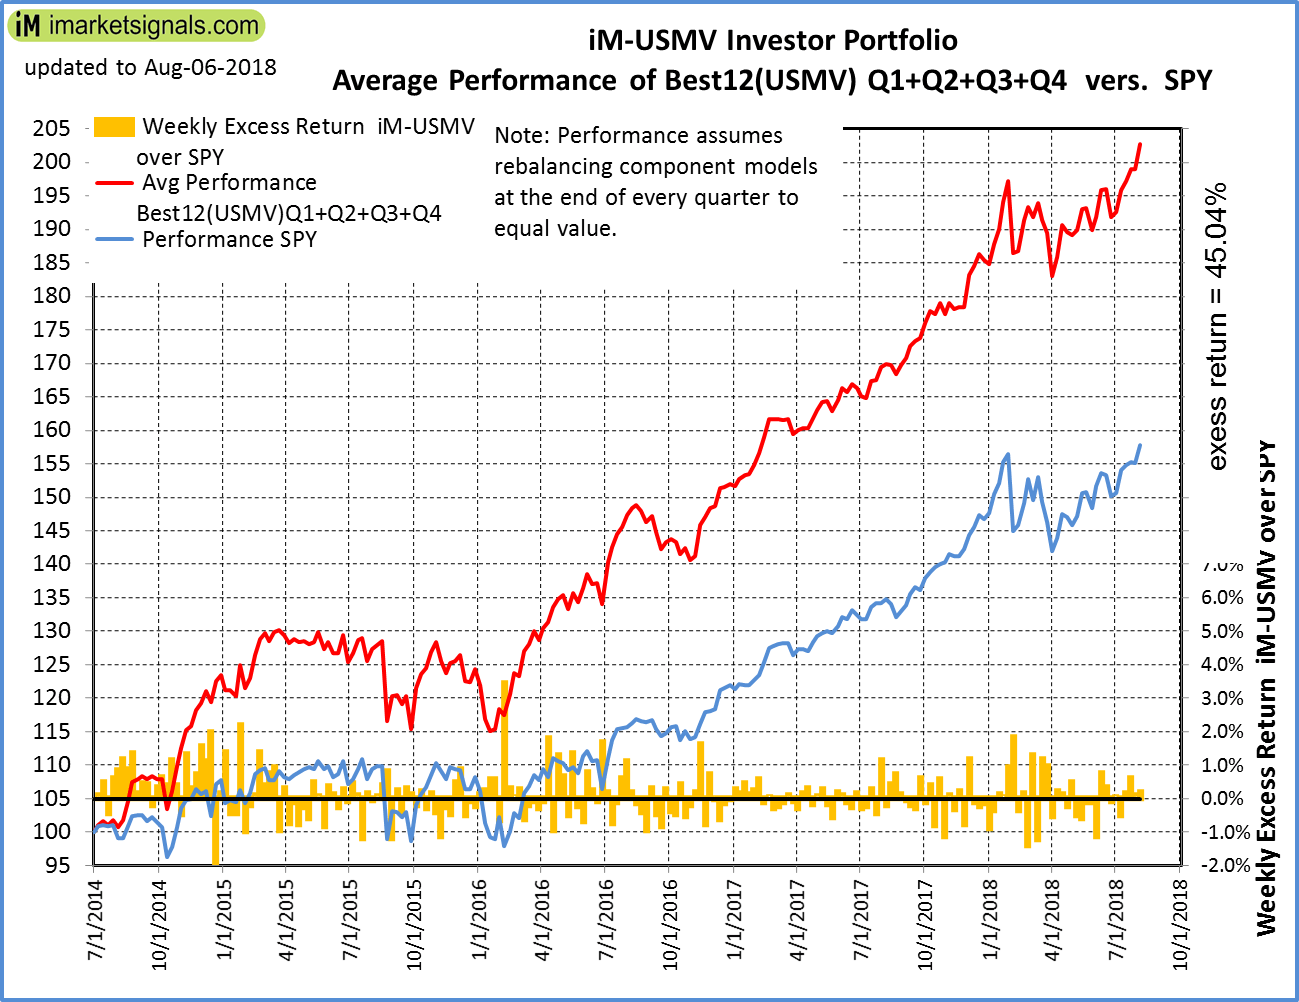
Average Performance of iM-Best12(USMV)Q1+Q2+Q3+Q4-Investor resulted in an excess return of 45.04% over SPY. (see iM-USMV Investor Portfolio) |
|
|
iM-Best(Short): The model’s out of sample performance YTD is -2.0%, and for the last 12 months is -11.1%. Over the same period the benchmark SPY performance was 7.6% and 17.2% respectively. Over the previous week the market value of iM-Best(Short) gained 0.00% at a time when SPY gained 1.68%. Over the period 1/2/2009 to 8/6/2018 the starting capital of $100,000 would have grown to $39,815 which includes $39,815 cash and excludes $24,436 spent on fees and slippage. |
|
|
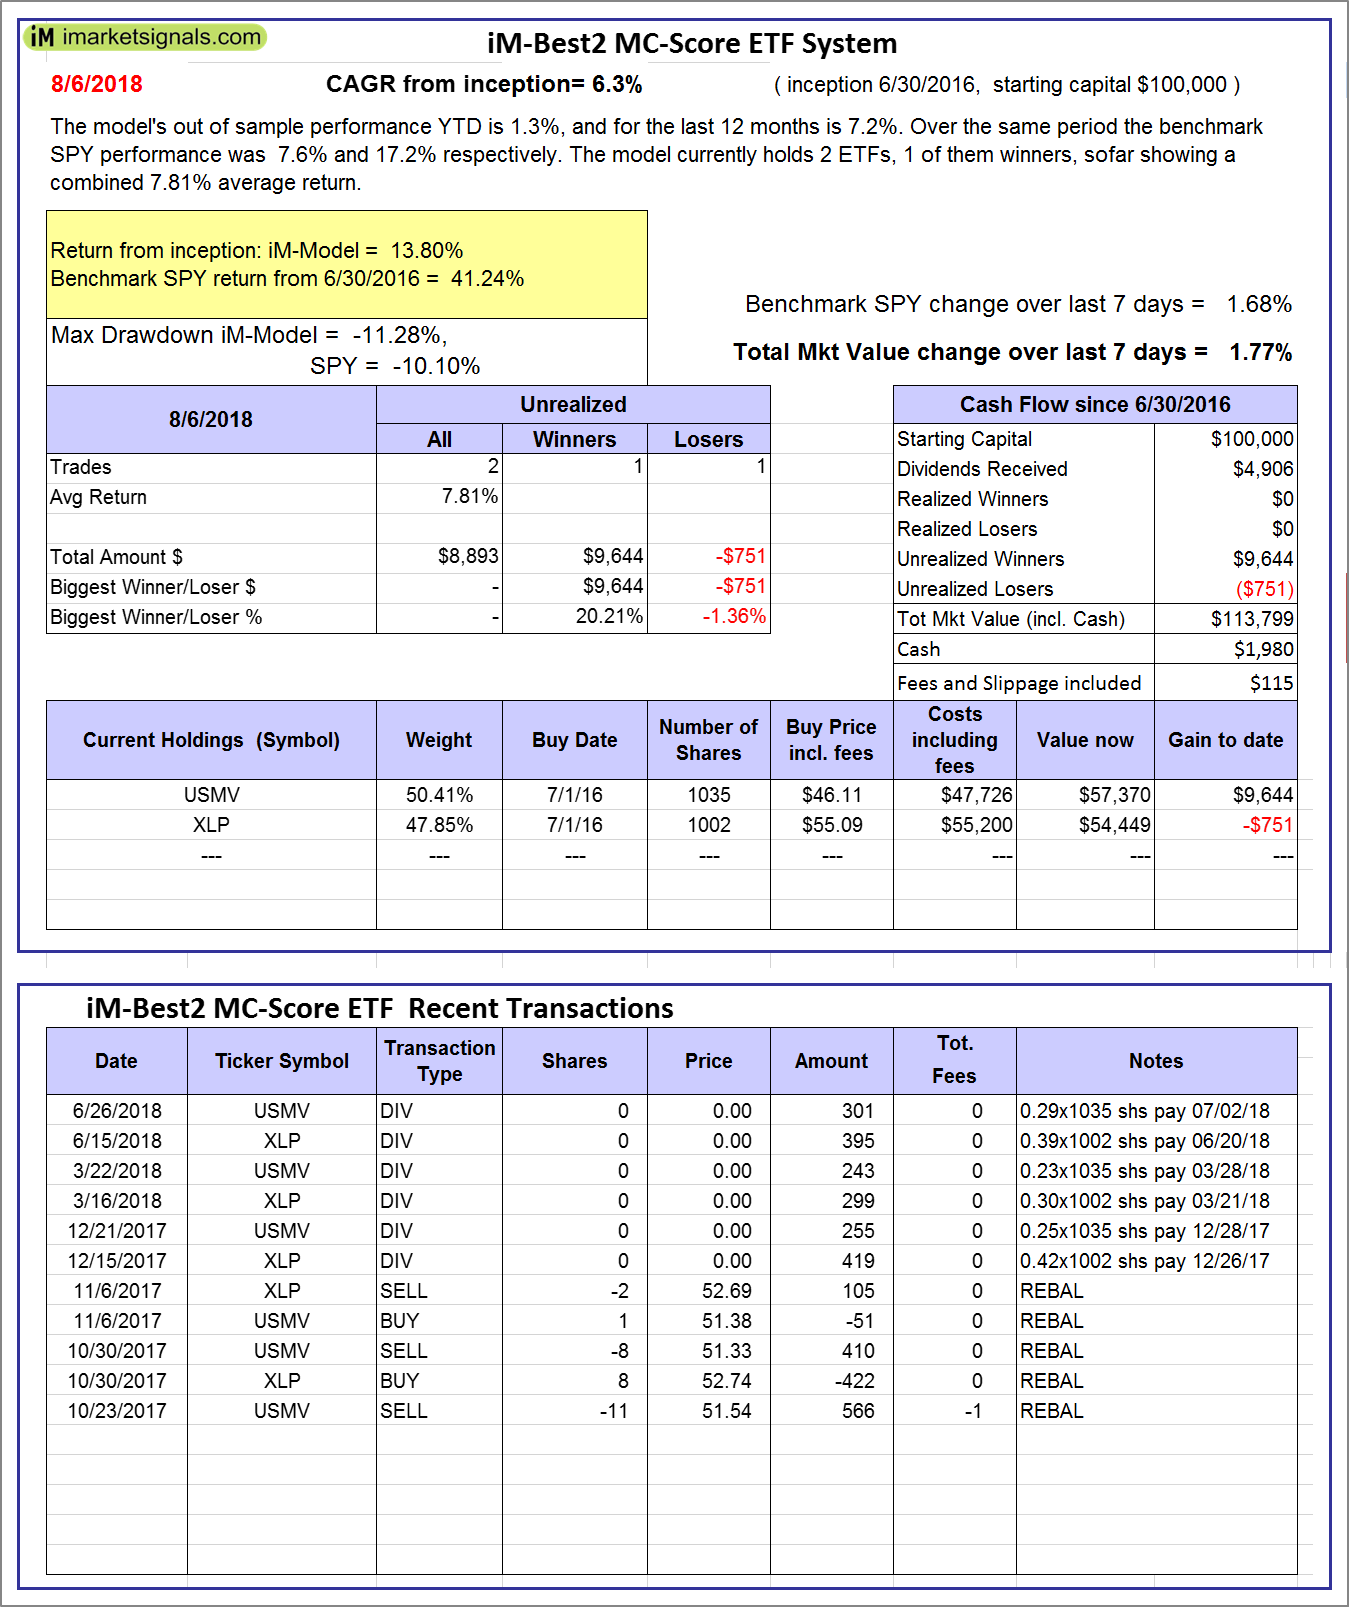
iM-Best2 MC-Score ETF System: The model’s out of sample performance YTD is 1.3%, and for the last 12 months is 7.2%. Over the same period the benchmark SPY performance was 7.6% and 17.2% respectively. Over the previous week the market value of the iM-Best2 MC-Score ETF System gained 1.77% at a time when SPY gained 1.68%. A starting capital of $100,000 at inception on 6/30/2016 would have grown to $113,799 which includes $1,980 cash and excludes $115 spent on fees and slippage. |
|
|
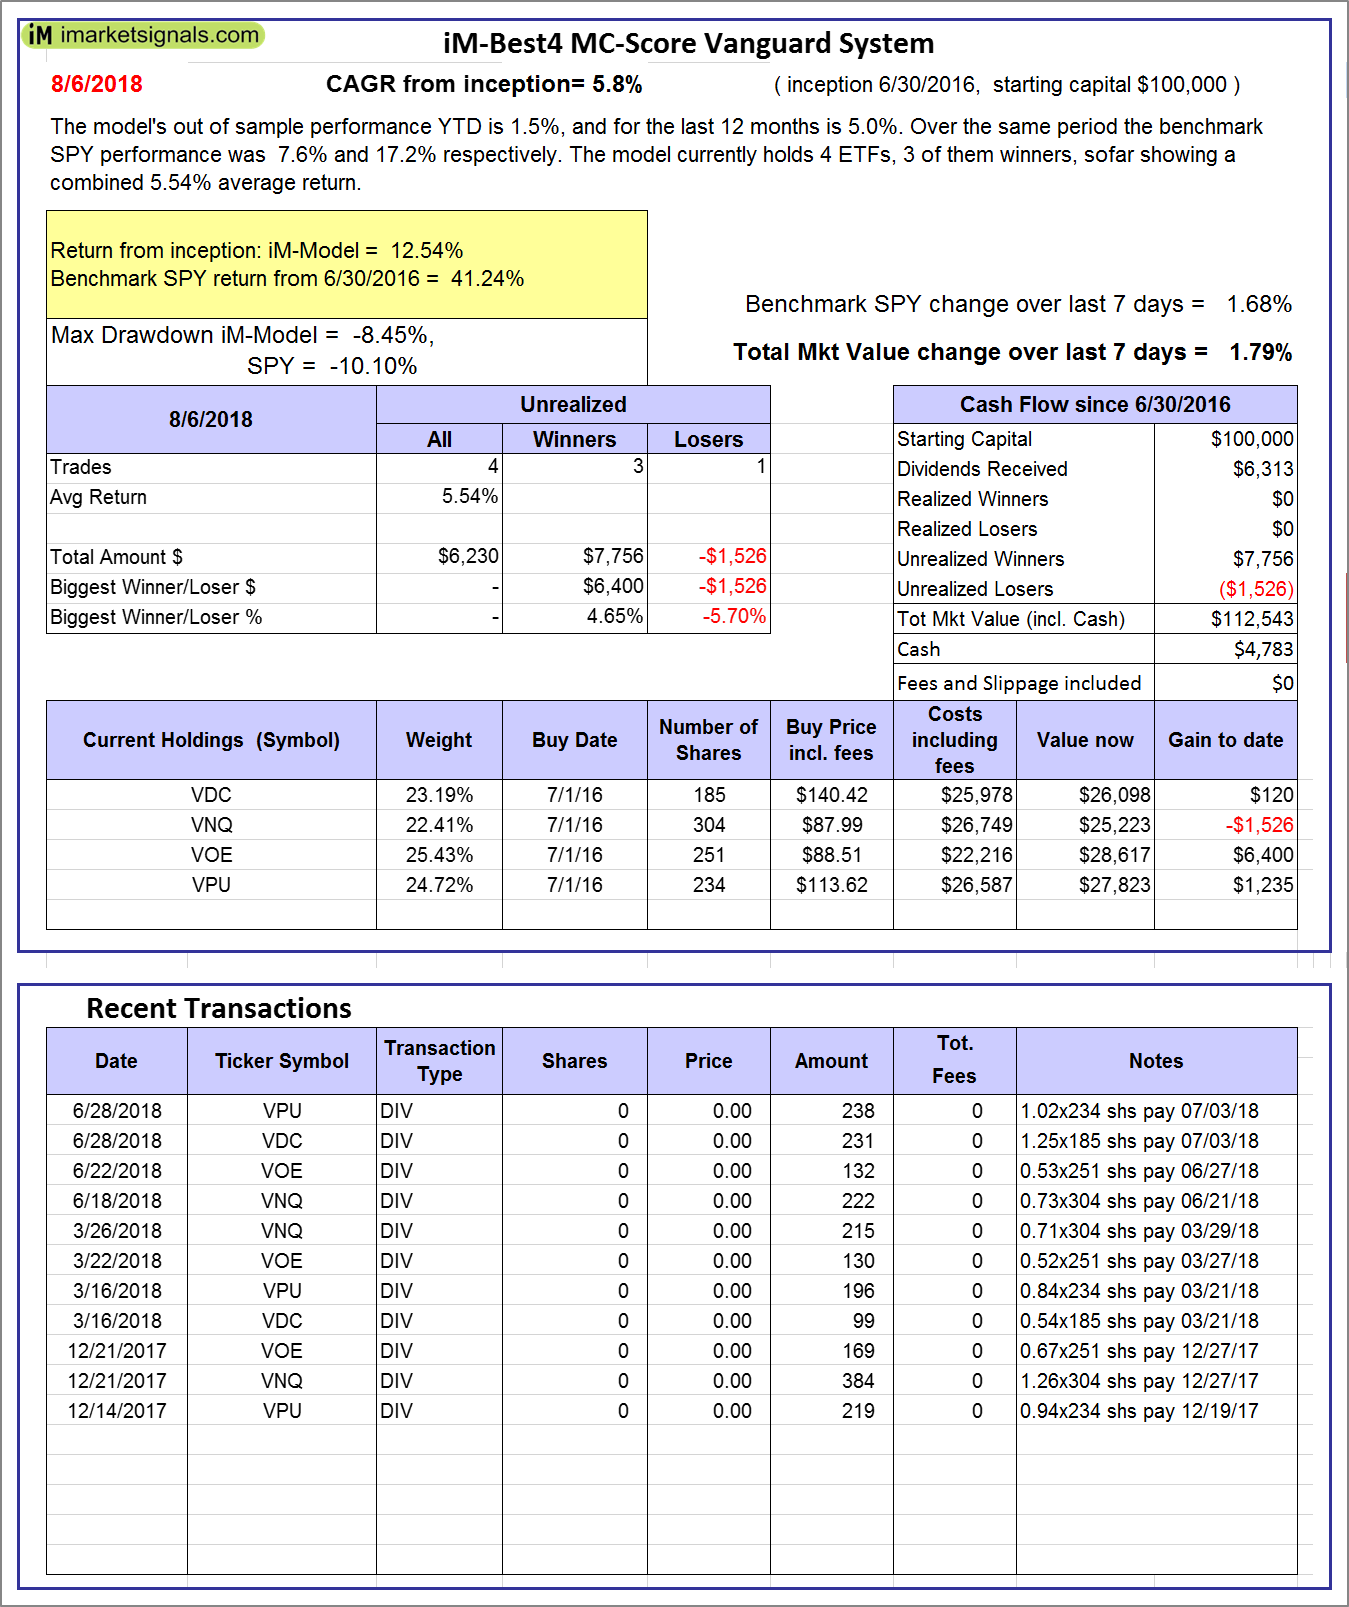
iM-Best4 MC-Score Vanguard System: The model’s out of sample performance YTD is 1.5%, and for the last 12 months is 5.0%. Over the same period the benchmark SPY performance was 7.6% and 17.2% respectively. Over the previous week the market value of the iM-Best4 MC-Score Vanguard System gained 1.79% at a time when SPY gained 1.68%. A starting capital of $100,000 at inception on 6/30/2016 would have grown to $112,543 which includes $4,783 cash and excludes $00 spent on fees and slippage. |
|
|
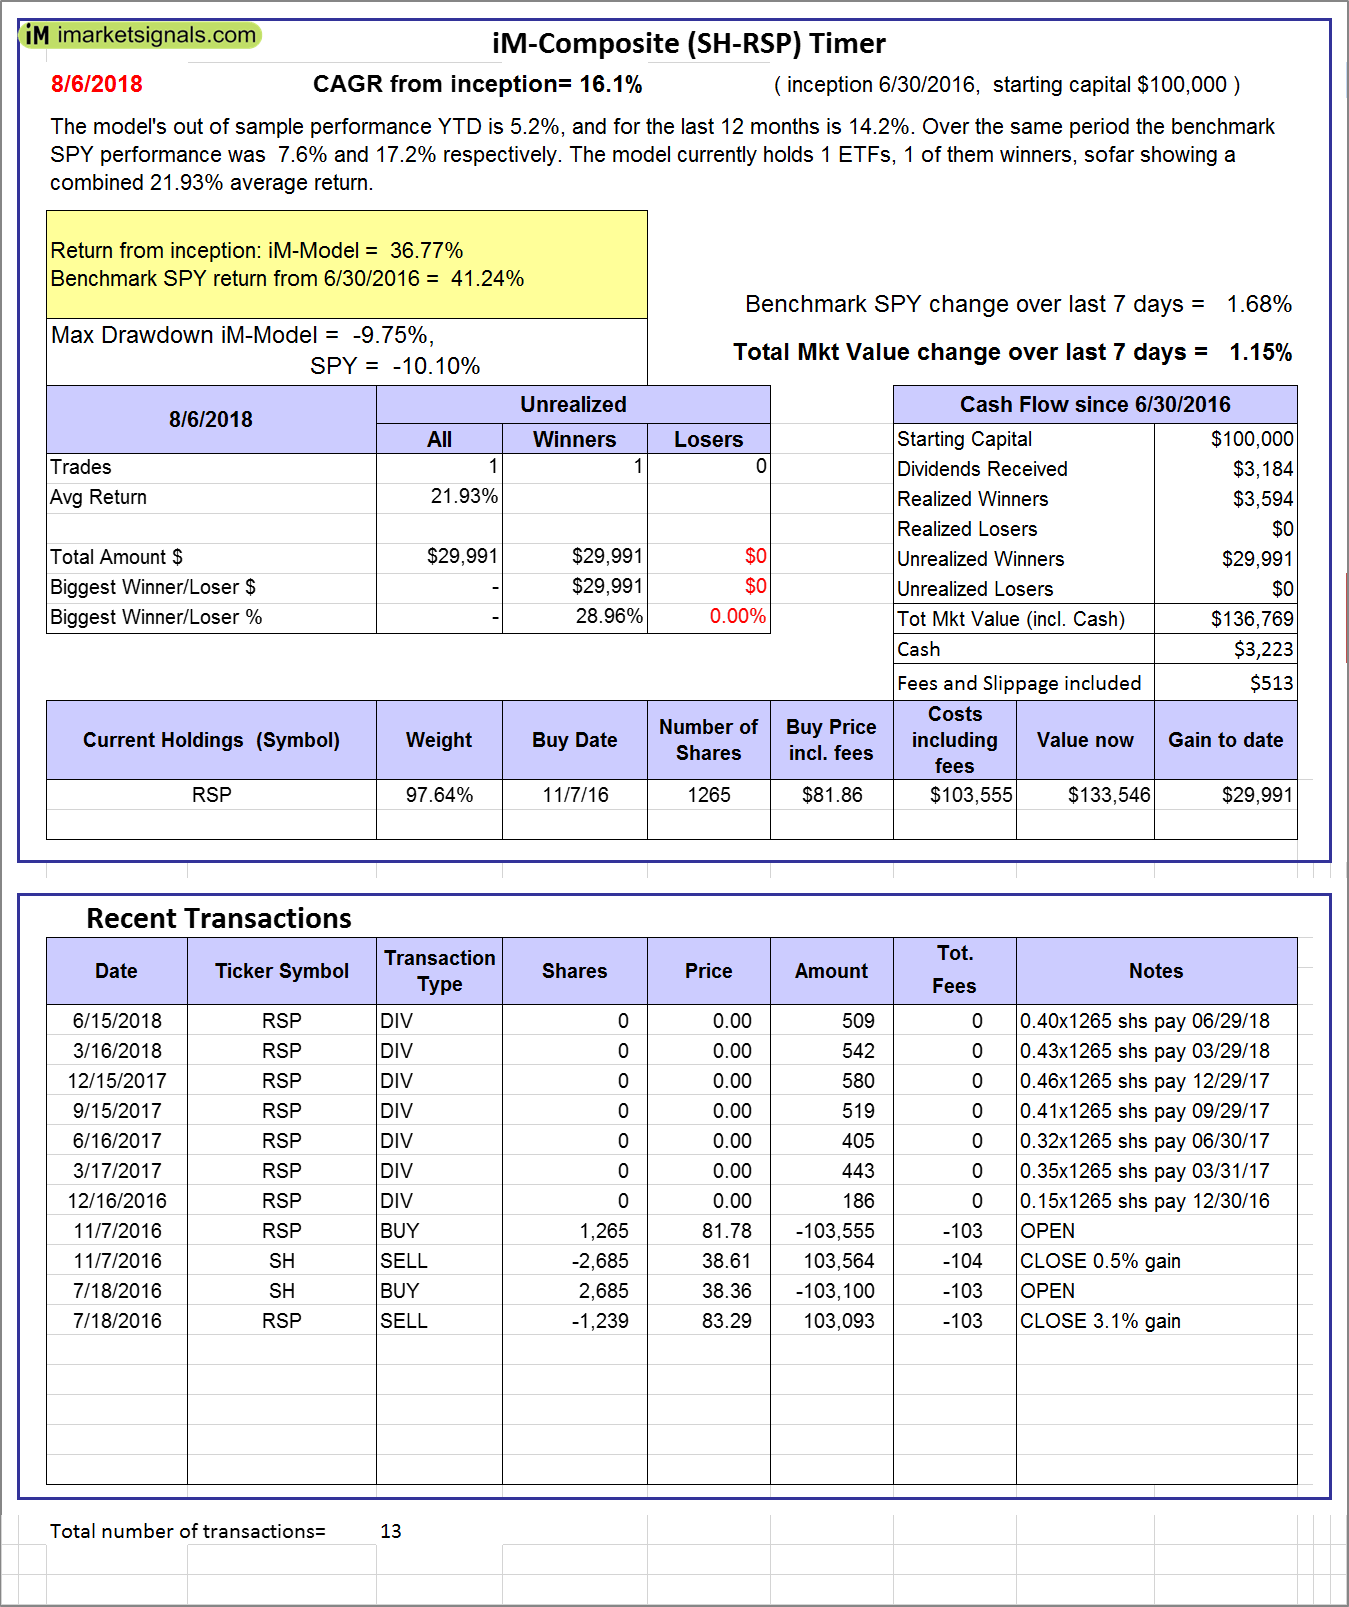
iM-Composite (SH-RSP) Timer: The model’s out of sample performance YTD is 5.2%, and for the last 12 months is 14.2%. Over the same period the benchmark SPY performance was 7.6% and 17.2% respectively. Over the previous week the market value of the iM-Composite (SH-RSP) Timer gained 1.15% at a time when SPY gained 1.68%. A starting capital of $100,000 at inception on 6/30/2016 would have grown to $136,769 which includes $3,223 cash and excludes $513 spent on fees and slippage. |
|
|
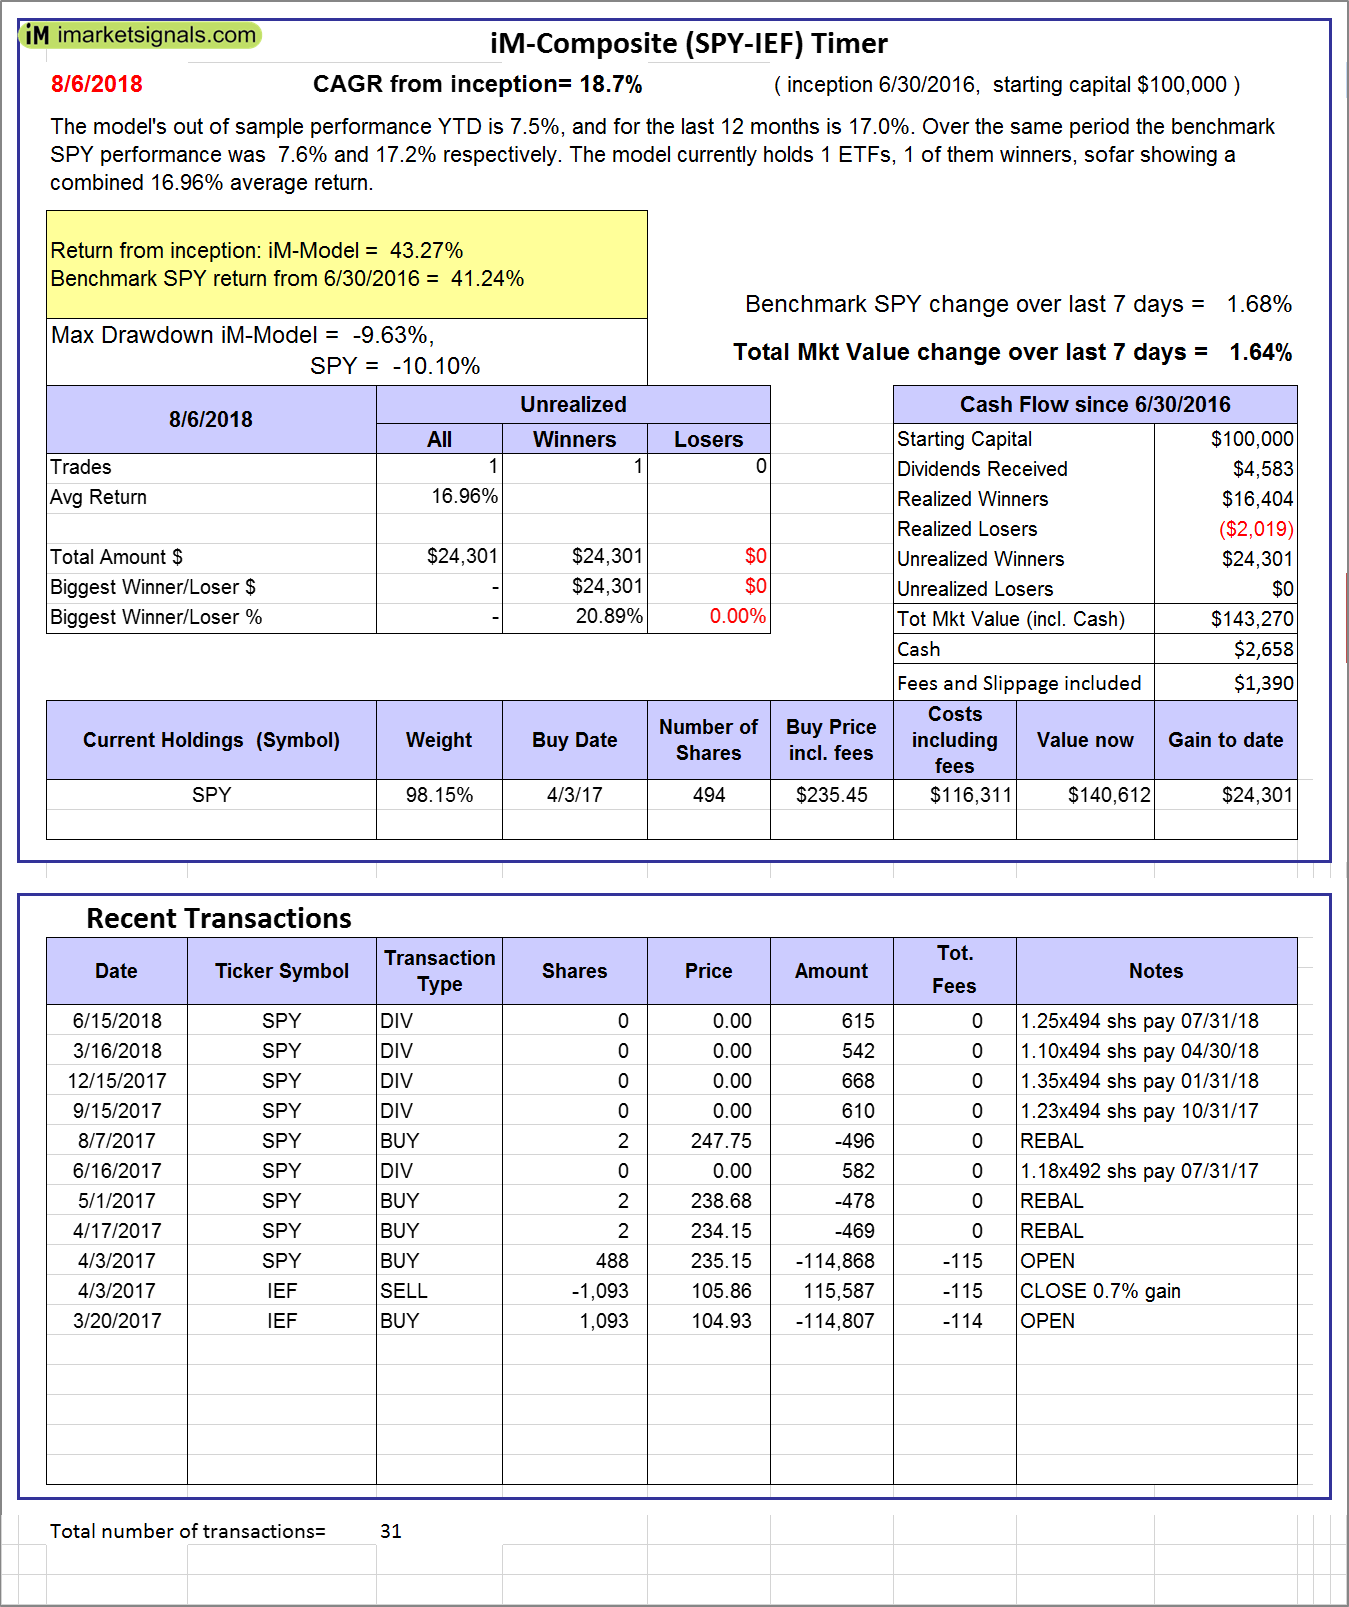
iM-Composite (SPY-IEF) Timer: The model’s out of sample performance YTD is 7.5%, and for the last 12 months is 17.0%. Over the same period the benchmark SPY performance was 7.6% and 17.2% respectively. Over the previous week the market value of the iM-Composite (SPY-IEF) Timer gained 1.64% at a time when SPY gained 1.68%. A starting capital of $100,000 at inception on 6/30/2016 would have grown to $143,270 which includes $2,658 cash and excludes $1,390 spent on fees and slippage. |
|
|
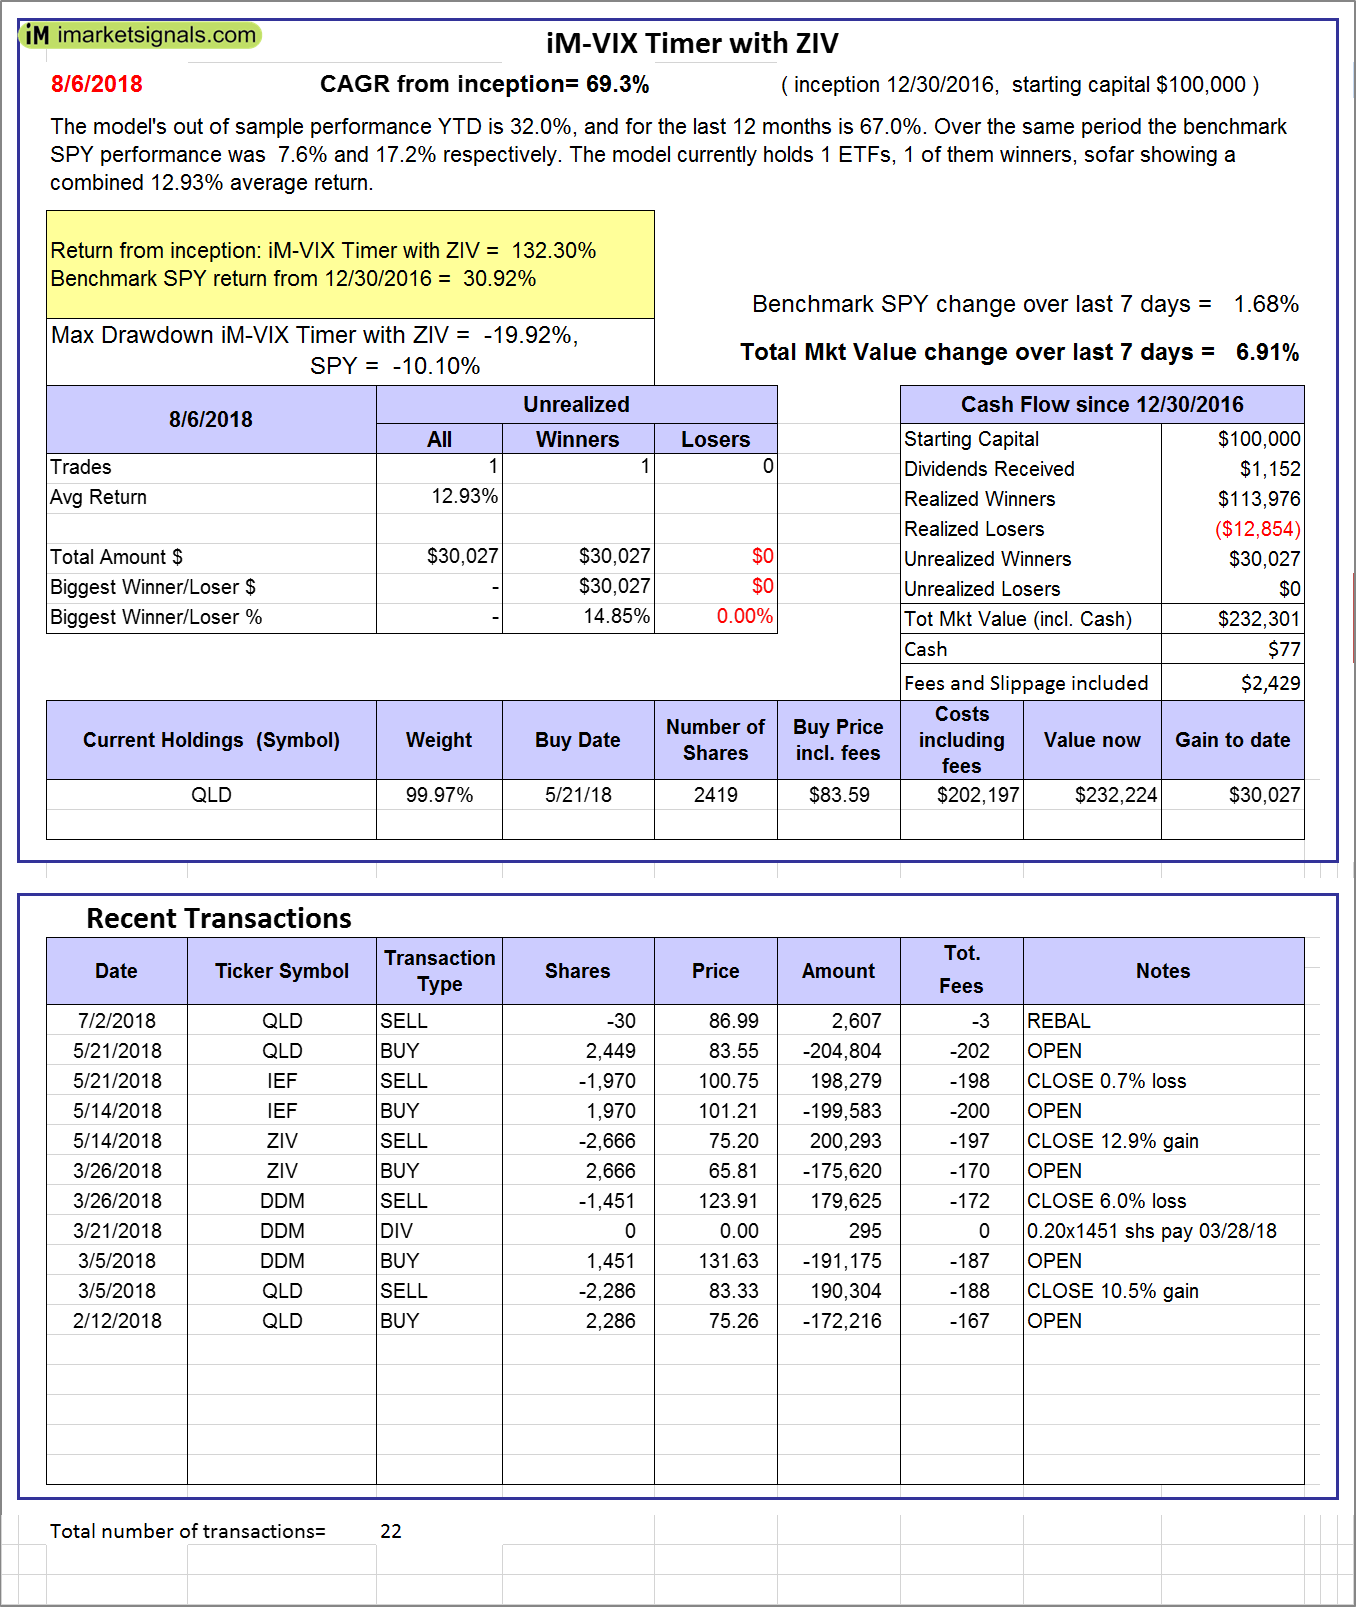
iM-VIX Timer with ZIV: The model’s out of sample performance YTD is 32.0%, and for the last 12 months is 67.0%. Over the same period the benchmark SPY performance was 7.6% and 17.2% respectively. Over the previous week the market value of the iM-VIX Timer with ZIV gained 6.91% at a time when SPY gained 1.68%. A starting capital of $100,000 at inception on 6/30/2016 would have grown to $232,301 which includes $77 cash and excludes $2,429 spent on fees and slippage. |
|
|
iM-Composite(Gold-Stocks-Bond) Timer: The model’s out of sample performance YTD is -7.5%, and for the last 12 months is -4.4%. Over the same period the benchmark SPY performance was 7.6% and 17.2% respectively. Over the previous week the market value of the iM-Composite(Gold-Stocks-Bond) Timer gained -1.17% at a time when SPY gained 1.68%. A starting capital of $100,000 at inception on 6/30/2016 would have grown to $119,084 which includes $100 cash and excludes $1,955 spent on fees and slippage. |
|
|
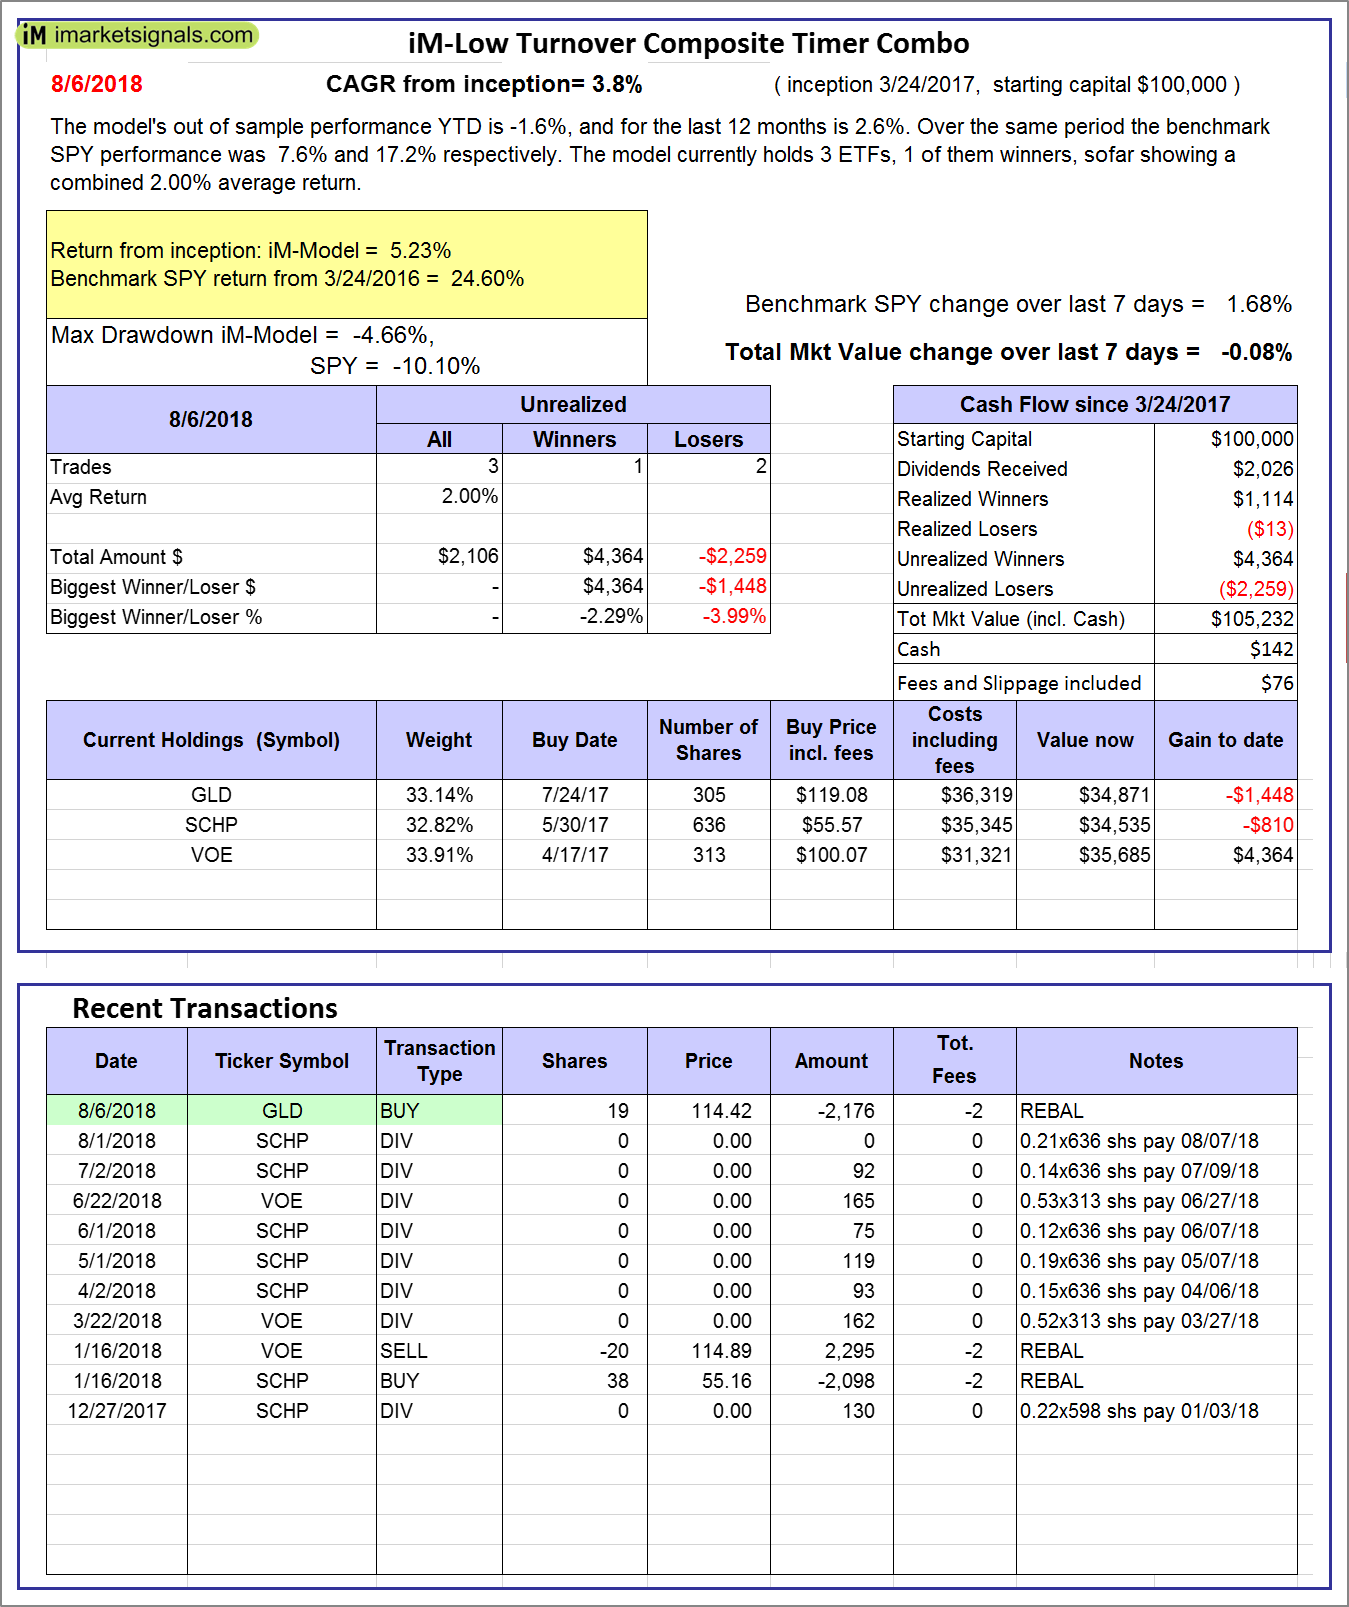
iM-Low Turnover Composite Timer Combo: The model’s out of sample performance YTD is -1.6%, and for the last 12 months is 2.6%. Over the same period the benchmark SPY performance was 7.6% and 17.2% respectively. Over the previous week the market value of the iM-Low Turnover Composite Timer Combo gained -0.08% at a time when SPY gained 1.68%. A starting capital of $100,000 at inception on 3/24/27 would have grown to $105,232 which includes $142 cash and excludes $76 spent on fees and slippage. |
|
|
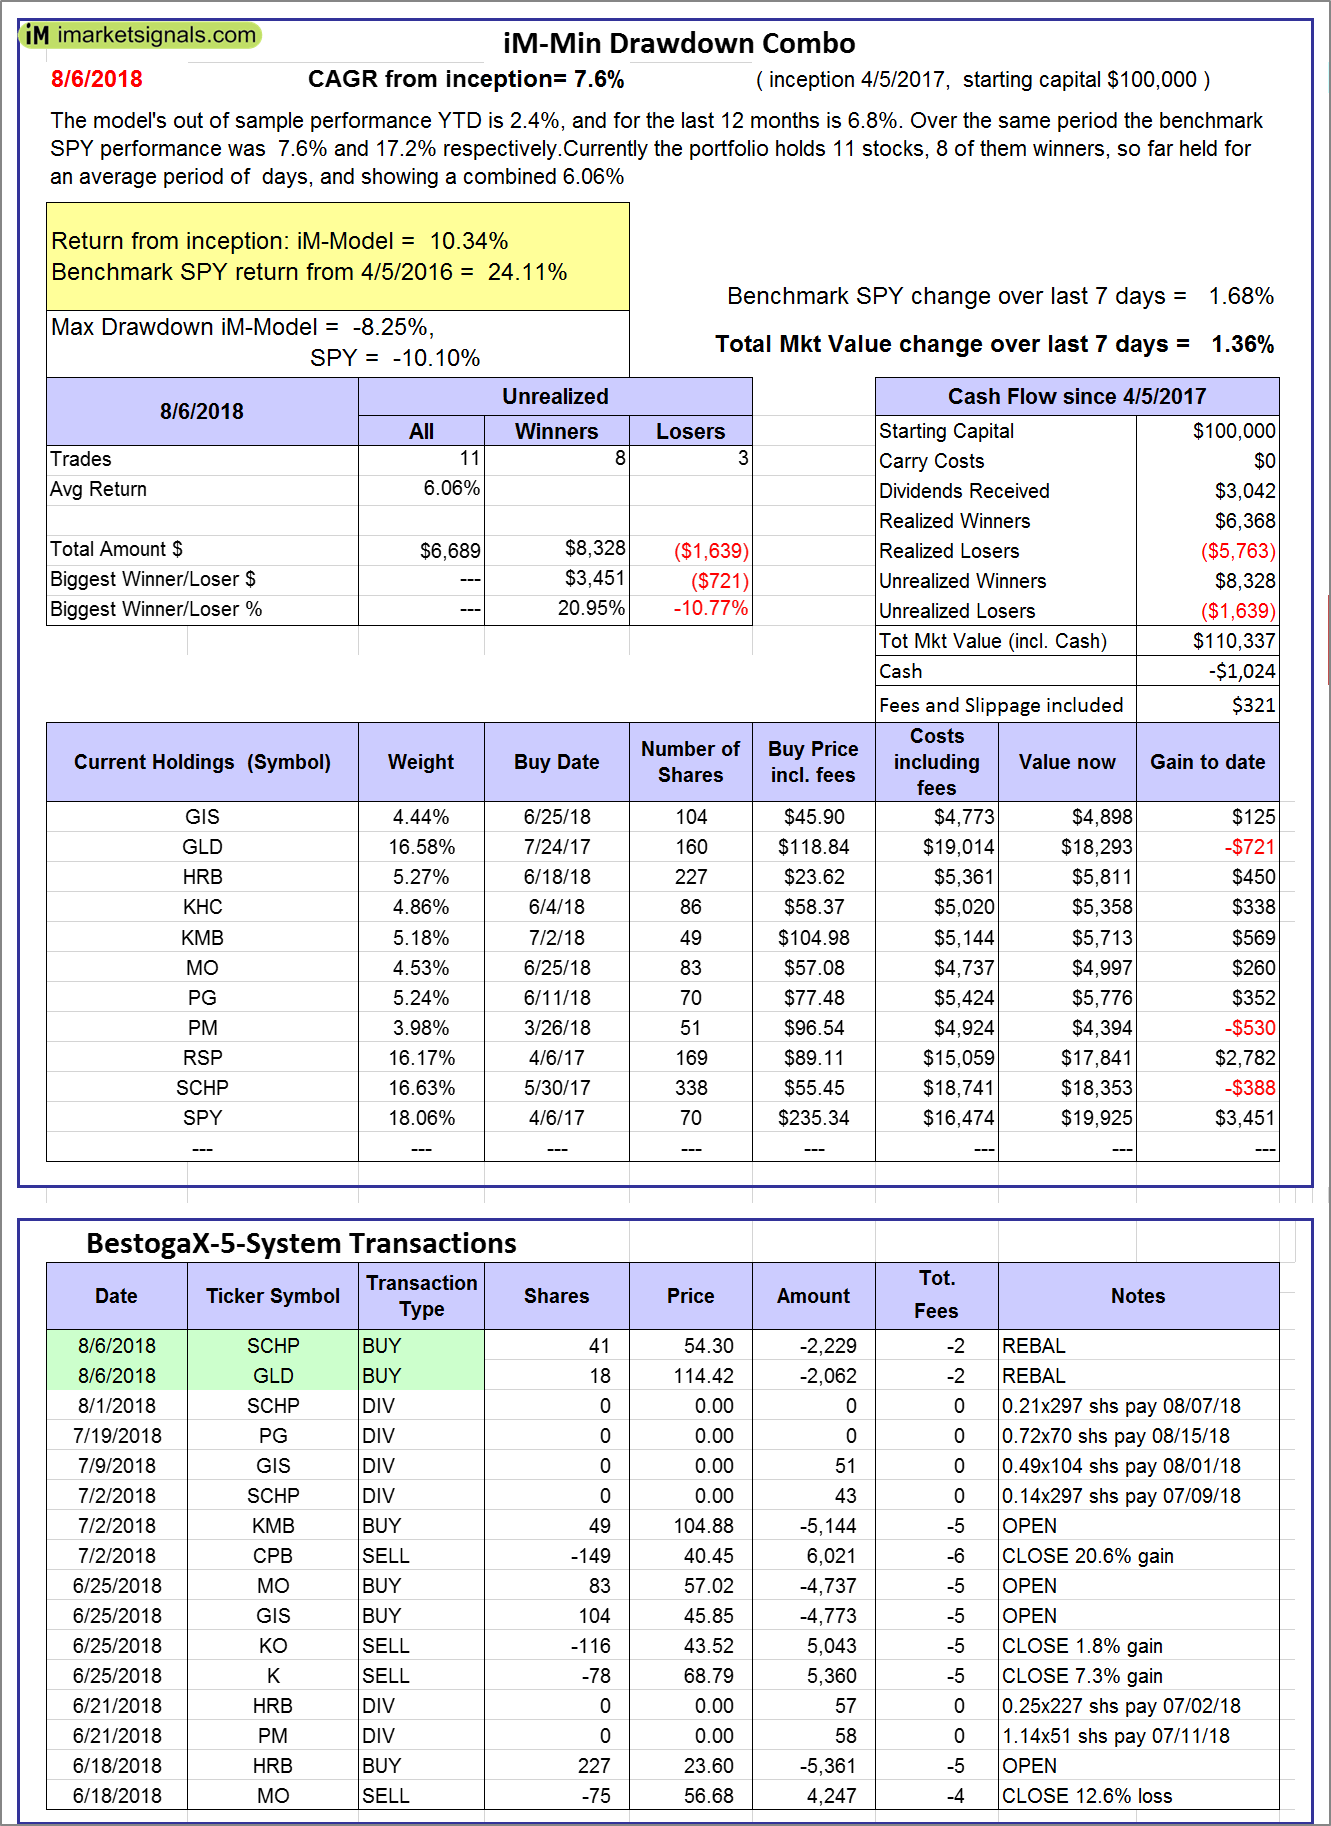
iM-Min Drawdown Combo: The model’s out of sample performance YTD is 2.4%, and for the last 12 months is 6.8%. Over the same period the benchmark SPY performance was 7.6% and 17.2% respectively. Over the previous week the market value of the iM-Min Drawdown Combo gained 1.36% at a time when SPY gained 1.68%. A starting capital of $100,000 at inception on 4/5/2017 would have grown to $110,337 which includes -$1,024 cash and excludes $321 spent on fees and slippage. |
|
|
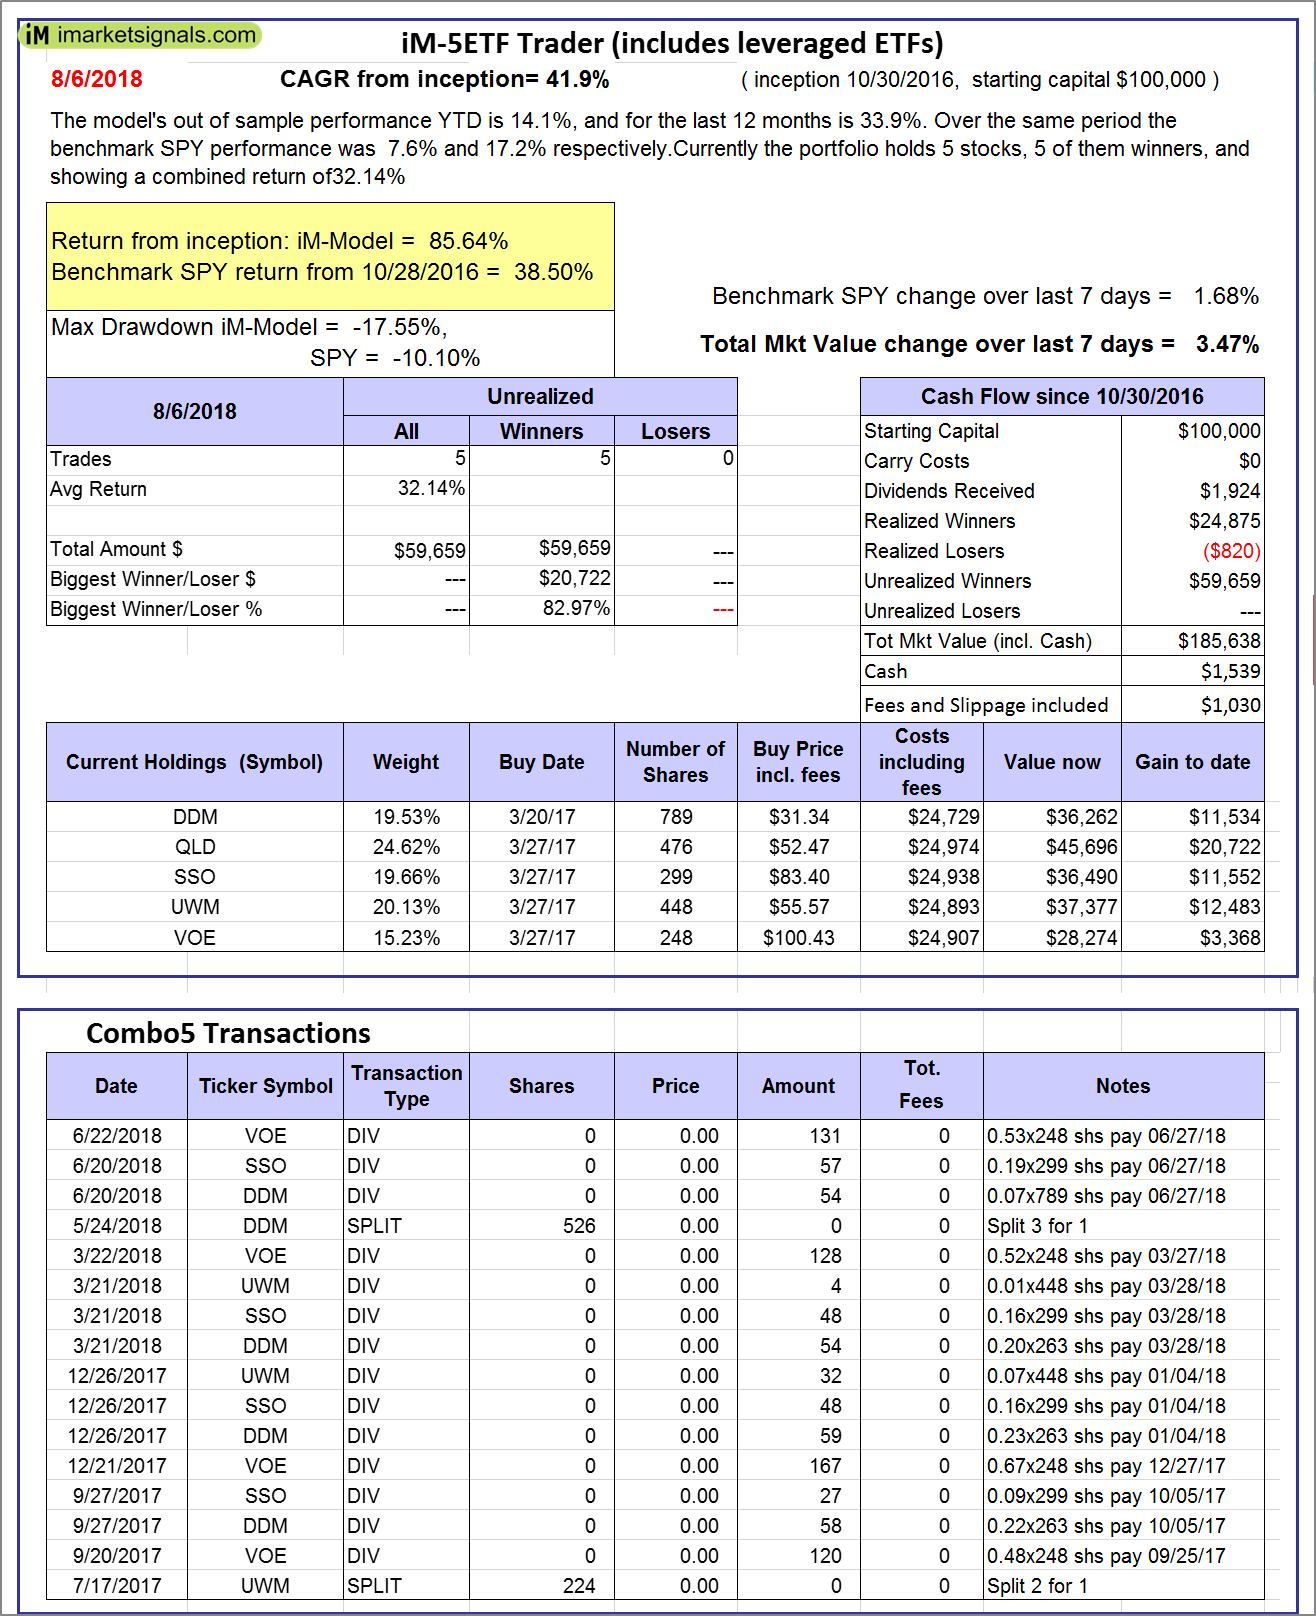
iM-5ETF Trader (includes leveraged ETFs): The model’s out of sample performance YTD is 14.1%, and for the last 12 months is 33.9%. Over the same period the benchmark SPY performance was 7.6% and 17.2% respectively. Over the previous week the market value of the iM-5ETF Trader (includes leveraged ETFs) gained 3.47% at a time when SPY gained 1.68%. A starting capital of $100,000 at inception on 10/30/2016 would have grown to $185,638 which includes $1,539 cash and excludes $1,030 spent on fees and slippage. |
|
|
iM-Standard 5ETF Trader (excludes leveraged ETFs): The model’s out of sample performance YTD is 6.2%, and for the last 12 months is 15.7%. Over the same period the benchmark SPY performance was 7.6% and 17.2% respectively. Over the previous week the market value of the iM-Standard 5ETF Trader (excludes leveraged ETFs) gained 1.40% at a time when SPY gained 1.68%. A starting capital of $100,000 at inception on 10/30/2016 would have grown to $133,424 which includes $3,101 cash and excludes $880 spent on fees and slippage. |


Leave a Reply
You must be logged in to post a comment.