  |
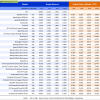
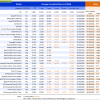
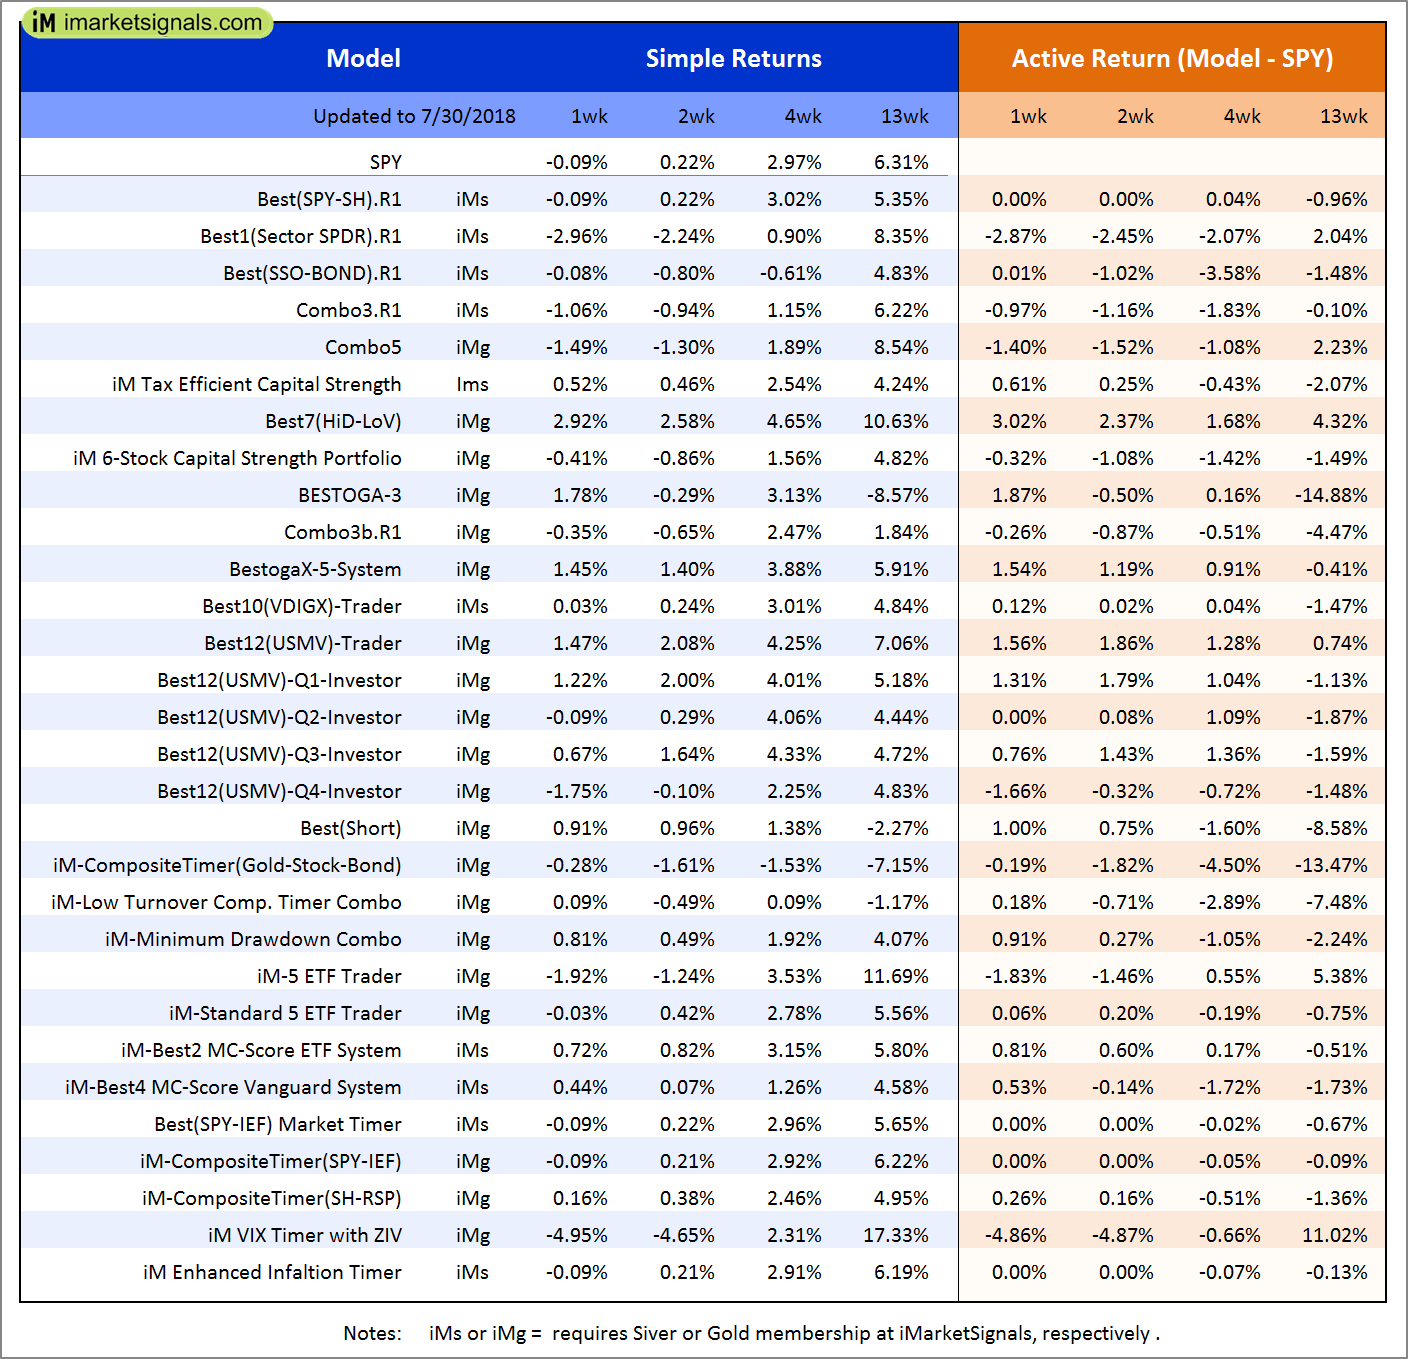
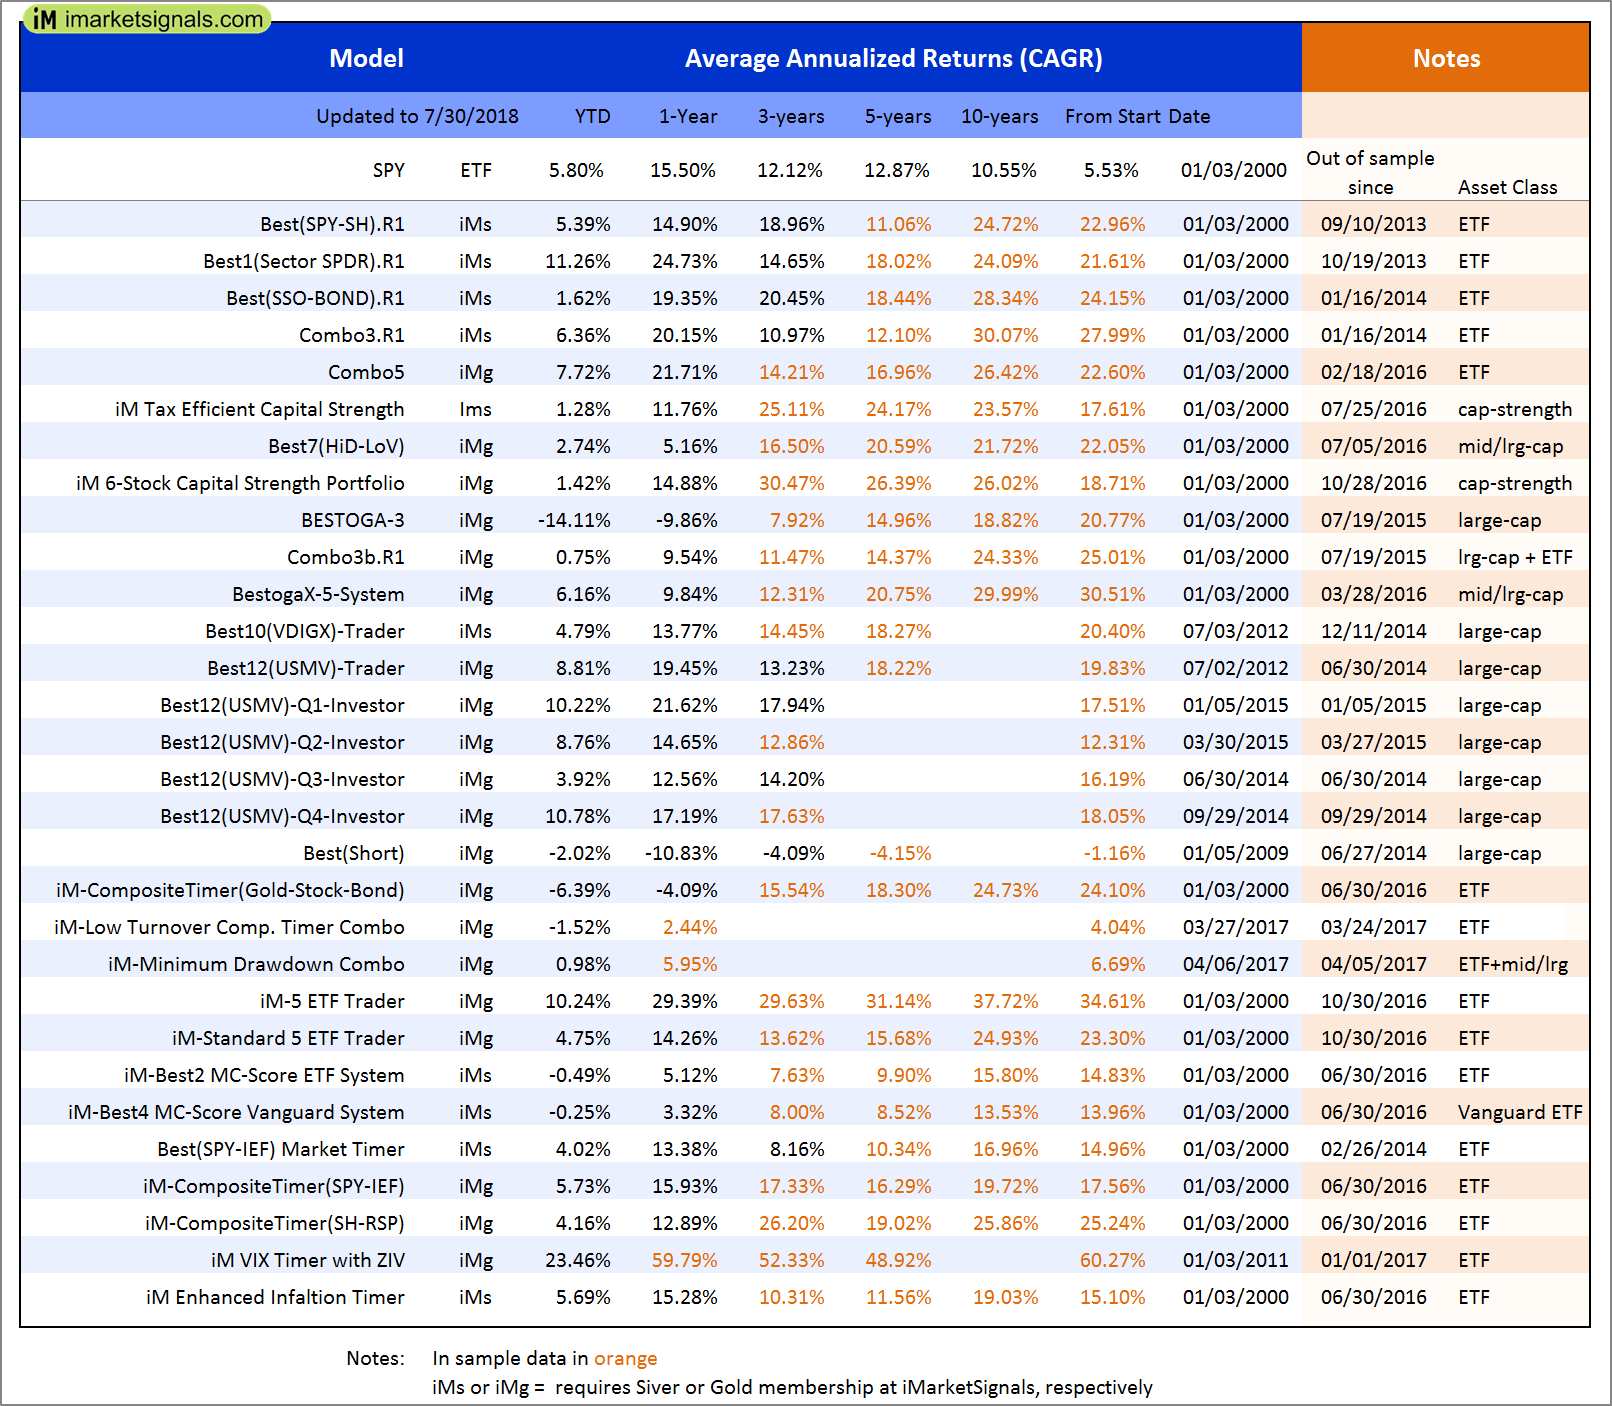
Out of sample performance summary of our models for the past 1, 2, 4 and 13 week periods. The active active return indicates how the models over- or underperformed the benchmark ETF SPY. Also the YTD, and the 1-, 3-, 5- and 10-year annualized returns are shown in the second table |
|
|
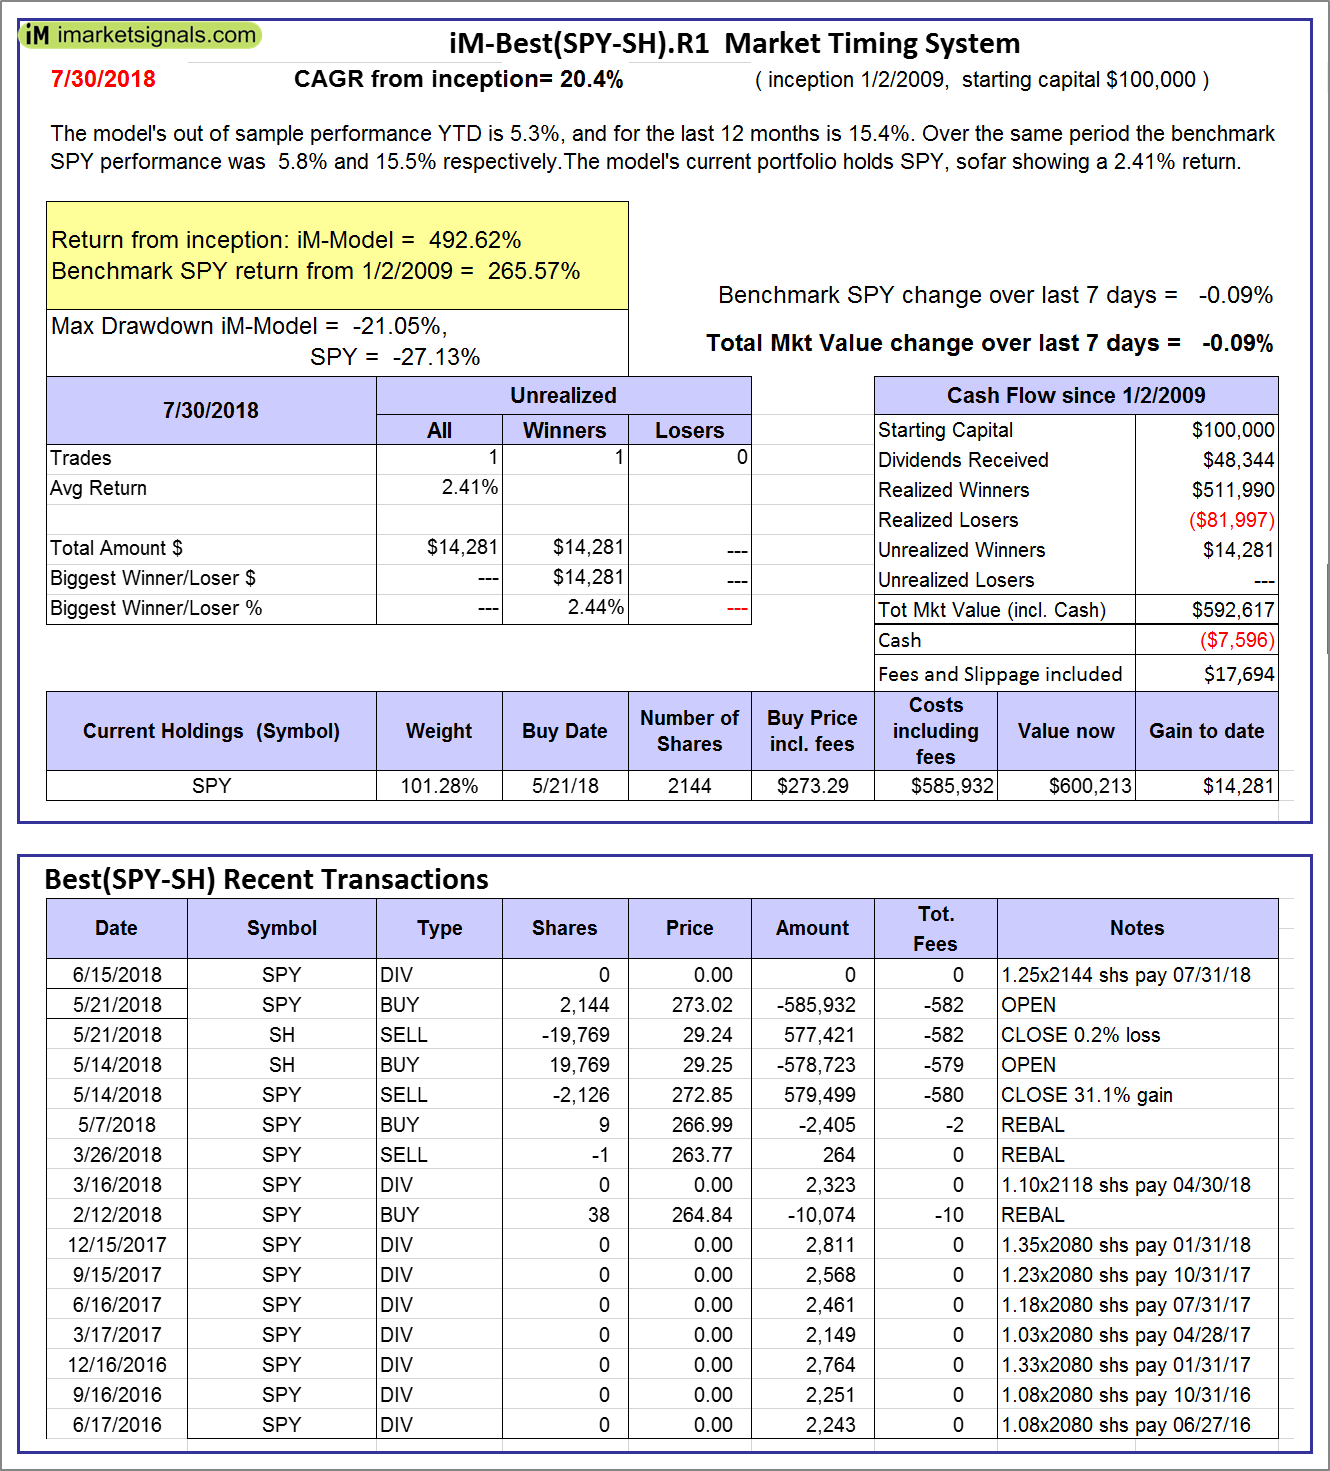
iM-Best(SPY-SH).R1: The model’s out of sample performance YTD is 5.3%, and for the last 12 months is 15.4%. Over the same period the benchmark SPY performance was 5.8% and 15.5% respectively. Over the previous week the market value of Best(SPY-SH) gained -0.09% at a time when SPY gained -0.09%. A starting capital of $100,000 at inception on 1/2/2009 would have grown to $592,617 which includes -$7,596 cash and excludes $17,694 spent on fees and slippage. |
|
|
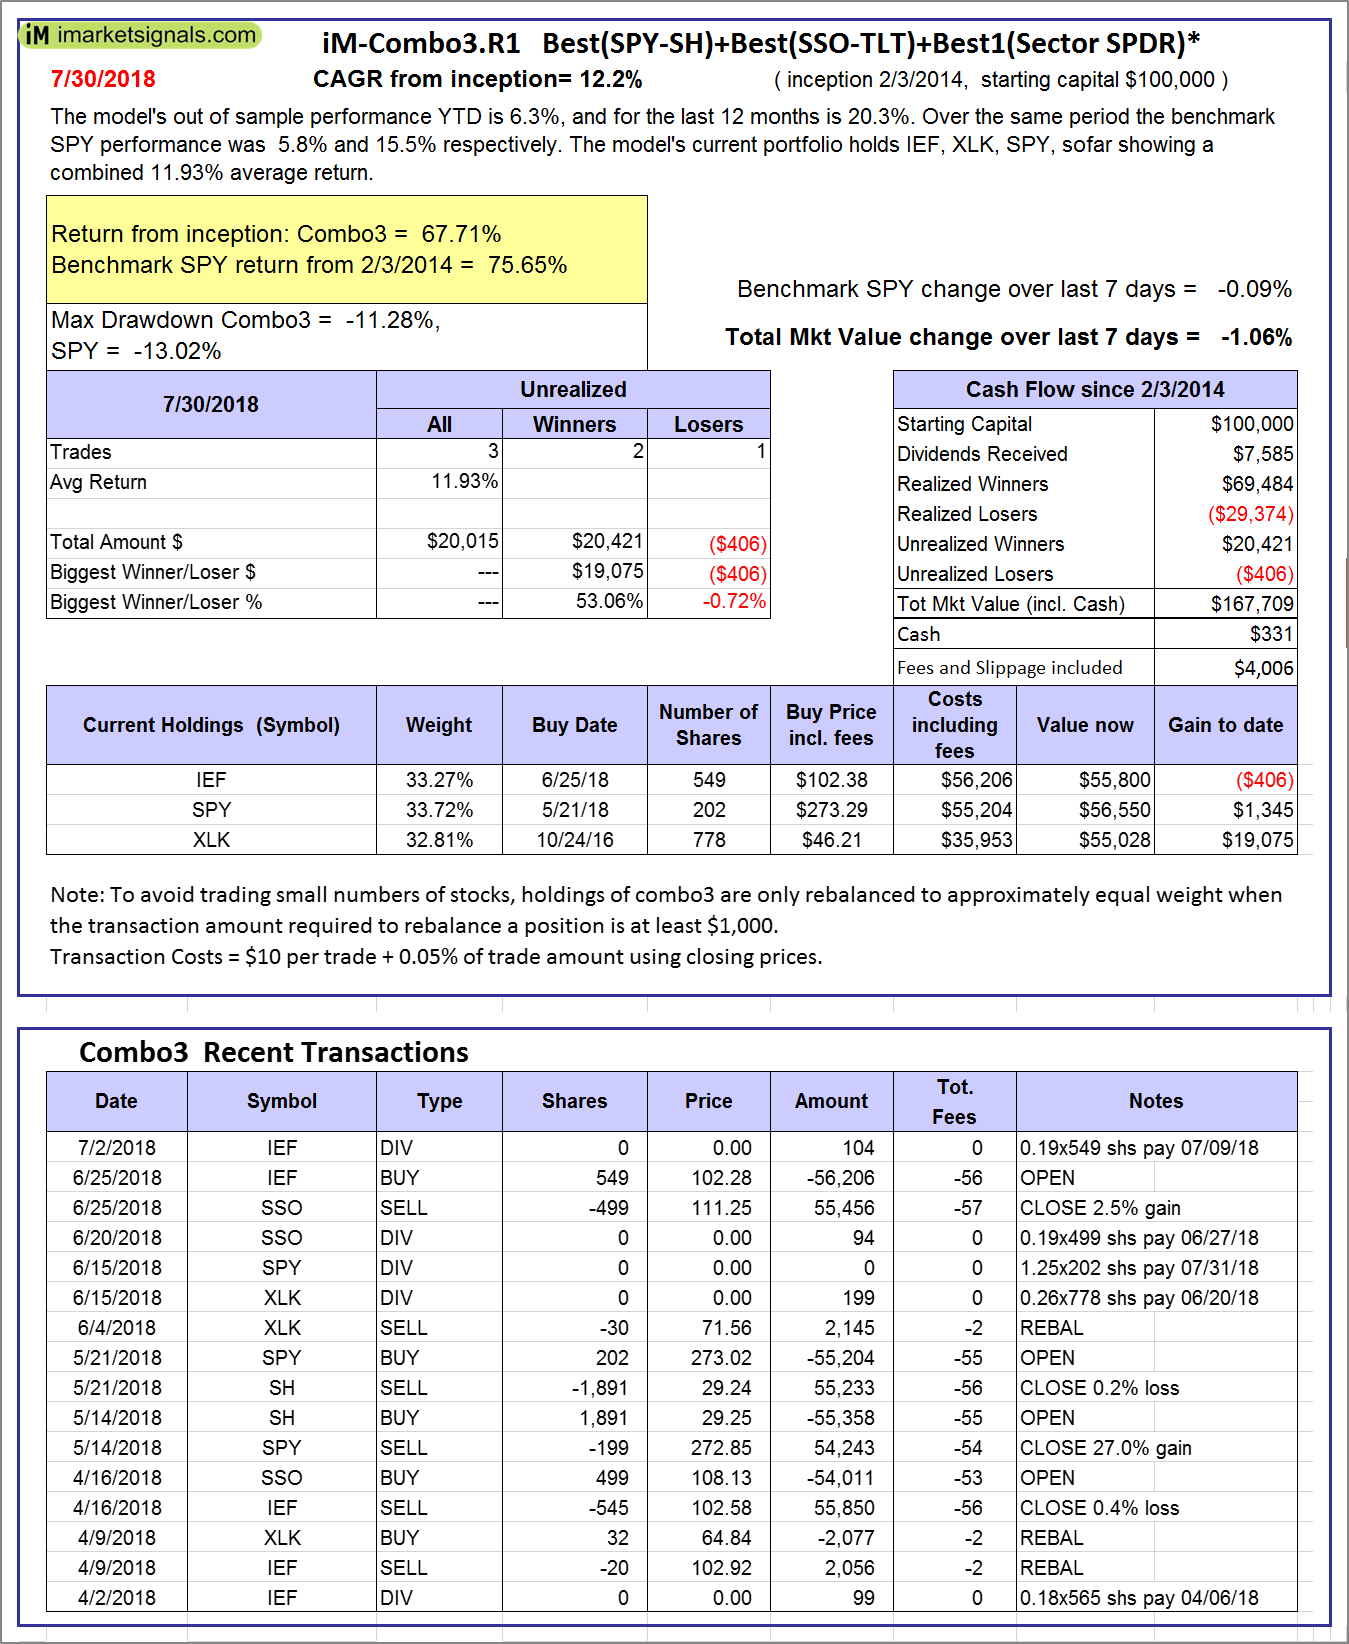
iM-Combo3.R1: The model’s out of sample performance YTD is 6.3%, and for the last 12 months is 20.3%. Over the same period the benchmark SPY performance was 5.8% and 15.5% respectively. Over the previous week the market value of iM-Combo3.R1 gained -1.06% at a time when SPY gained -0.09%. A starting capital of $100,000 at inception on 2/3/2014 would have grown to $167,709 which includes $331 cash and excludes $4,006 spent on fees and slippage. |
|
|
iM-Combo5: The model’s out of sample performance YTD is 7.5%, and for the last 12 months is 21.7%. Over the same period the benchmark SPY performance was 5.8% and 15.5% respectively. Over the previous week the market value of iM-Combo5 gained -1.66% at a time when SPY gained -0.09%. A starting capital of $100,000 at inception on 2/22/2016 would have grown to $137,290 which includes $1,724 cash and excludes $983 spent on fees and slippage. |
|
|
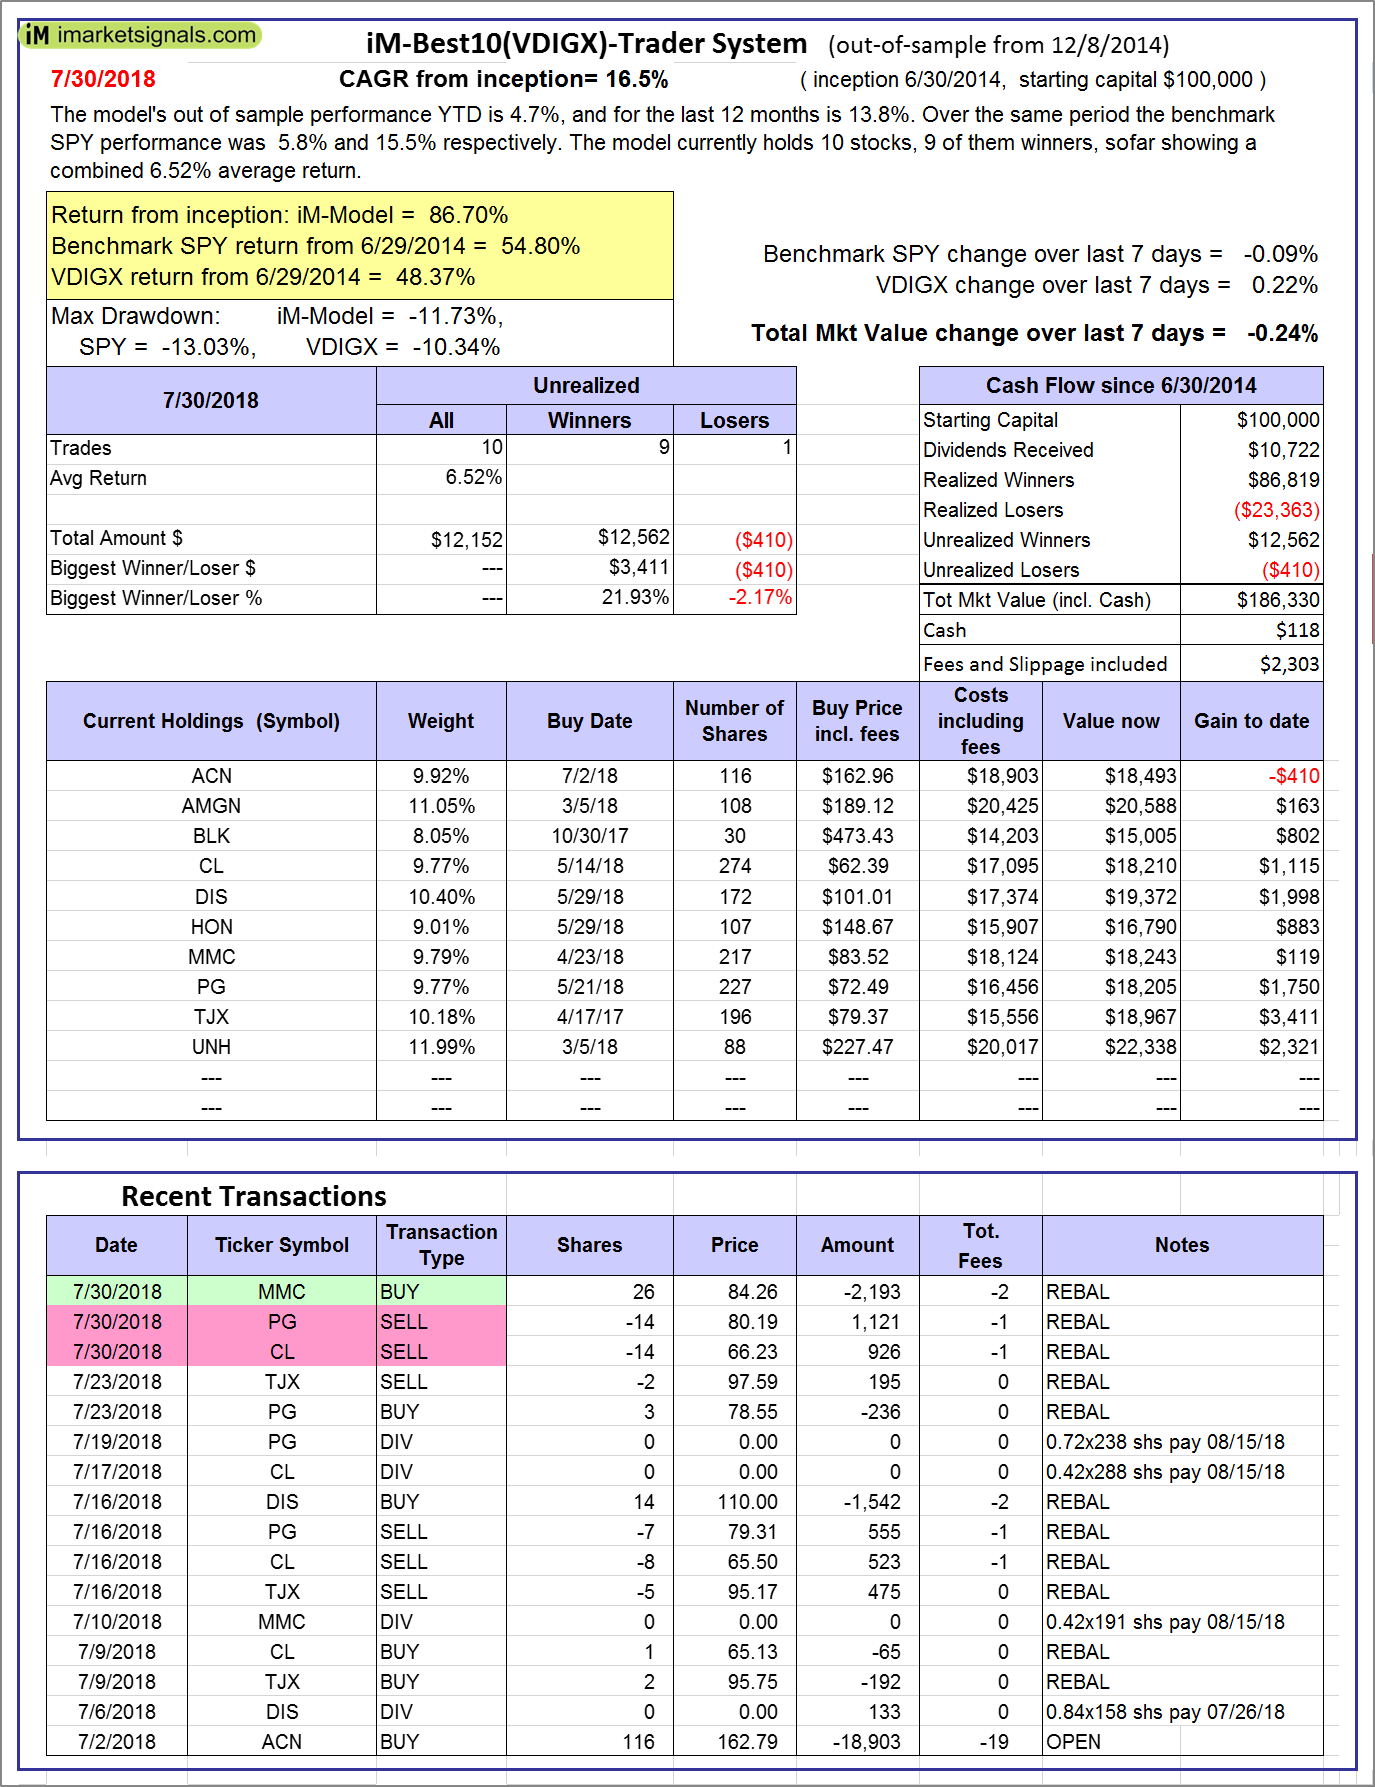
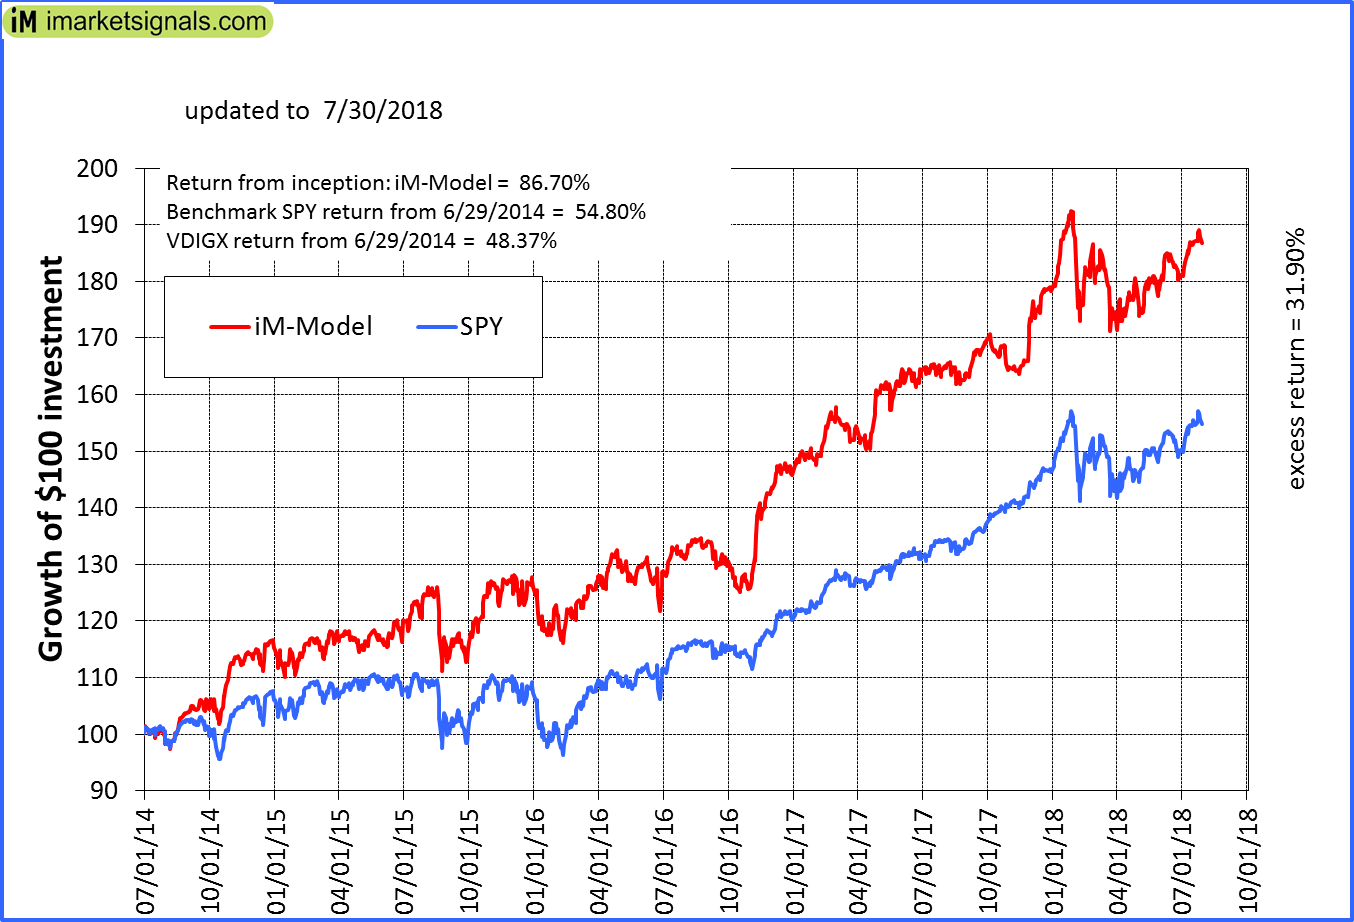
iM-Best10(VDIGX)-Trader: The model’s out of sample performance YTD is 4.7%, and for the last 12 months is 13.8%. Over the same period the benchmark SPY performance was 5.8% and 15.5% respectively. Since inception, on 7/1/2014, the model gained 86.70% while the benchmark SPY gained 54.80% and VDIGX gained 48.37% over the same period. Over the previous week the market value of iM-Best10(VDIGX) gained -0.24% at a time when SPY gained -0.09%. A starting capital of $100,000 at inception on 7/1/2014 would have grown to $186,330 which includes $118 cash and excludes $2,303 spent on fees and slippage. |
|
|
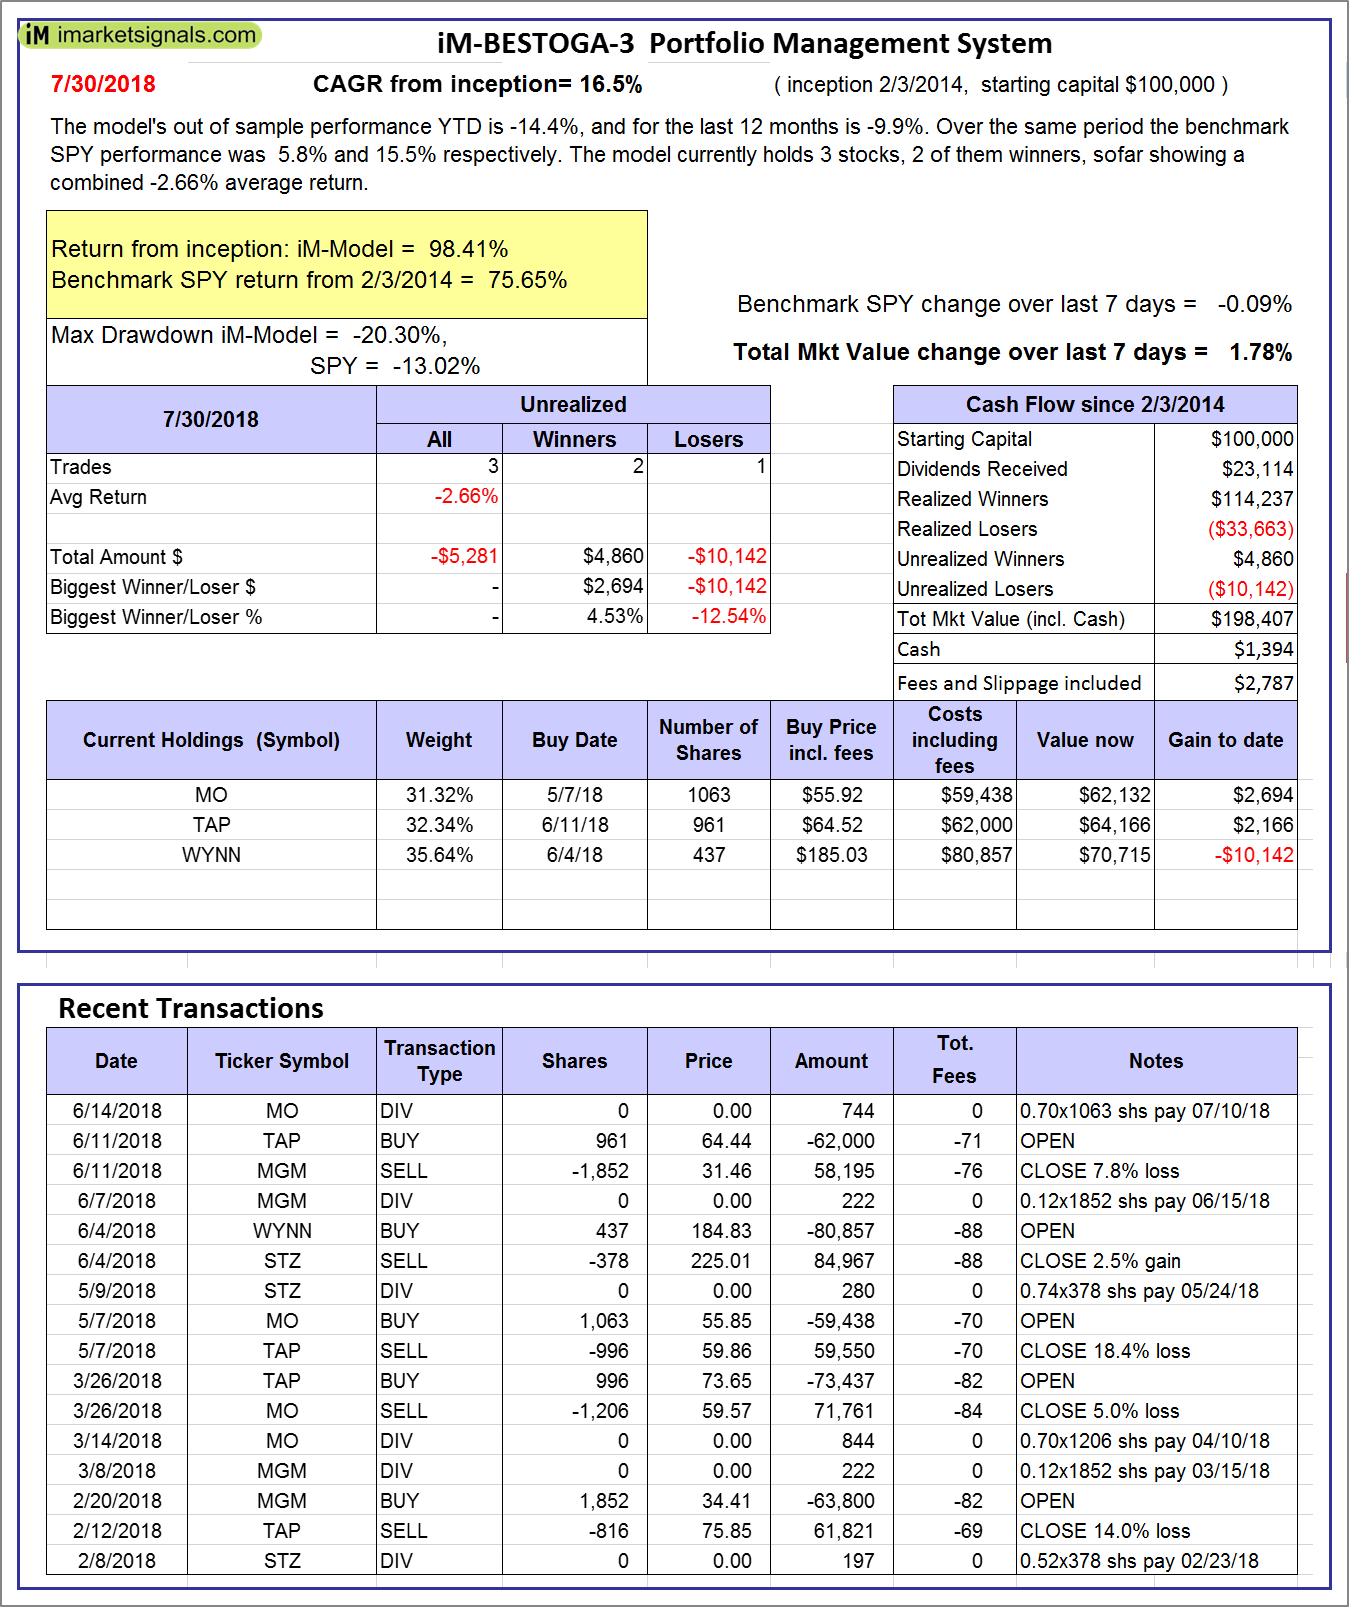
iM-BESTOGA-3: The model’s out of sample performance YTD is -14.4%, and for the last 12 months is -9.9%. Over the same period the benchmark SPY performance was 5.8% and 15.5% respectively. Over the previous week the market value of iM-BESTOGA-3 gained 1.78% at a time when SPY gained -0.09%. A starting capital of $100,000 at inception on 2/3/2014 would have grown to $198,407 which includes $1,394 cash and excludes $2,787 spent on fees and slippage. |
|
|
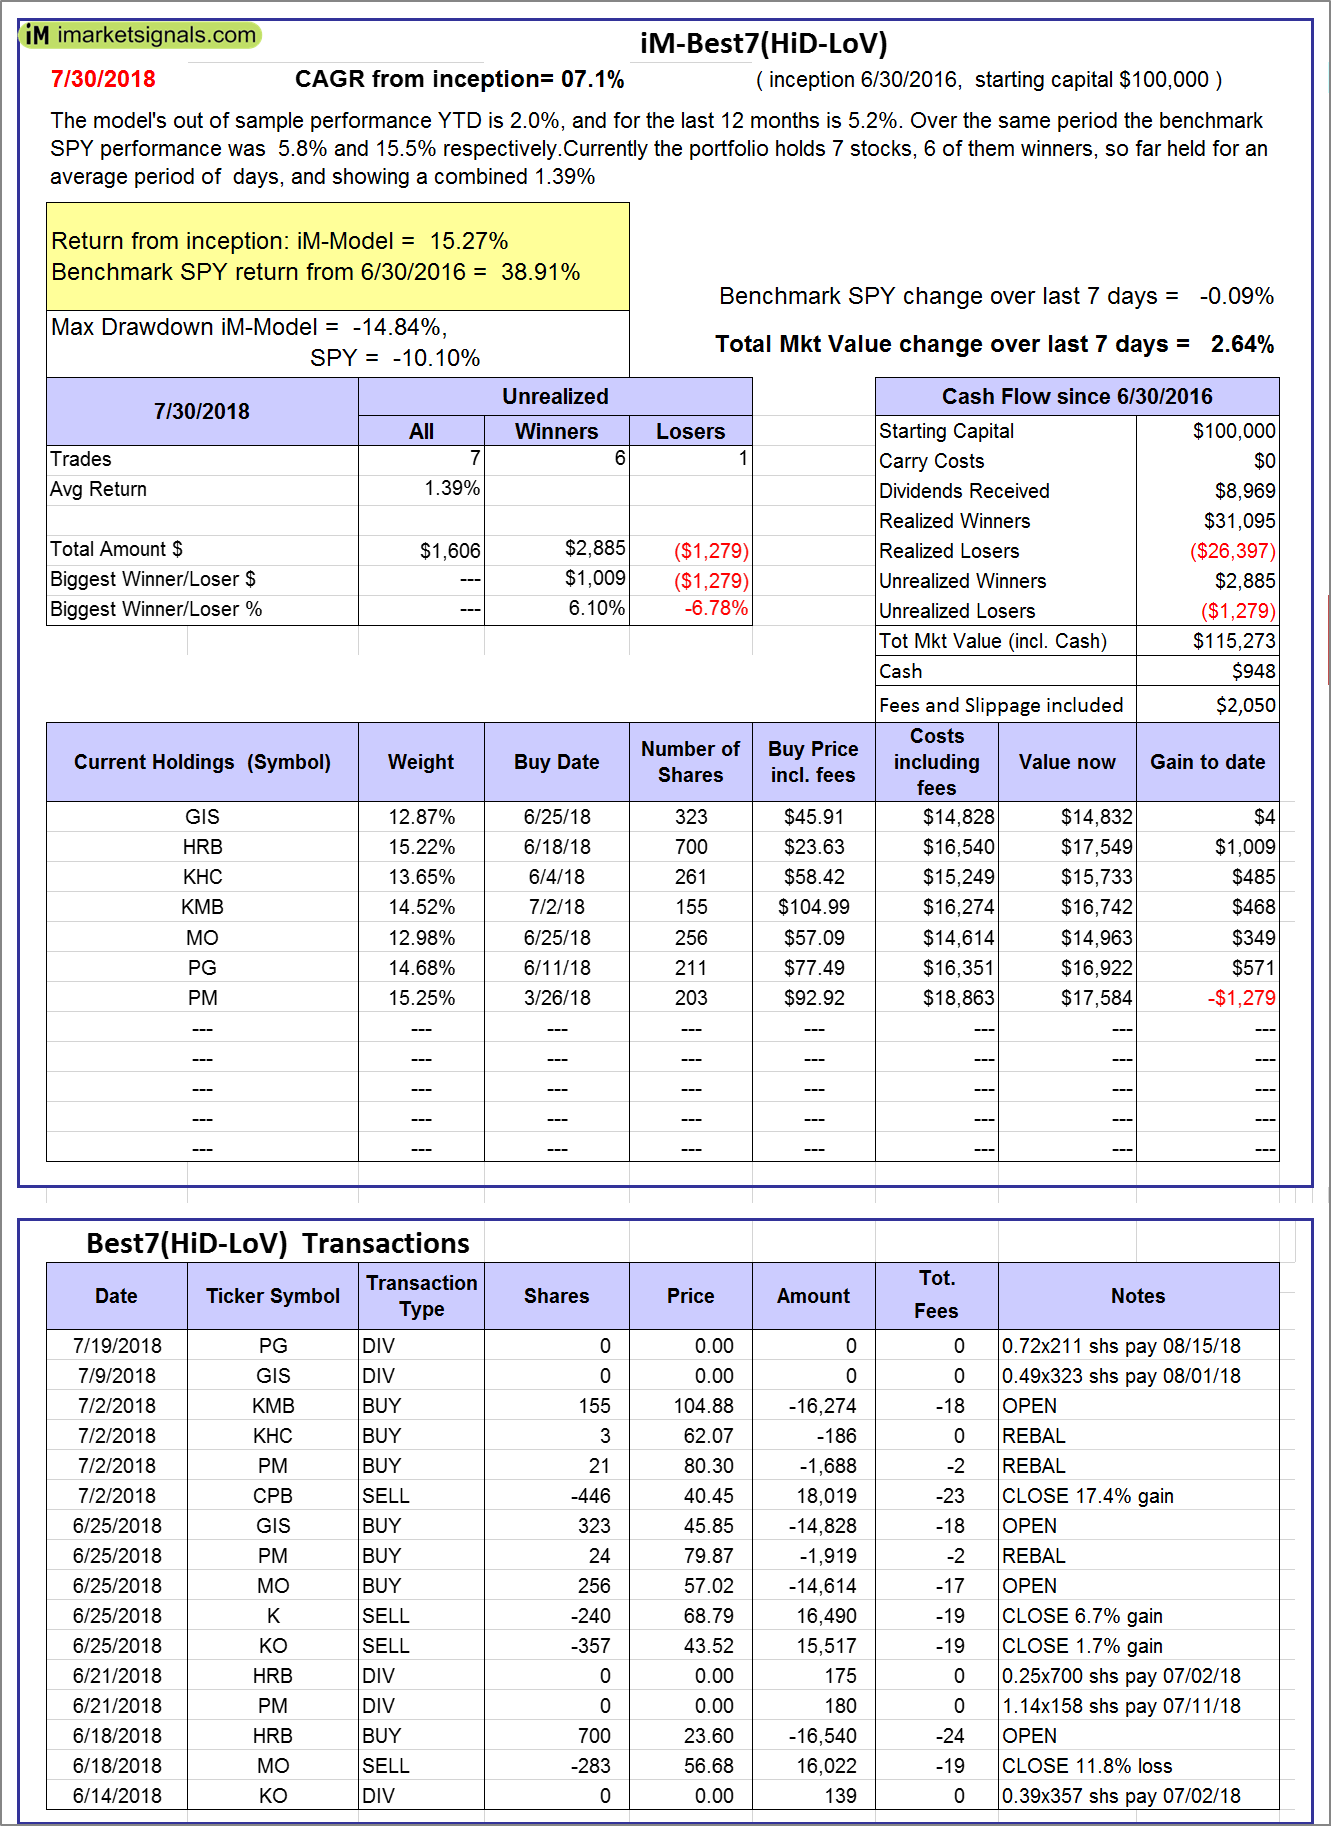
iM-Best7(HiD-LoV): The model’s out of sample performance YTD is 2.0%, and for the last 12 months is 5.2%. Over the same period the benchmark SPY performance was 5.8% and 15.5% respectively. Over the previous week the market value of iM-BESTOGA-3 gained 2.64% at a time when SPY gained -0.09%. A starting capital of $100,000 at inception on 6/30/2016 would have grown to $115,273 which includes $948 cash and excludes $2,050 spent on fees and slippage. |
|
|
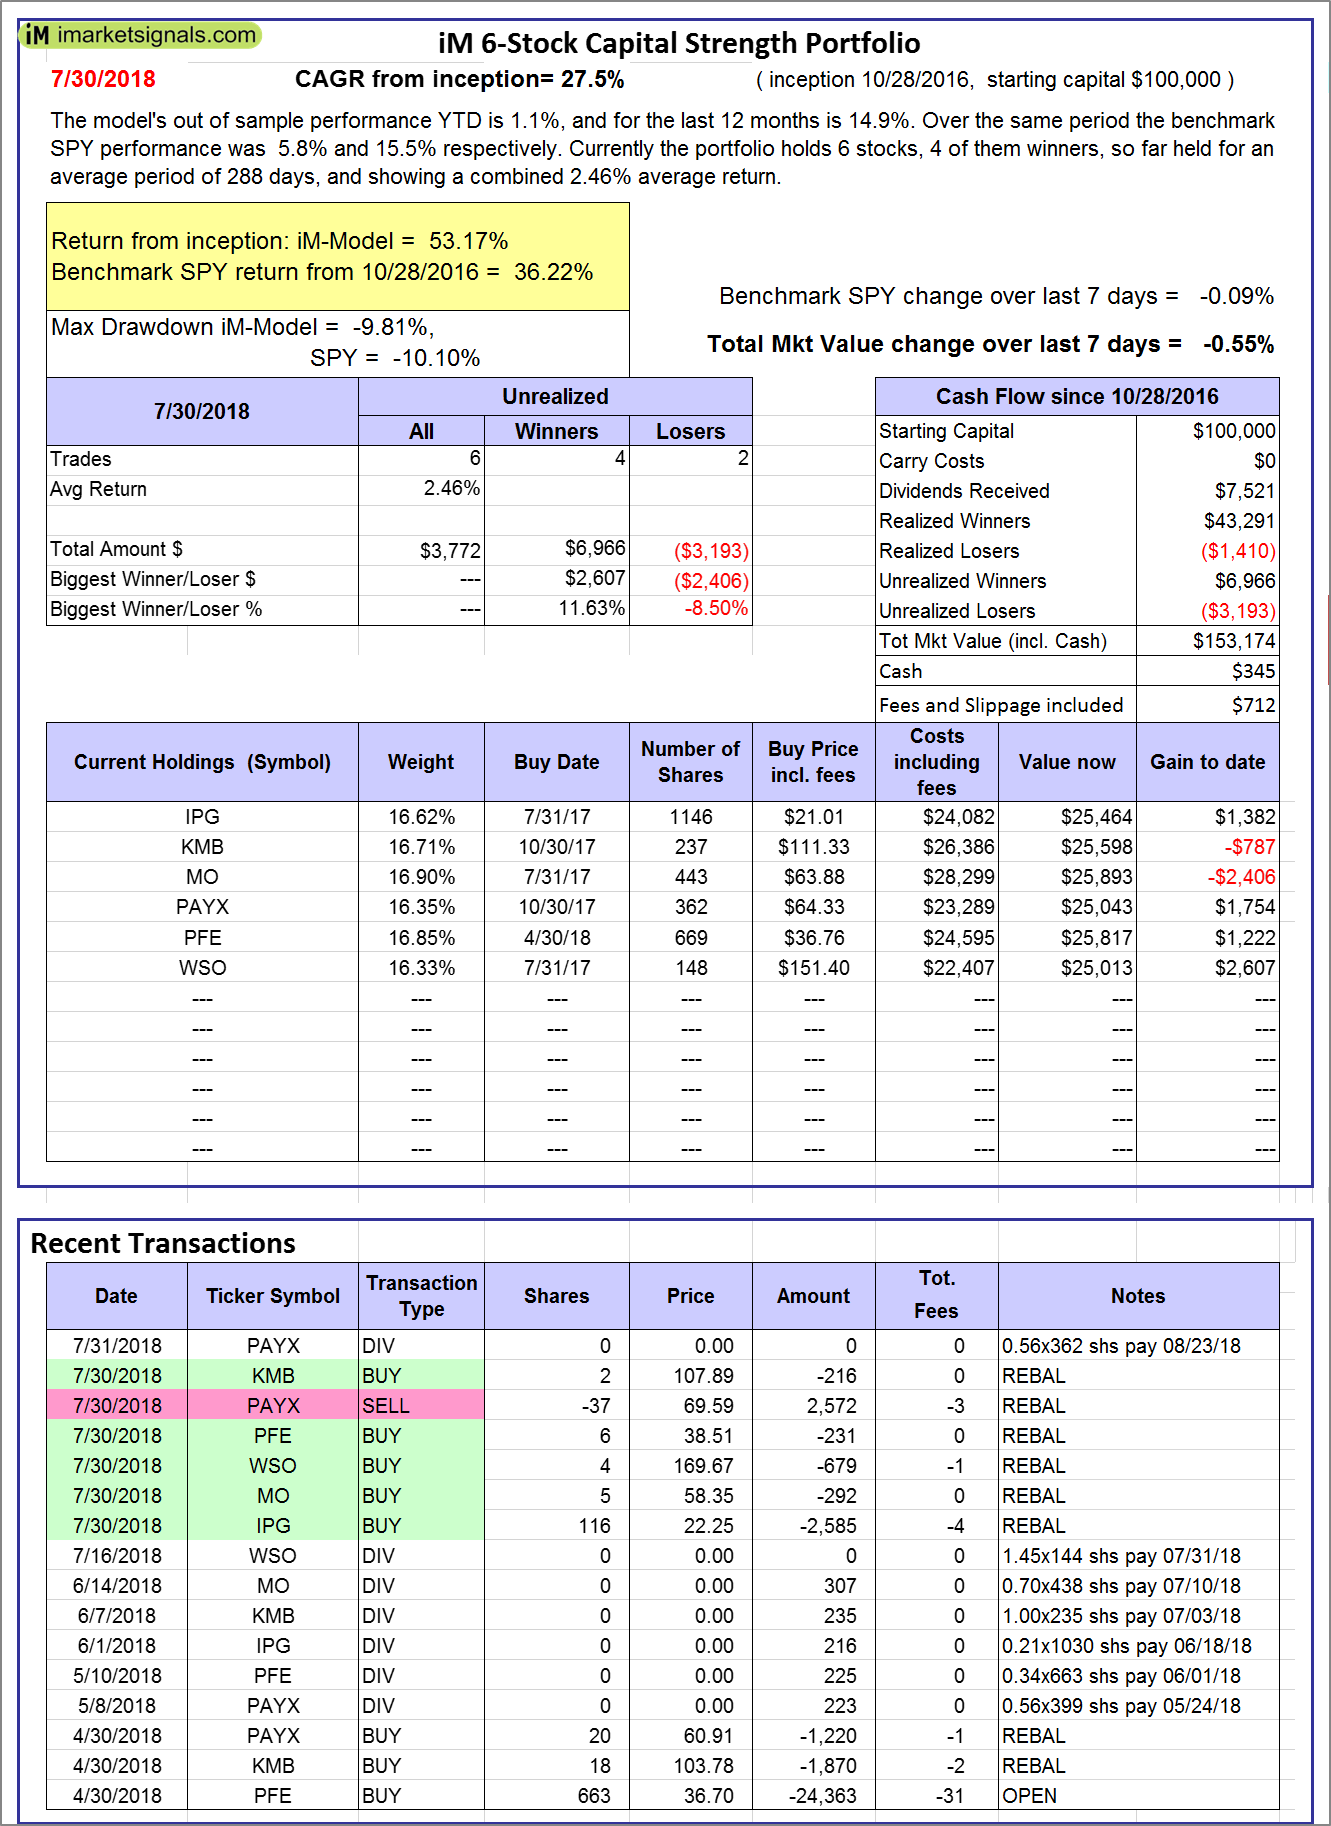
iM 6-Stock Capital Strength Portfolio: The model’s out of sample performance YTD is 1.1%, and for the last 12 months is 14.9%. Over the same period the benchmark SPY performance was 5.8% and 15.5% respectively. Over the previous week the market value of the iM 6-Stock Capital Strength Portfolio gained -0.55% at a time when SPY gained -0.09%. A starting capital of $100,000 at inception on 10/28/2016 would have grown to $153,174 which includes $345 cash and excludes $712 spent on fees and slippage. |
|
|
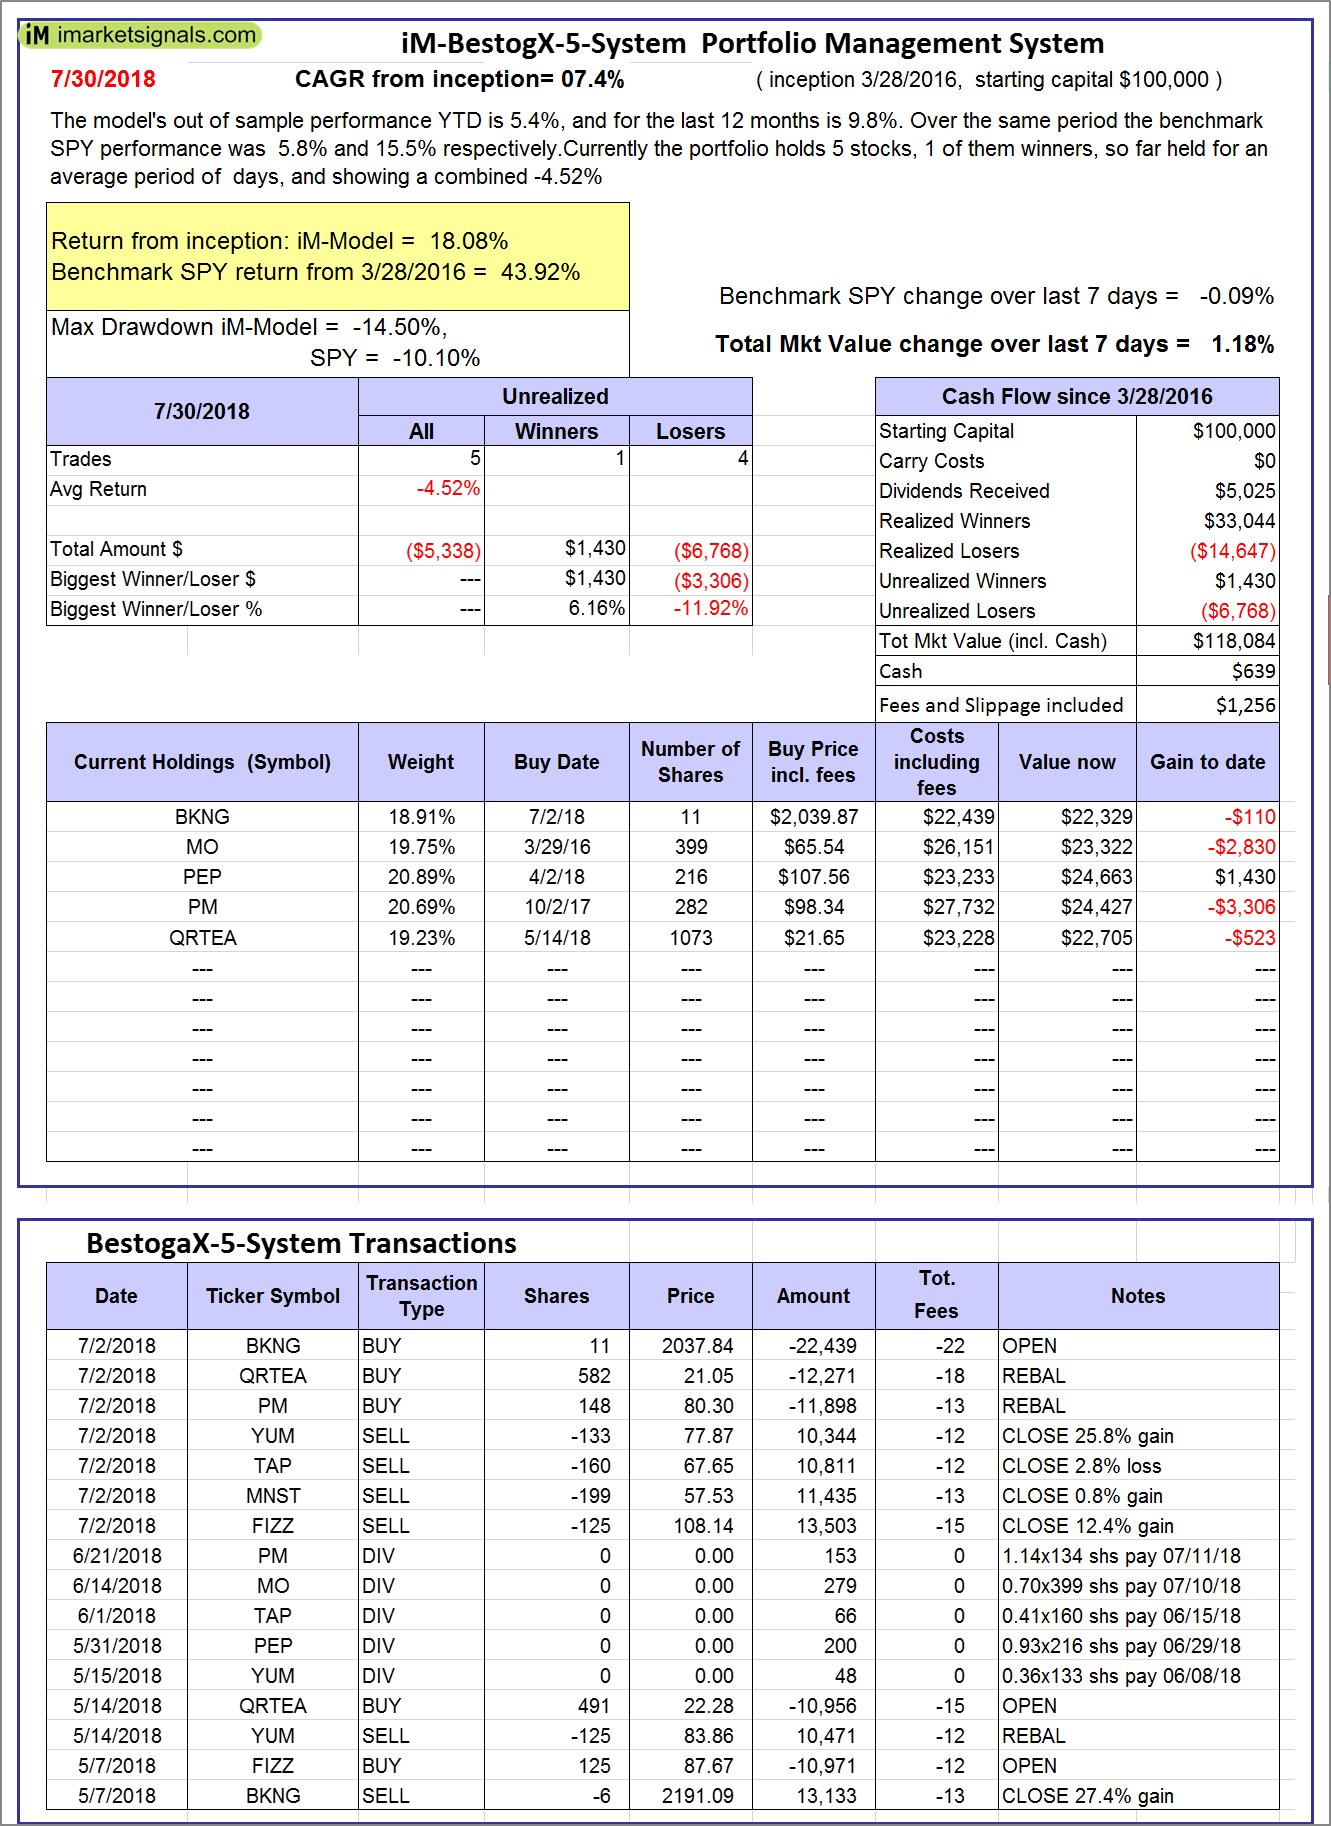
iM-BestogaX5-System: The model’s out of sample performance YTD is 5.4%, and for the last 12 months is 9.8%. Over the same period the benchmark SPY performance was 5.8% and 15.5% respectively. Over the previous week the market value of iM-BestogaX5-System gained 1.18% at a time when SPY gained -0.09%. A starting capital of $100,000 at inception on 3/28/2016 would have grown to $118,084 which includes $639 cash and excludes $1,256 spent on fees and slippage. |
|
|
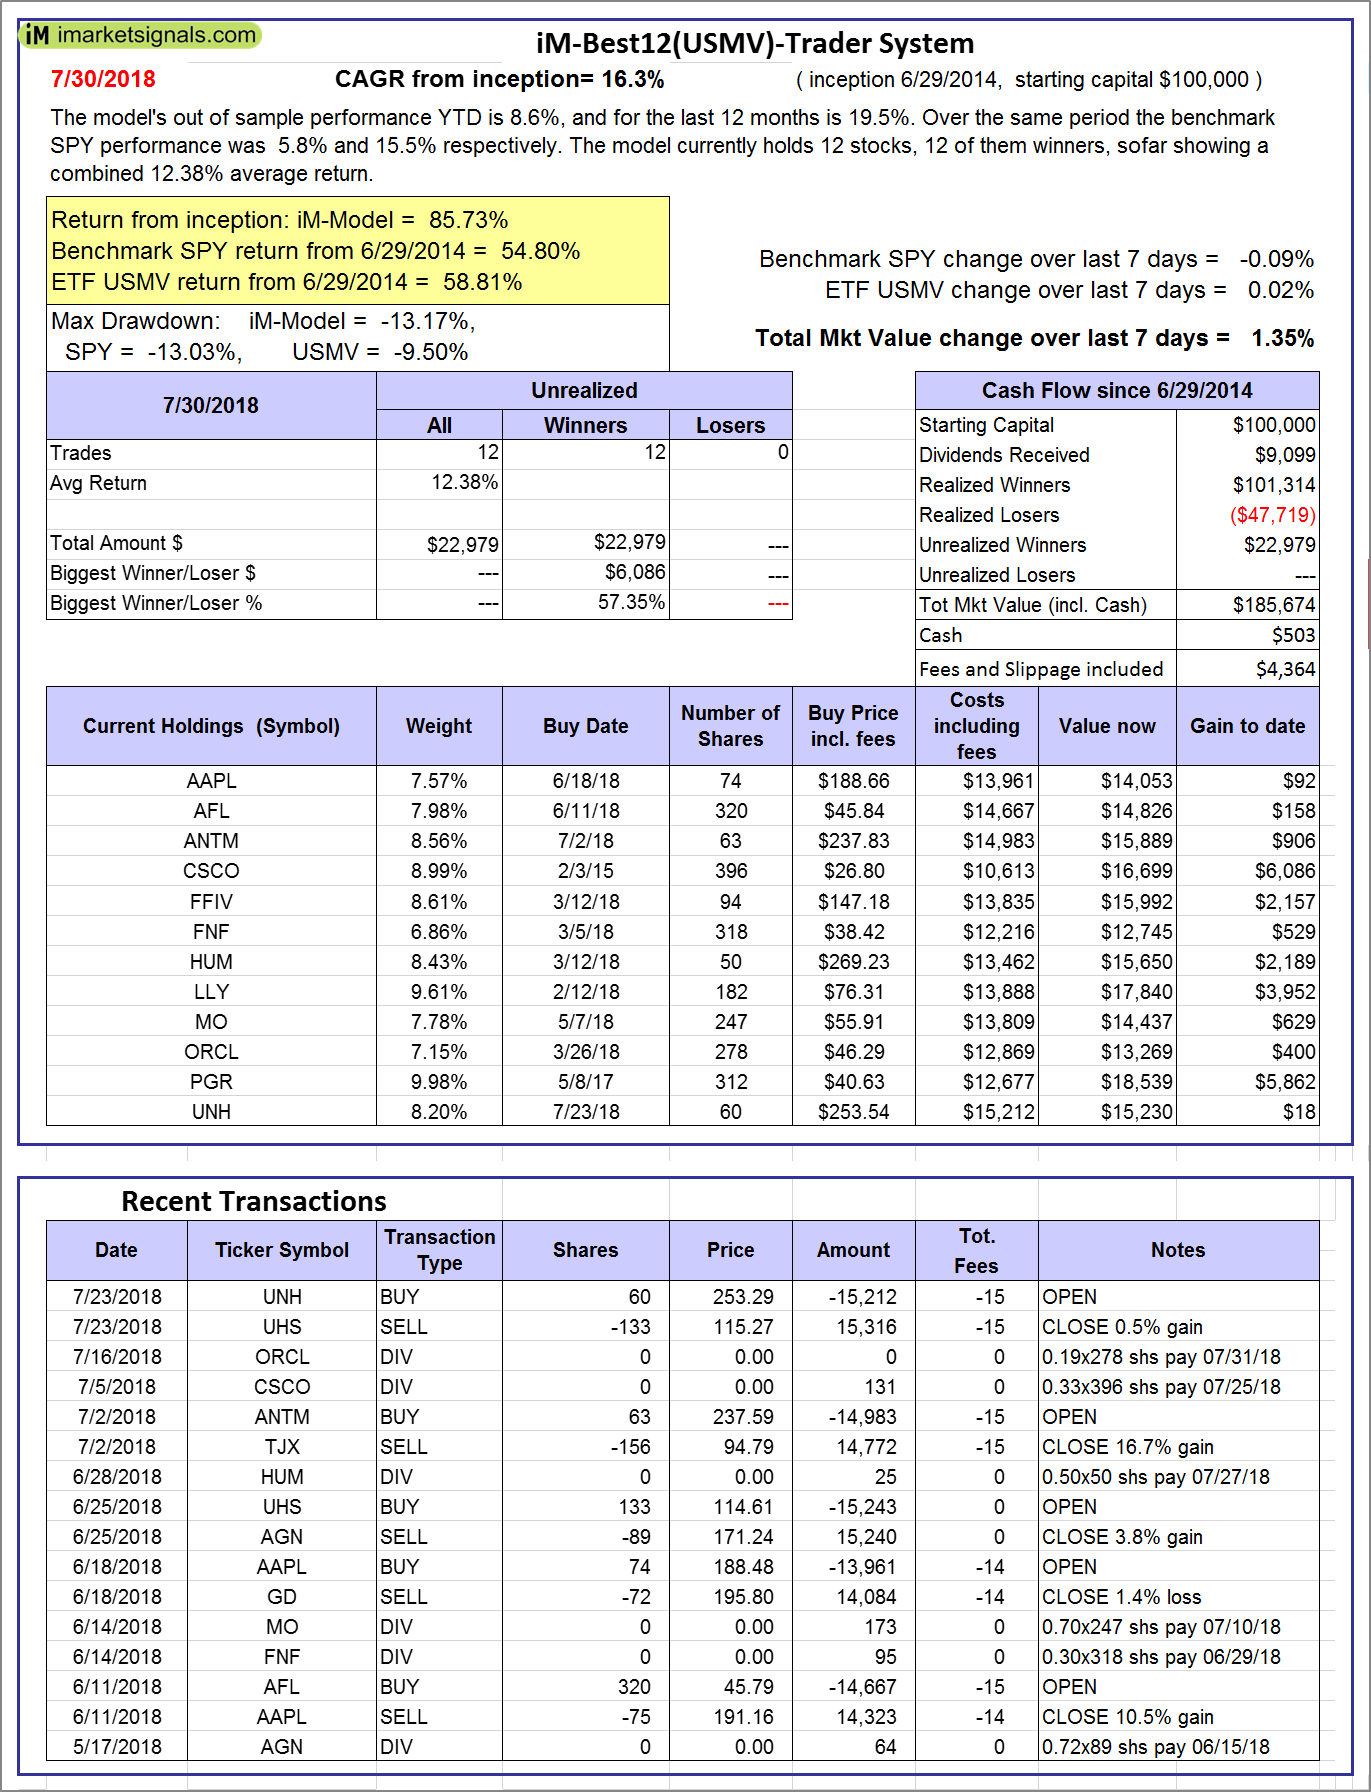
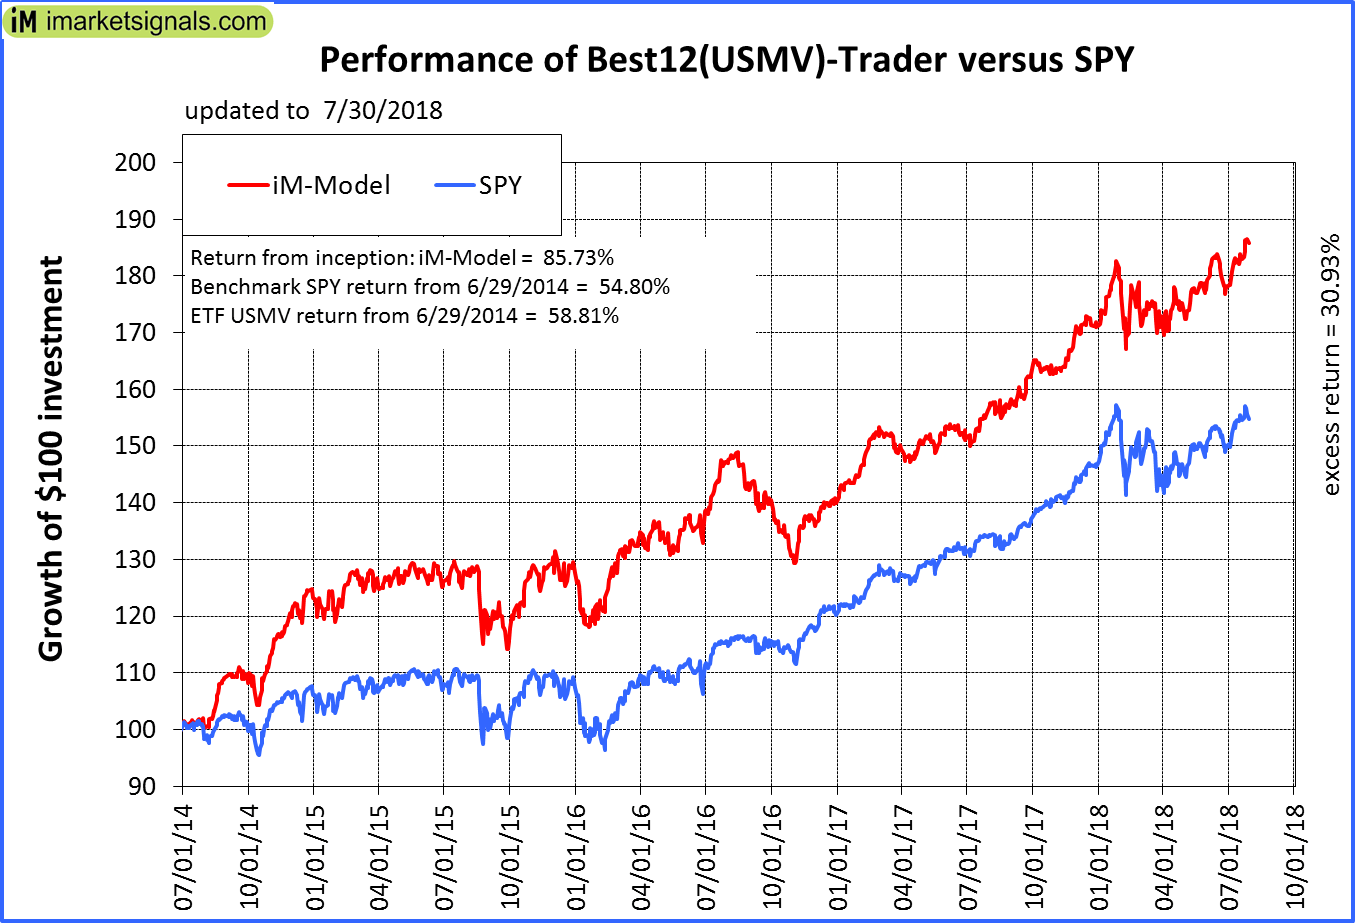
iM-Best12(USMV)-Trader: The model’s out of sample performance YTD is 8.6%, and for the last 12 months is 19.5%. Over the same period the benchmark SPY performance was 5.8% and 15.5% respectively. Since inception, on 6/30/2014, the model gained 85.73% while the benchmark SPY gained 54.80% and the ETF USMV gained 58.81% over the same period. Over the previous week the market value of iM-Best12(USMV)-Trader gained 1.35% at a time when SPY gained -0.09%. A starting capital of $100,000 at inception on 6/30/2014 would have grown to $185,674 which includes $503 cash and excludes $4,364 spent on fees and slippage. |
|
|
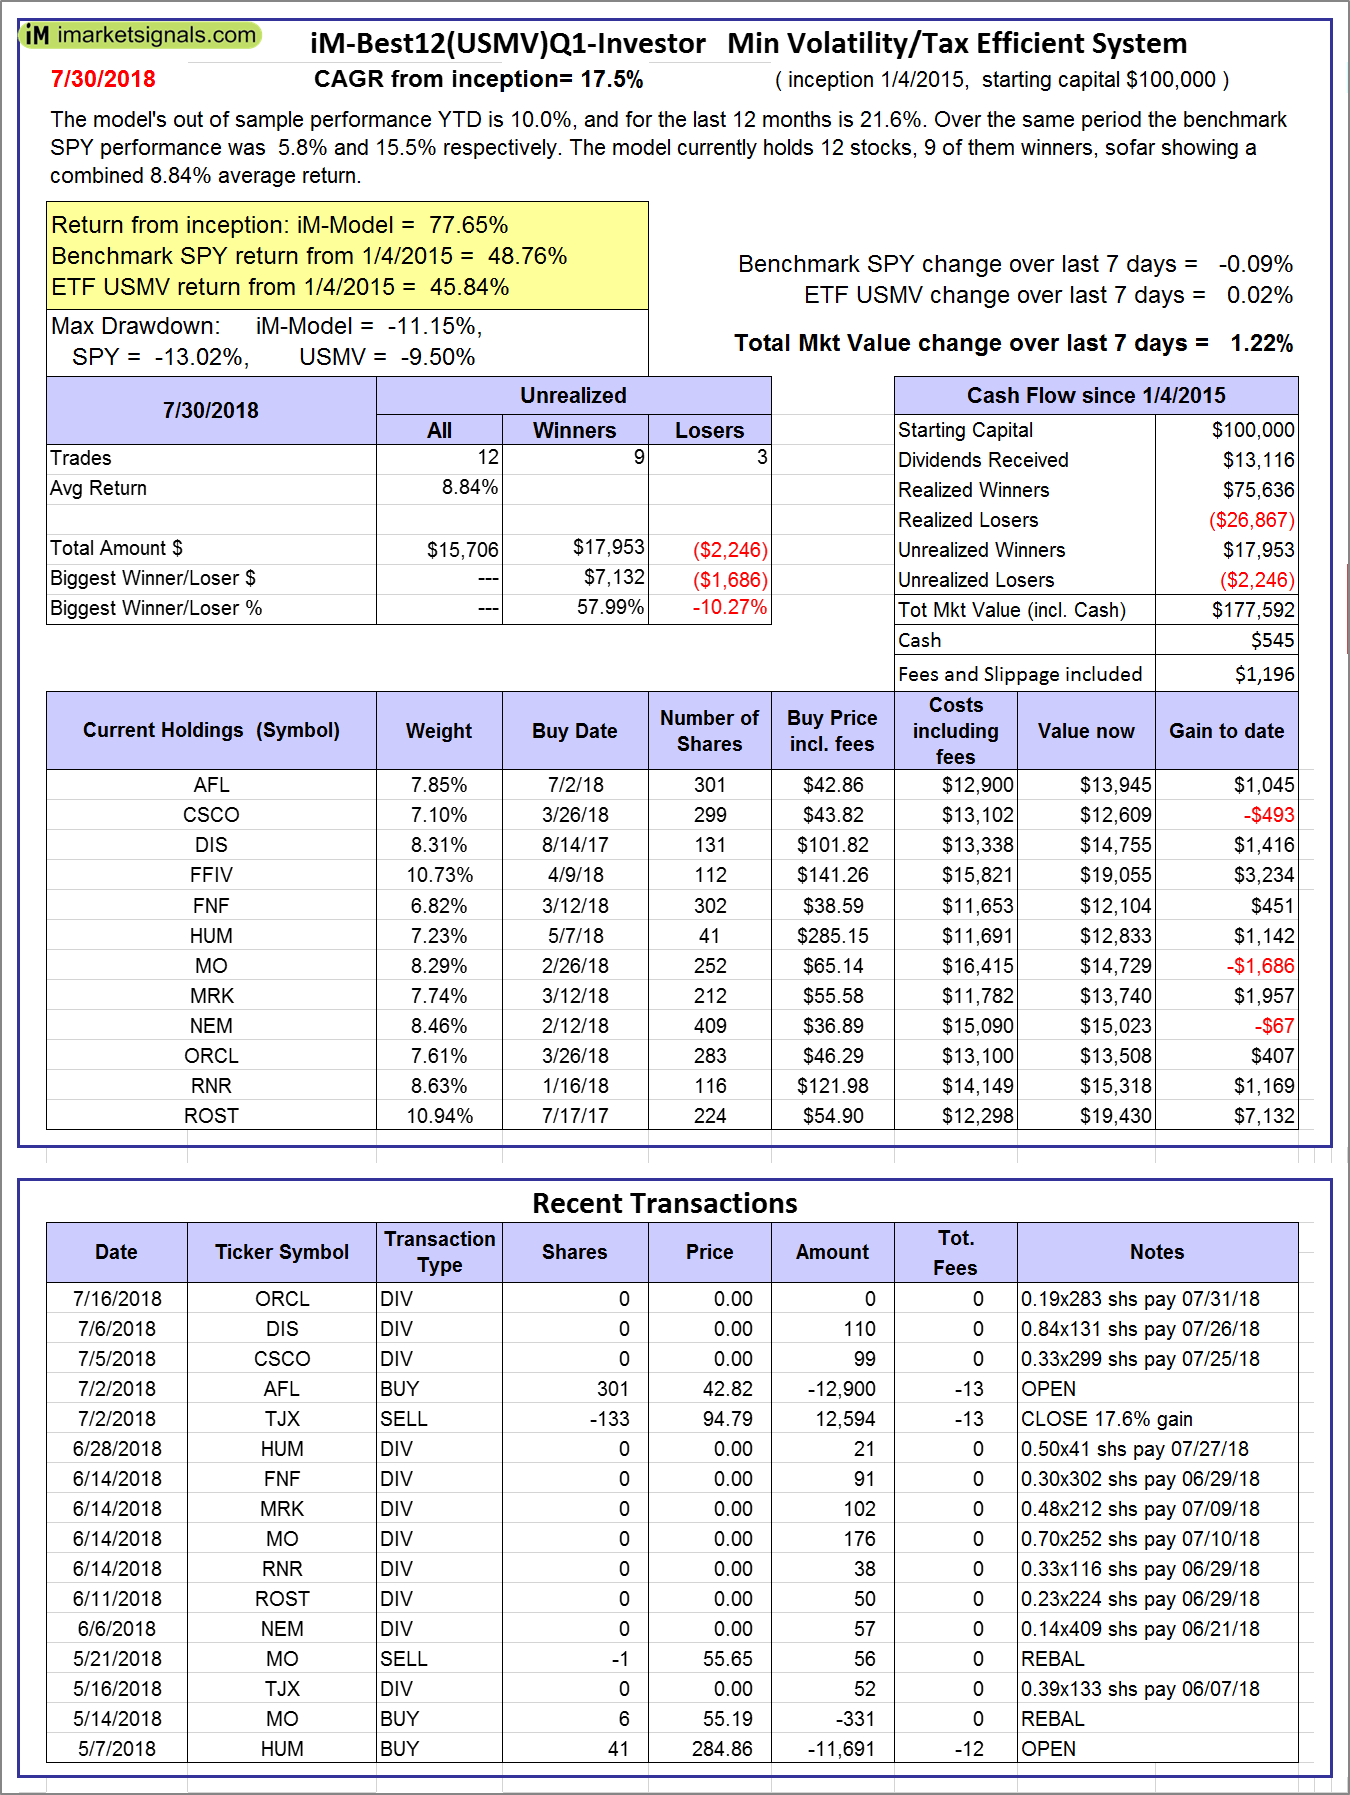
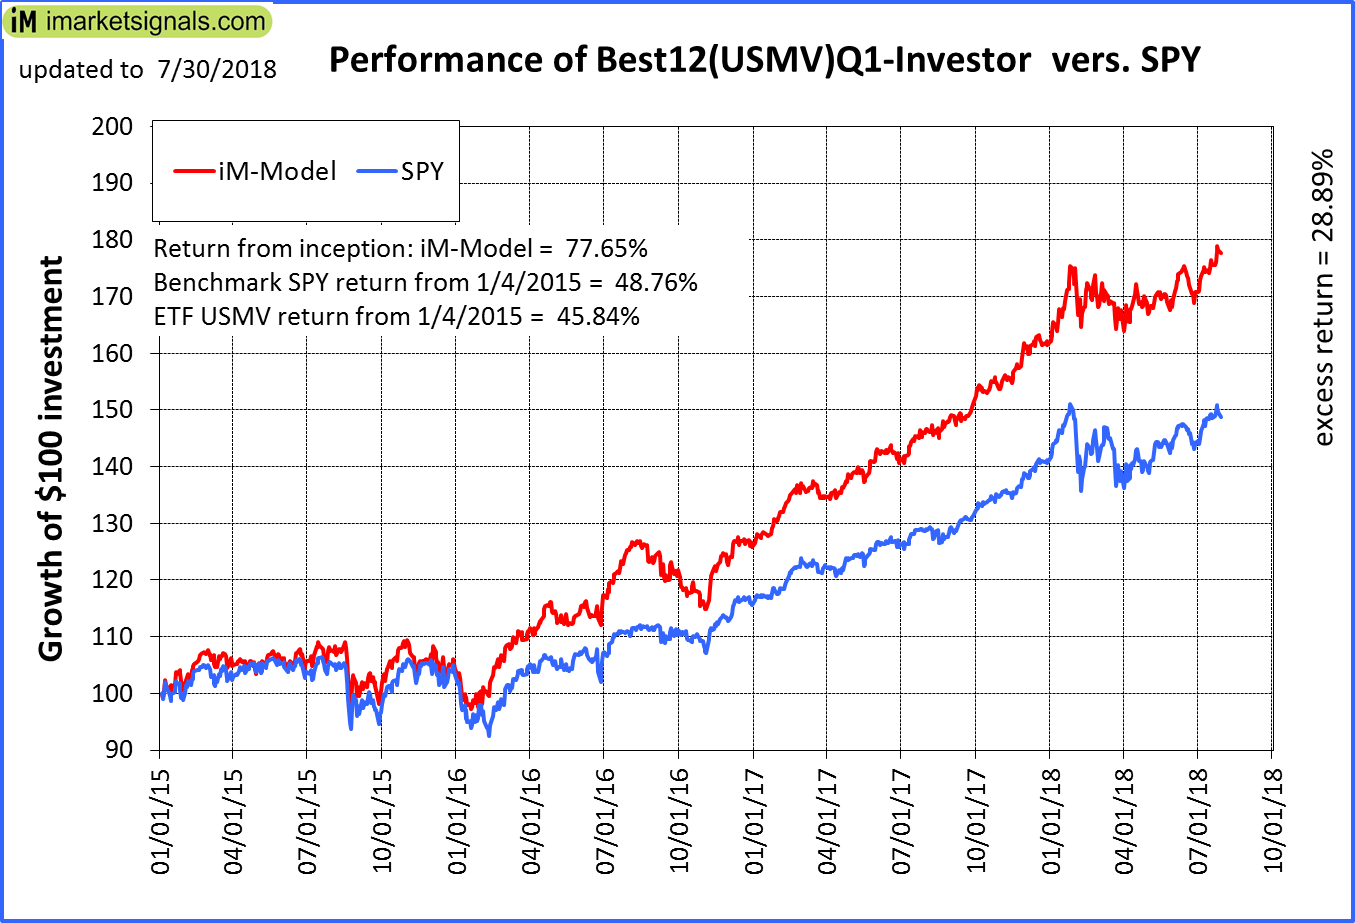
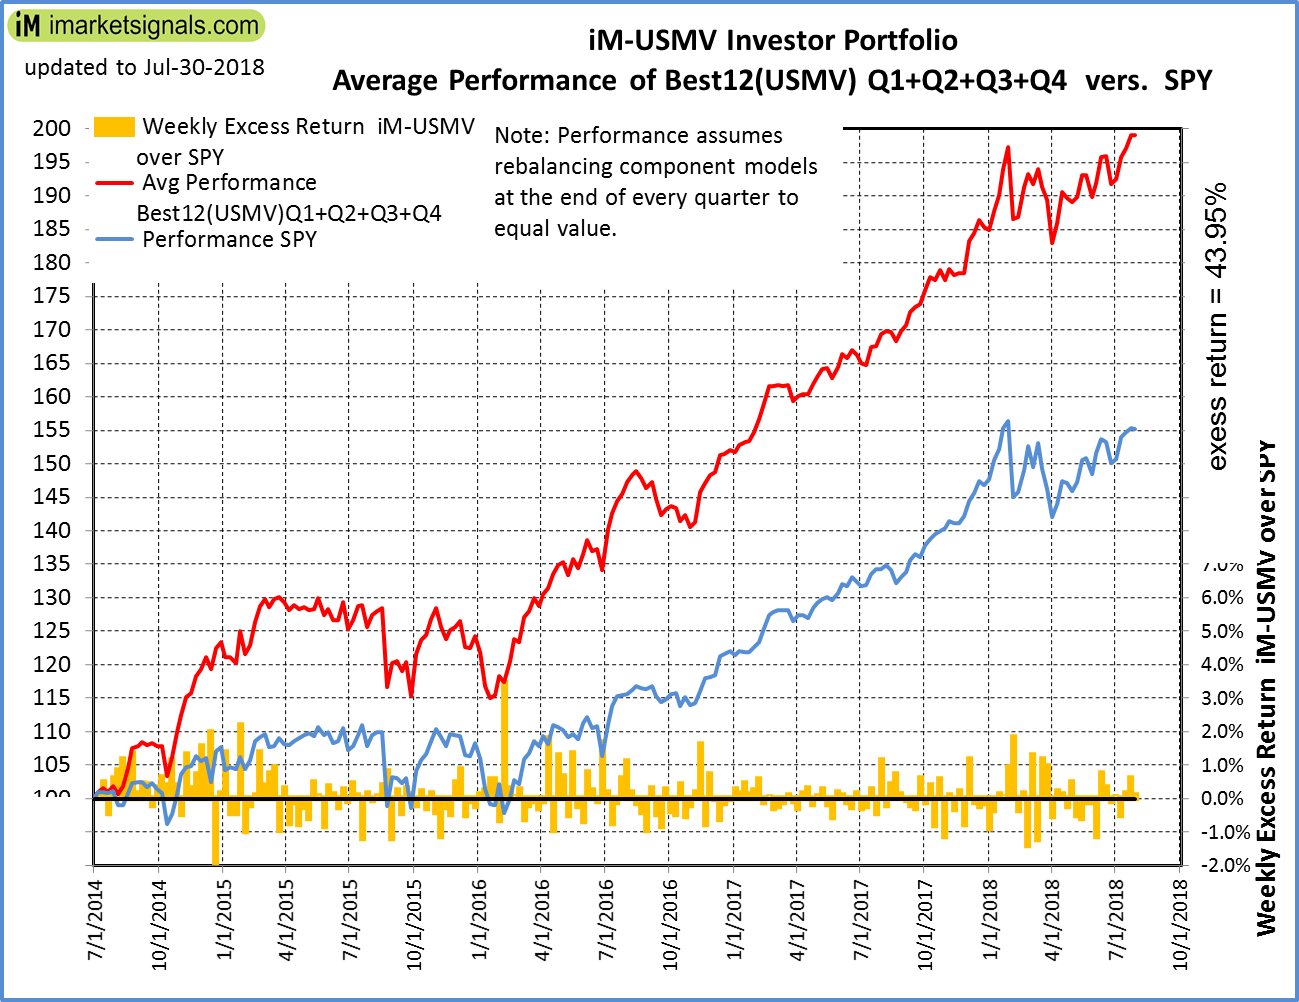
iM-Best12(USMV)Q1-Investor: The model’s out of sample performance YTD is 10.0%, and for the last 12 months is 21.6%. Over the same period the benchmark SPY performance was 5.8% and 15.5% respectively. Since inception, on 1/5/2015, the model gained 77.65% while the benchmark SPY gained 48.76% and the ETF USMV gained 45.84% over the same period. Over the previous week the market value of iM-Best12(USMV)Q1 gained 1.22% at a time when SPY gained -0.09%. A starting capital of $100,000 at inception on 1/5/2015 would have grown to $177,592 which includes $545 cash and excludes $1,196 spent on fees and slippage. |
|
|
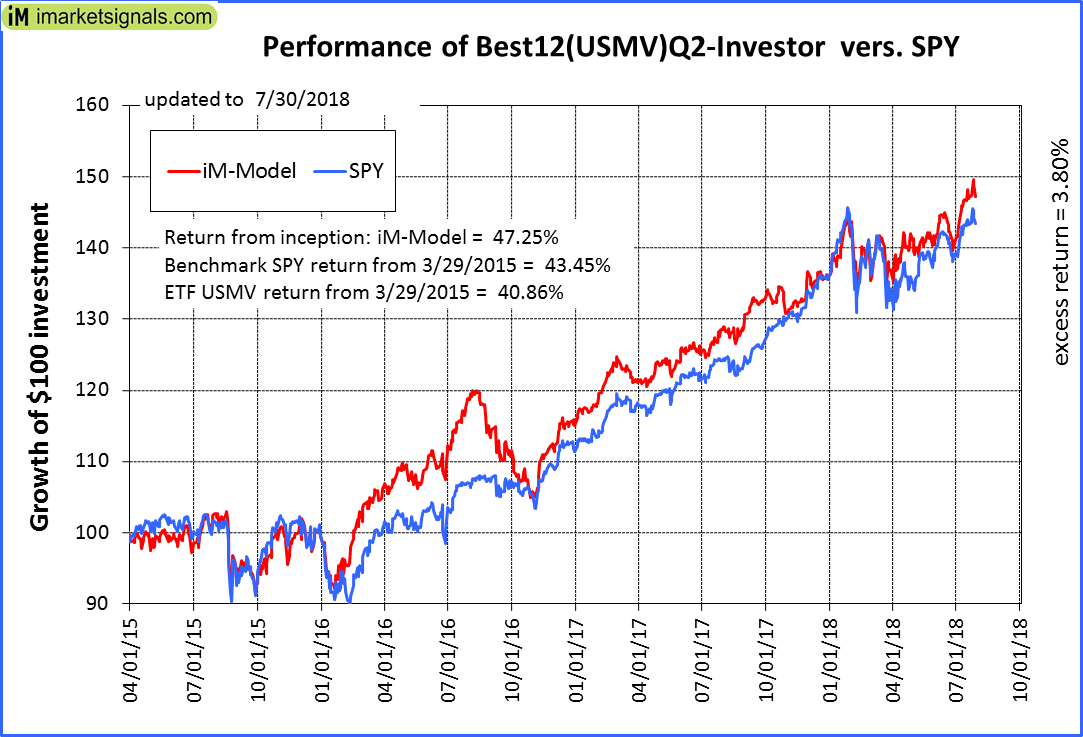
iM-Best12(USMV)Q2-Investor: The model’s out of sample performance YTD is 8.6%, and for the last 12 months is 14.6%. Over the same period the benchmark SPY performance was 5.8% and 15.5% respectively. Since inception, on 3/30/2015, the model gained 47.25% while the benchmark SPY gained 43.45% and the ETF USMV gained 40.86% over the same period. Over the previous week the market value of iM-Best12(USMV)Q2 gained -0.09% at a time when SPY gained -0.09%. A starting capital of $100,000 at inception on 3/30/2015 would have grown to $147,206 which includes $382 cash and excludes $1,014 spent on fees and slippage. |
|
|
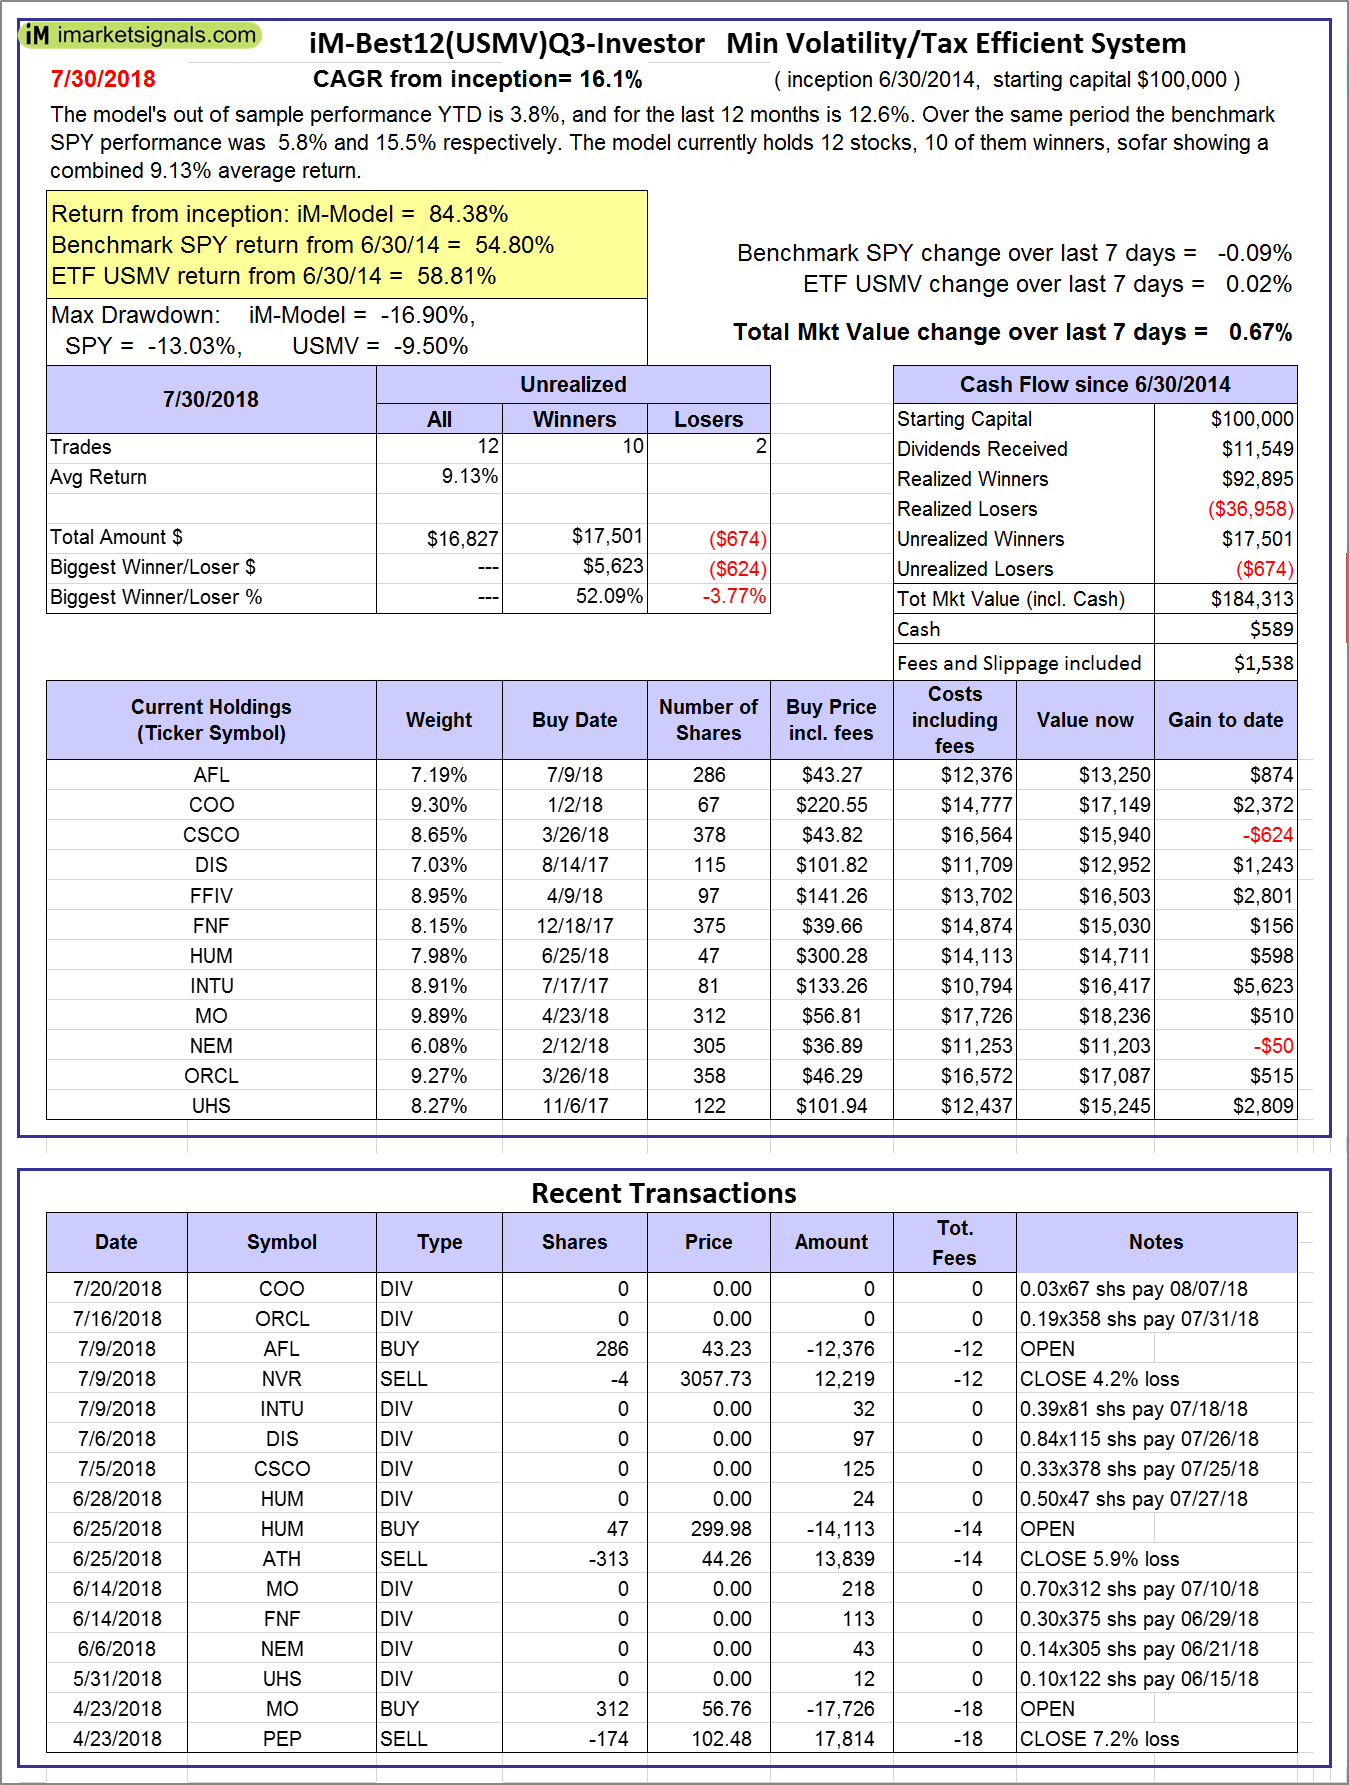
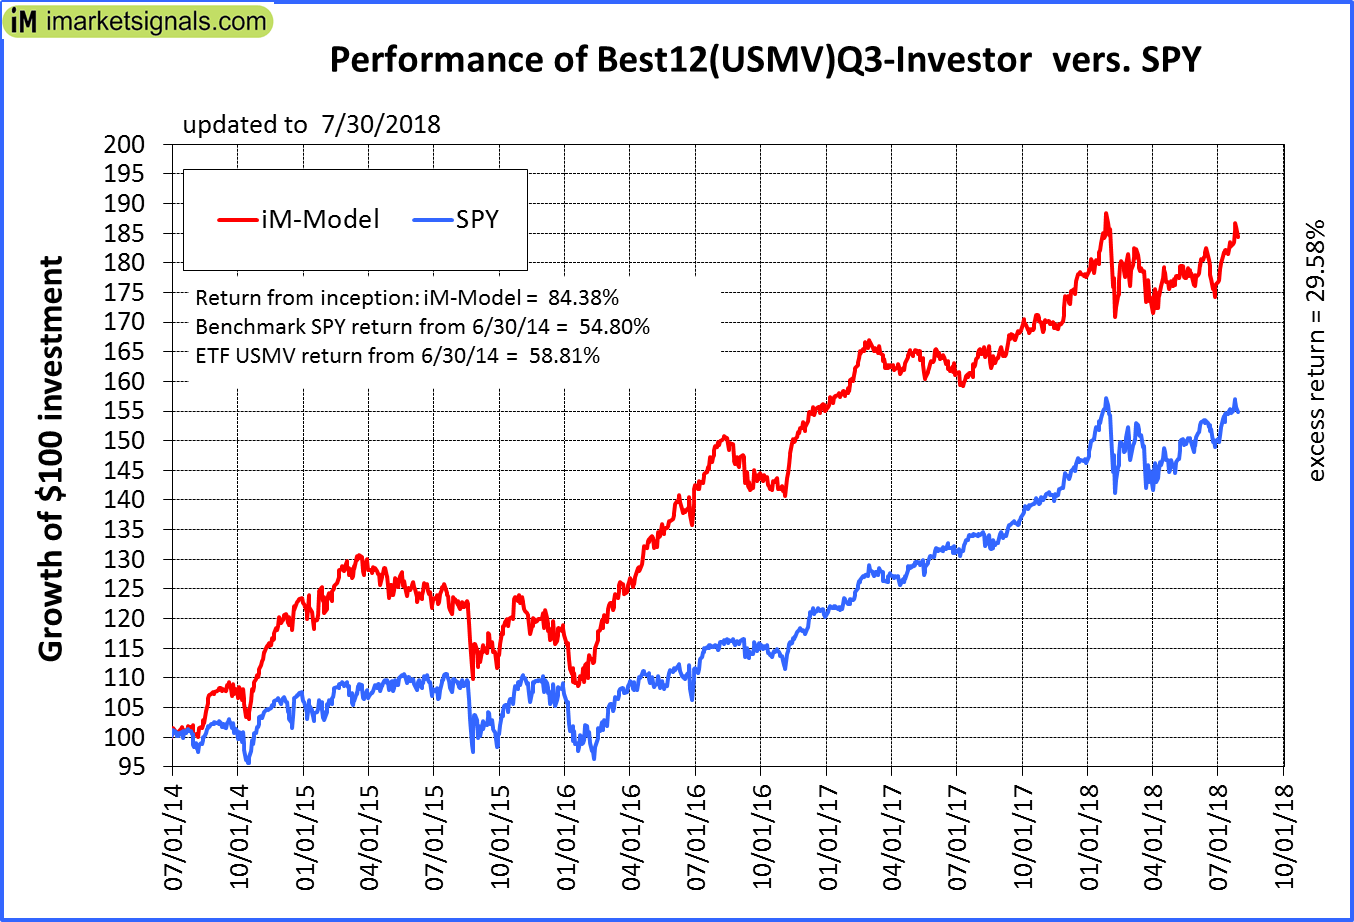
iM-Best12(USMV)Q3-Investor: The model’s out of sample performance YTD is 3.8%, and for the last 12 months is 12.6%. Over the same period the benchmark SPY performance was 5.8% and 15.5% respectively. Since inception, on 7/1/2014, the model gained 84.38% while the benchmark SPY gained 54.80% and the ETF USMV gained 58.81% over the same period. Over the previous week the market value of iM-Best12(USMV)Q3 gained 0.67% at a time when SPY gained -0.09%. A starting capital of $100,000 at inception on 7/1/2014 would have grown to $184,313 which includes $589 cash and excludes $1,538 spent on fees and slippage. |
|
|
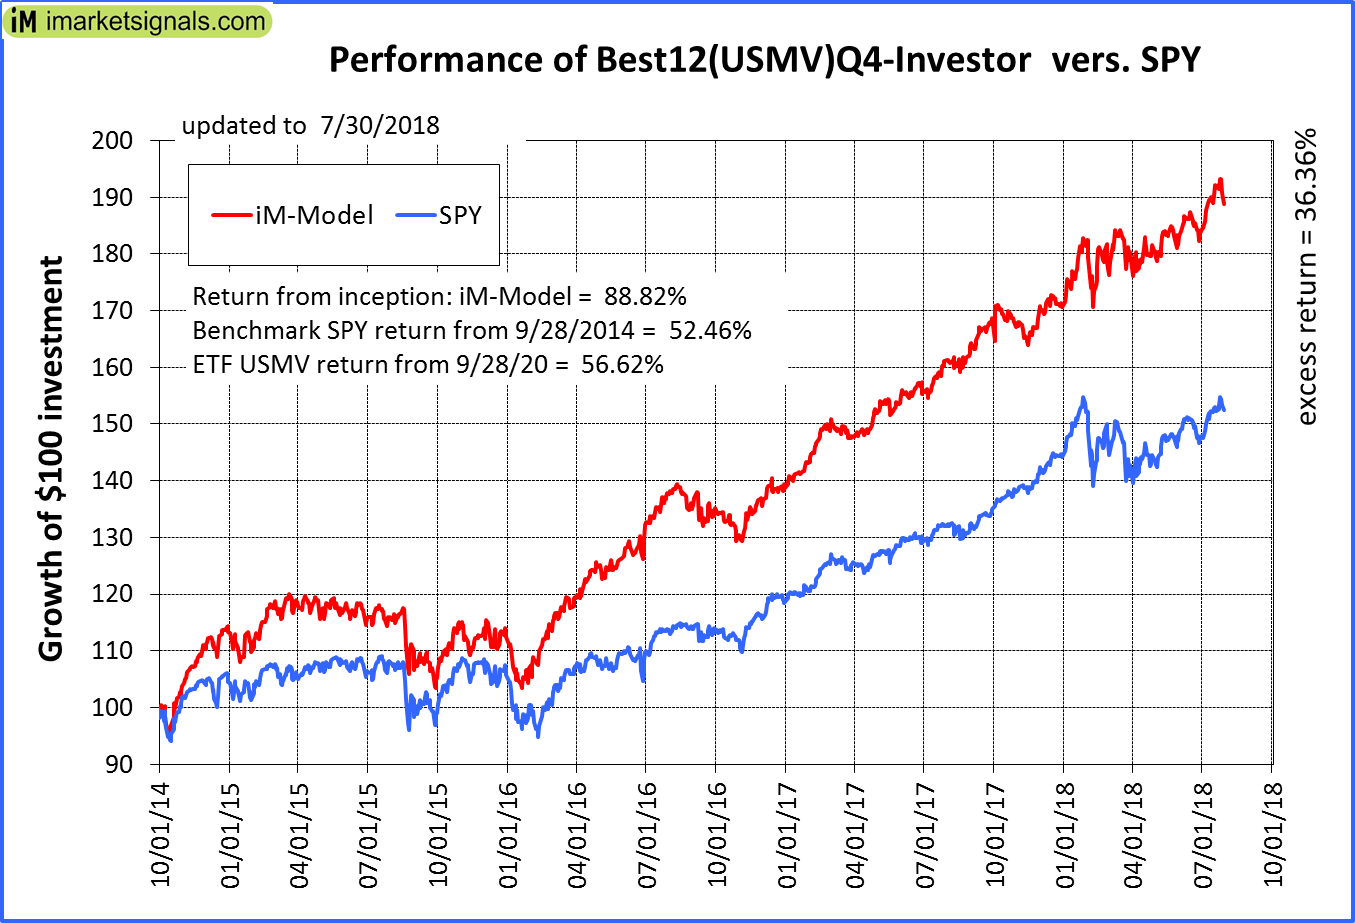
iM-Best12(USMV)Q4-Investor: Since inception, on 9/29/2014, the model gained 88.82% while the benchmark SPY gained 52.46% and the ETF USMV gained 56.62% over the same period. Over the previous week the market value of iM-Best12(USMV)Q4 gained -1.77% at a time when SPY gained -0.09%. A starting capital of $100,000 at inception on 9/29/2014 would have grown to $188,771 which includes $277 cash and excludes $1,340 spent on fees and slippage. |
|
|
Average Performance of iM-Best12(USMV)Q1+Q2+Q3+Q4-Investor resulted in an excess return of 43.95% over SPY. (see iM-USMV Investor Portfolio) |
|
|
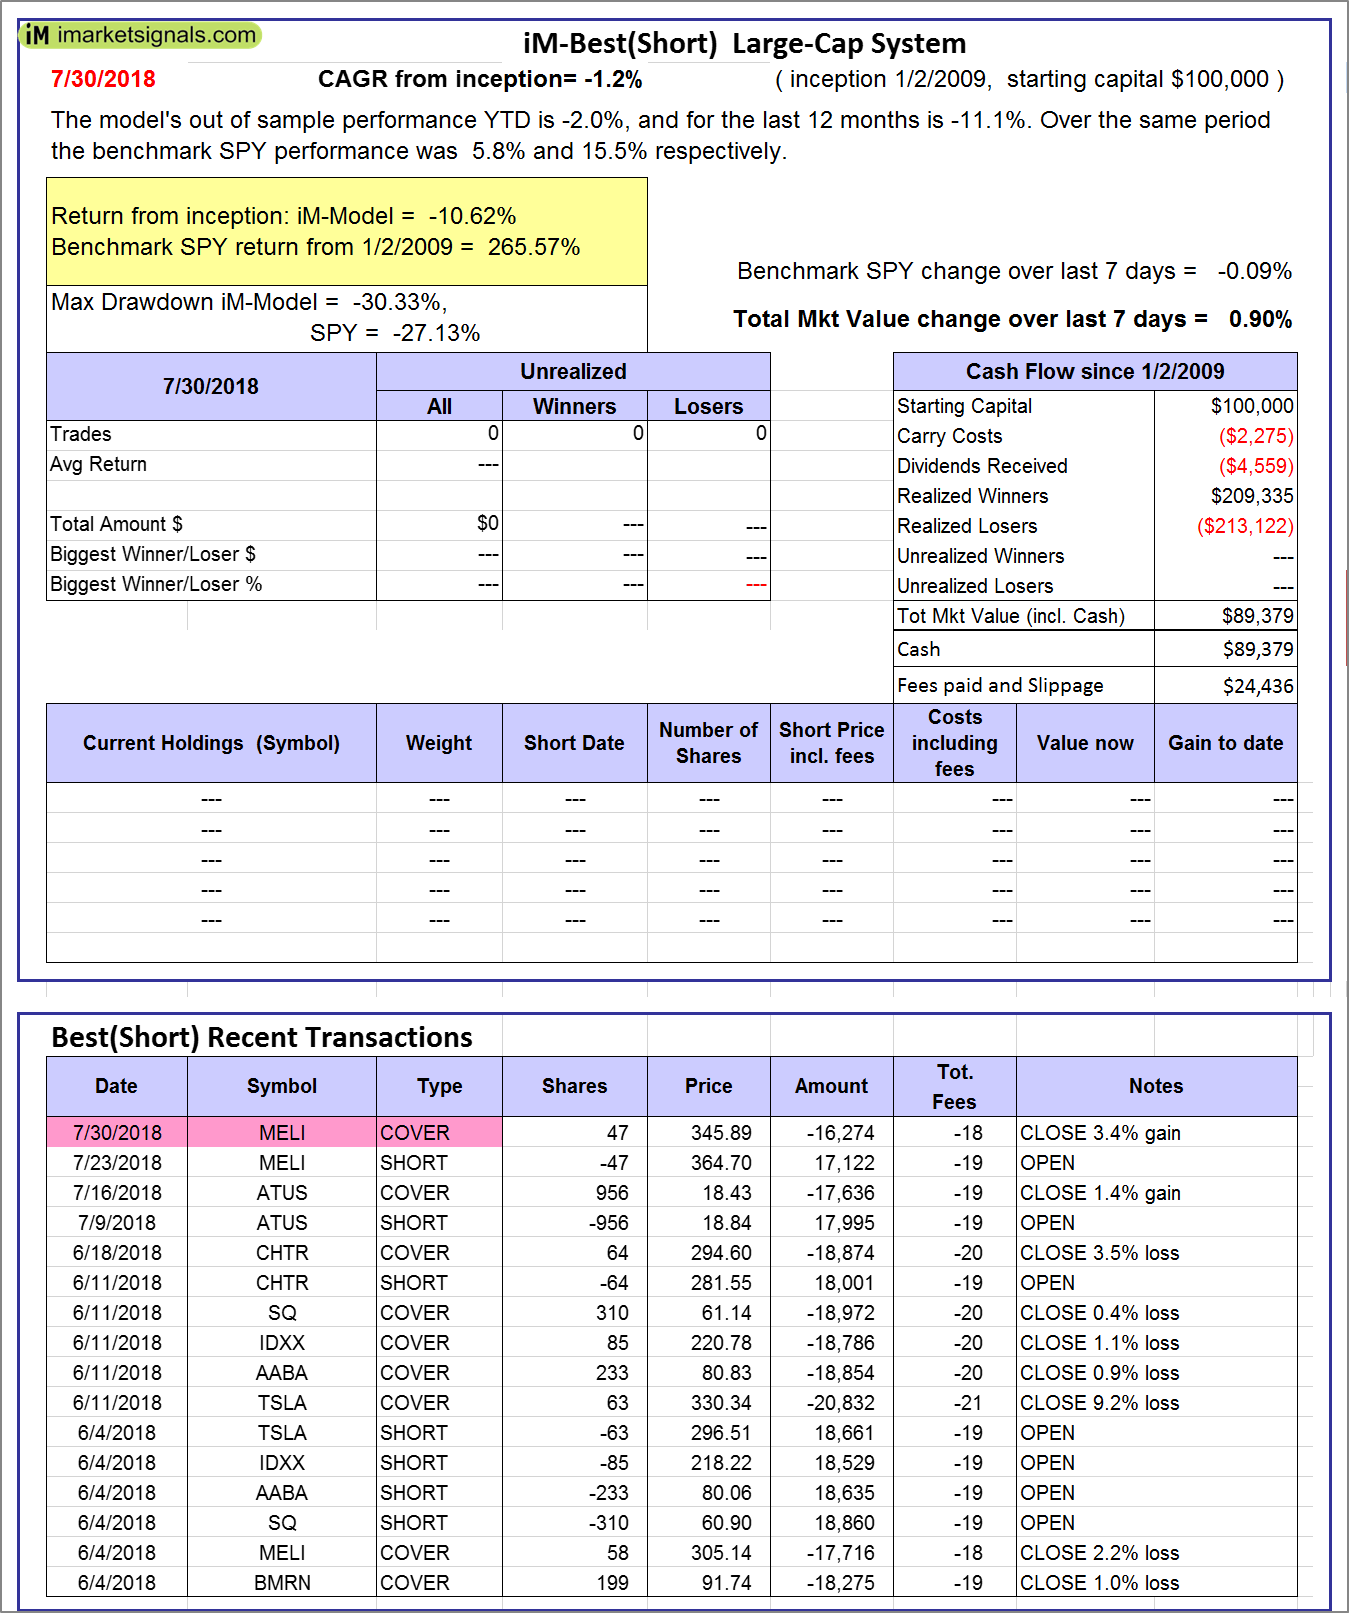
iM-Best(Short): The model’s out of sample performance YTD is -2.0%, and for the last 12 months is -11.1%. Over the same period the benchmark SPY performance was 5.8% and 15.5% respectively. Over the previous week the market value of iM-Best(Short) gained 0.90% at a time when SPY gained -0.09%. Over the period 1/2/2009 to 7/30/2018 the starting capital of $100,000 would have grown to $89,379 which includes $89,379 cash and excludes $24,436 spent on fees and slippage. |
|
|
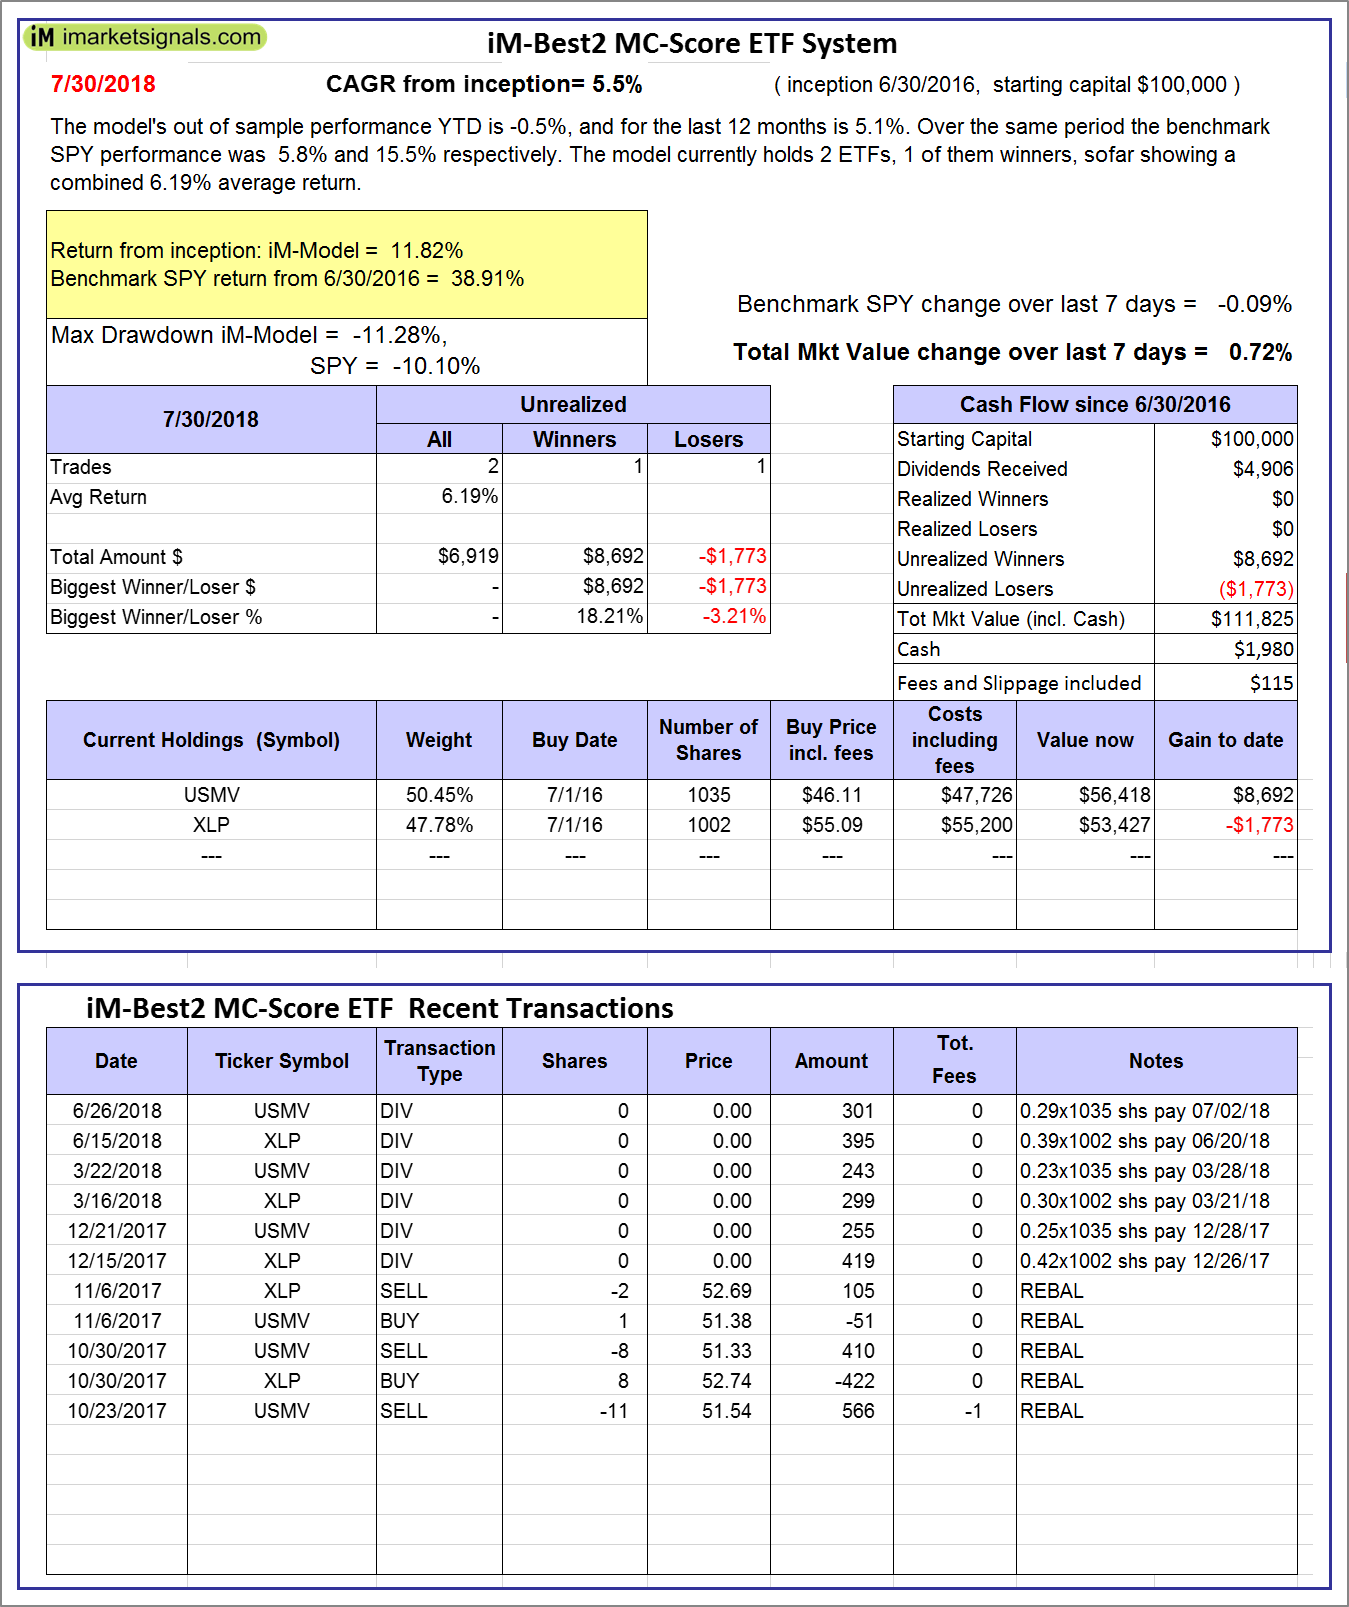
iM-Best2 MC-Score ETF System: The model’s out of sample performance YTD is -0.5%, and for the last 12 months is 5.1%. Over the same period the benchmark SPY performance was 5.8% and 15.5% respectively. Over the previous week the market value of the iM-Best2 MC-Score ETF System gained 0.72% at a time when SPY gained -0.09%. A starting capital of $100,000 at inception on 6/30/2016 would have grown to $111,825 which includes $1,980 cash and excludes $115 spent on fees and slippage. |
|
|
iM-Best4 MC-Score Vanguard System: The model’s out of sample performance YTD is -0.3%, and for the last 12 months is 3.3%. Over the same period the benchmark SPY performance was 5.8% and 15.5% respectively. Over the previous week the market value of the iM-Best4 MC-Score Vanguard System gained 0.44% at a time when SPY gained -0.09%. A starting capital of $100,000 at inception on 6/30/2016 would have grown to $110,568 which includes $4,783 cash and excludes $00 spent on fees and slippage. |
|
|
iM-Composite (SH-RSP) Timer: The model’s out of sample performance YTD is 4.0%, and for the last 12 months is 12.5%. Over the same period the benchmark SPY performance was 5.8% and 15.5% respectively. Over the previous week the market value of the iM-Composite (SH-RSP) Timer gained 0.16% at a time when SPY gained -0.09%. A starting capital of $100,000 at inception on 6/30/2016 would have grown to $135,214 which includes $3,223 cash and excludes $513 spent on fees and slippage. |
|
|
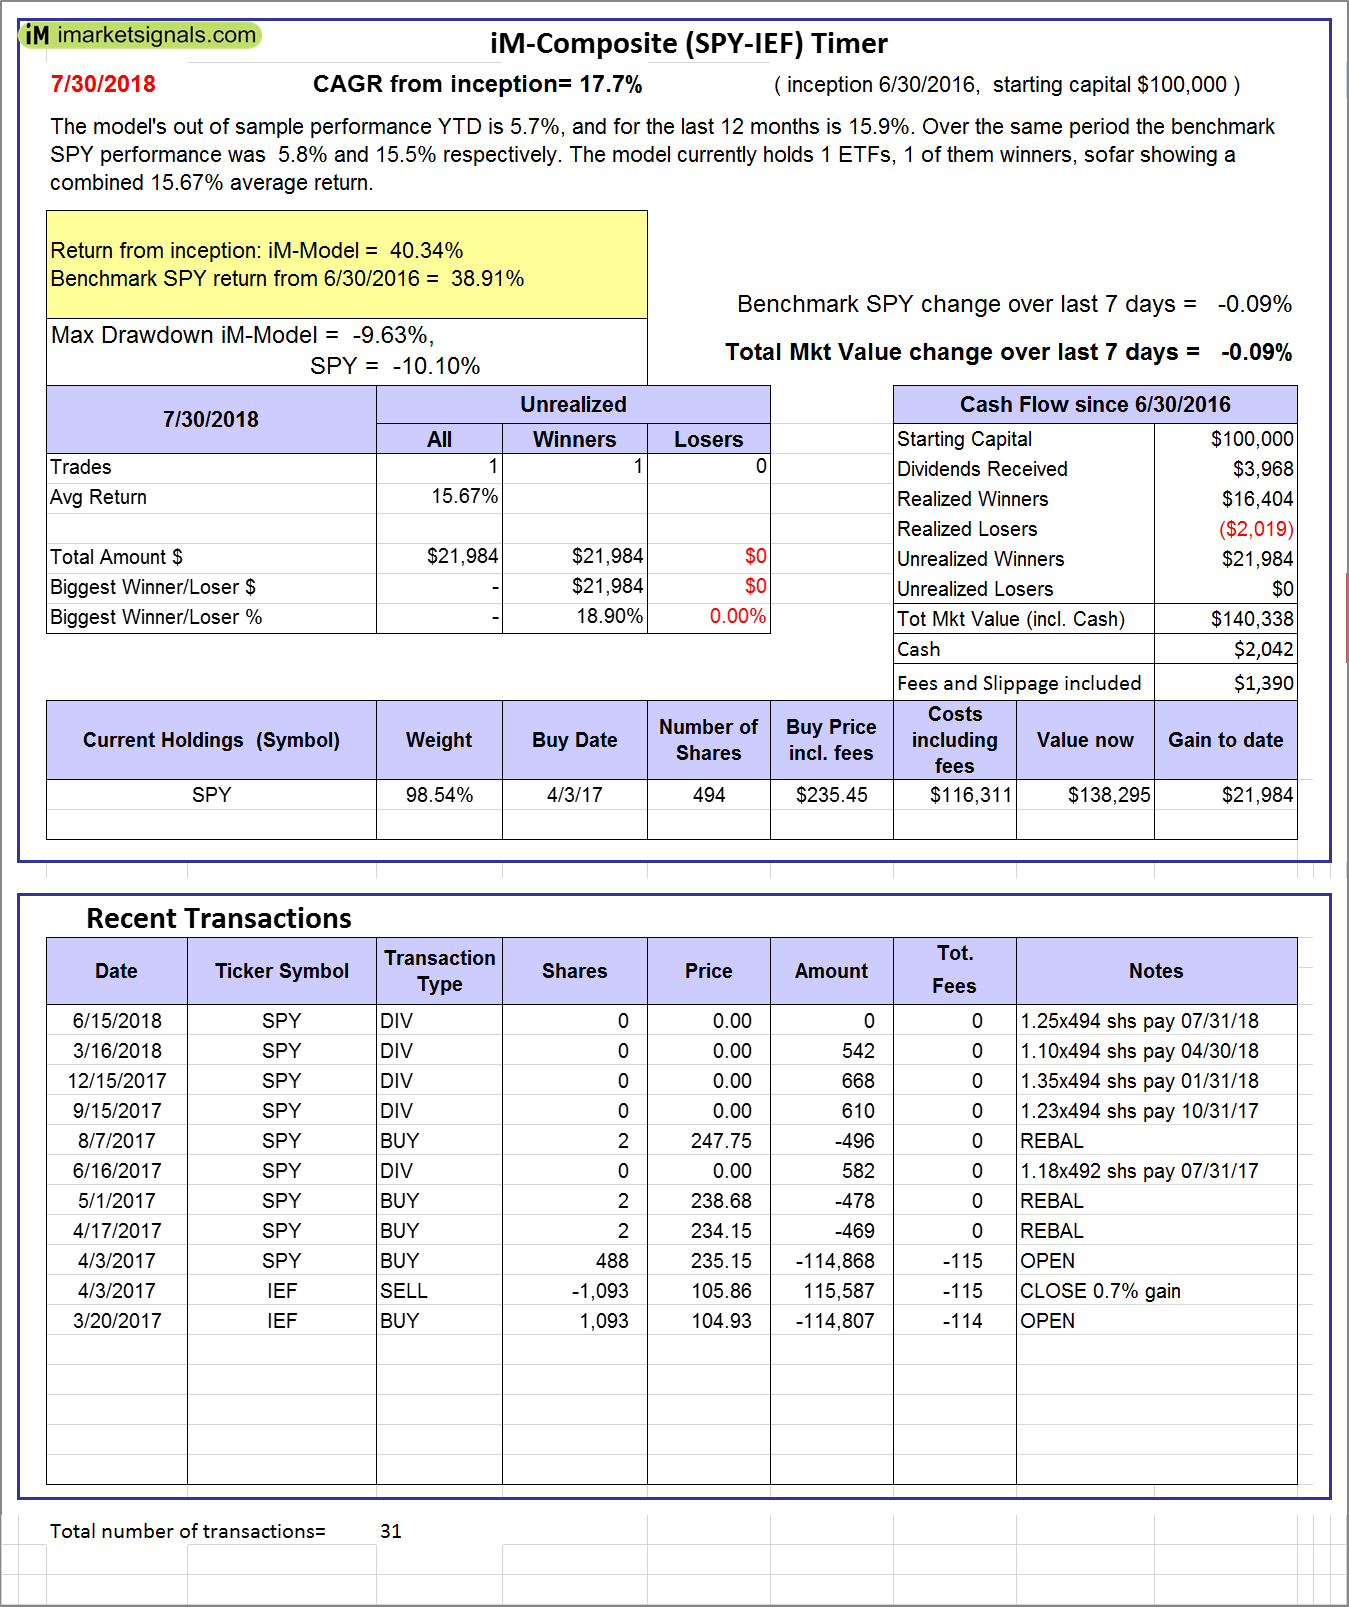
iM-Composite (SPY-IEF) Timer: The model’s out of sample performance YTD is 5.7%, and for the last 12 months is 15.9%. Over the same period the benchmark SPY performance was 5.8% and 15.5% respectively. Over the previous week the market value of the iM-Composite (SPY-IEF) Timer gained -0.09% at a time when SPY gained -0.09%. A starting capital of $100,000 at inception on 6/30/2016 would have grown to $140,338 which includes $2,042 cash and excludes $1,390 spent on fees and slippage. |
|
|
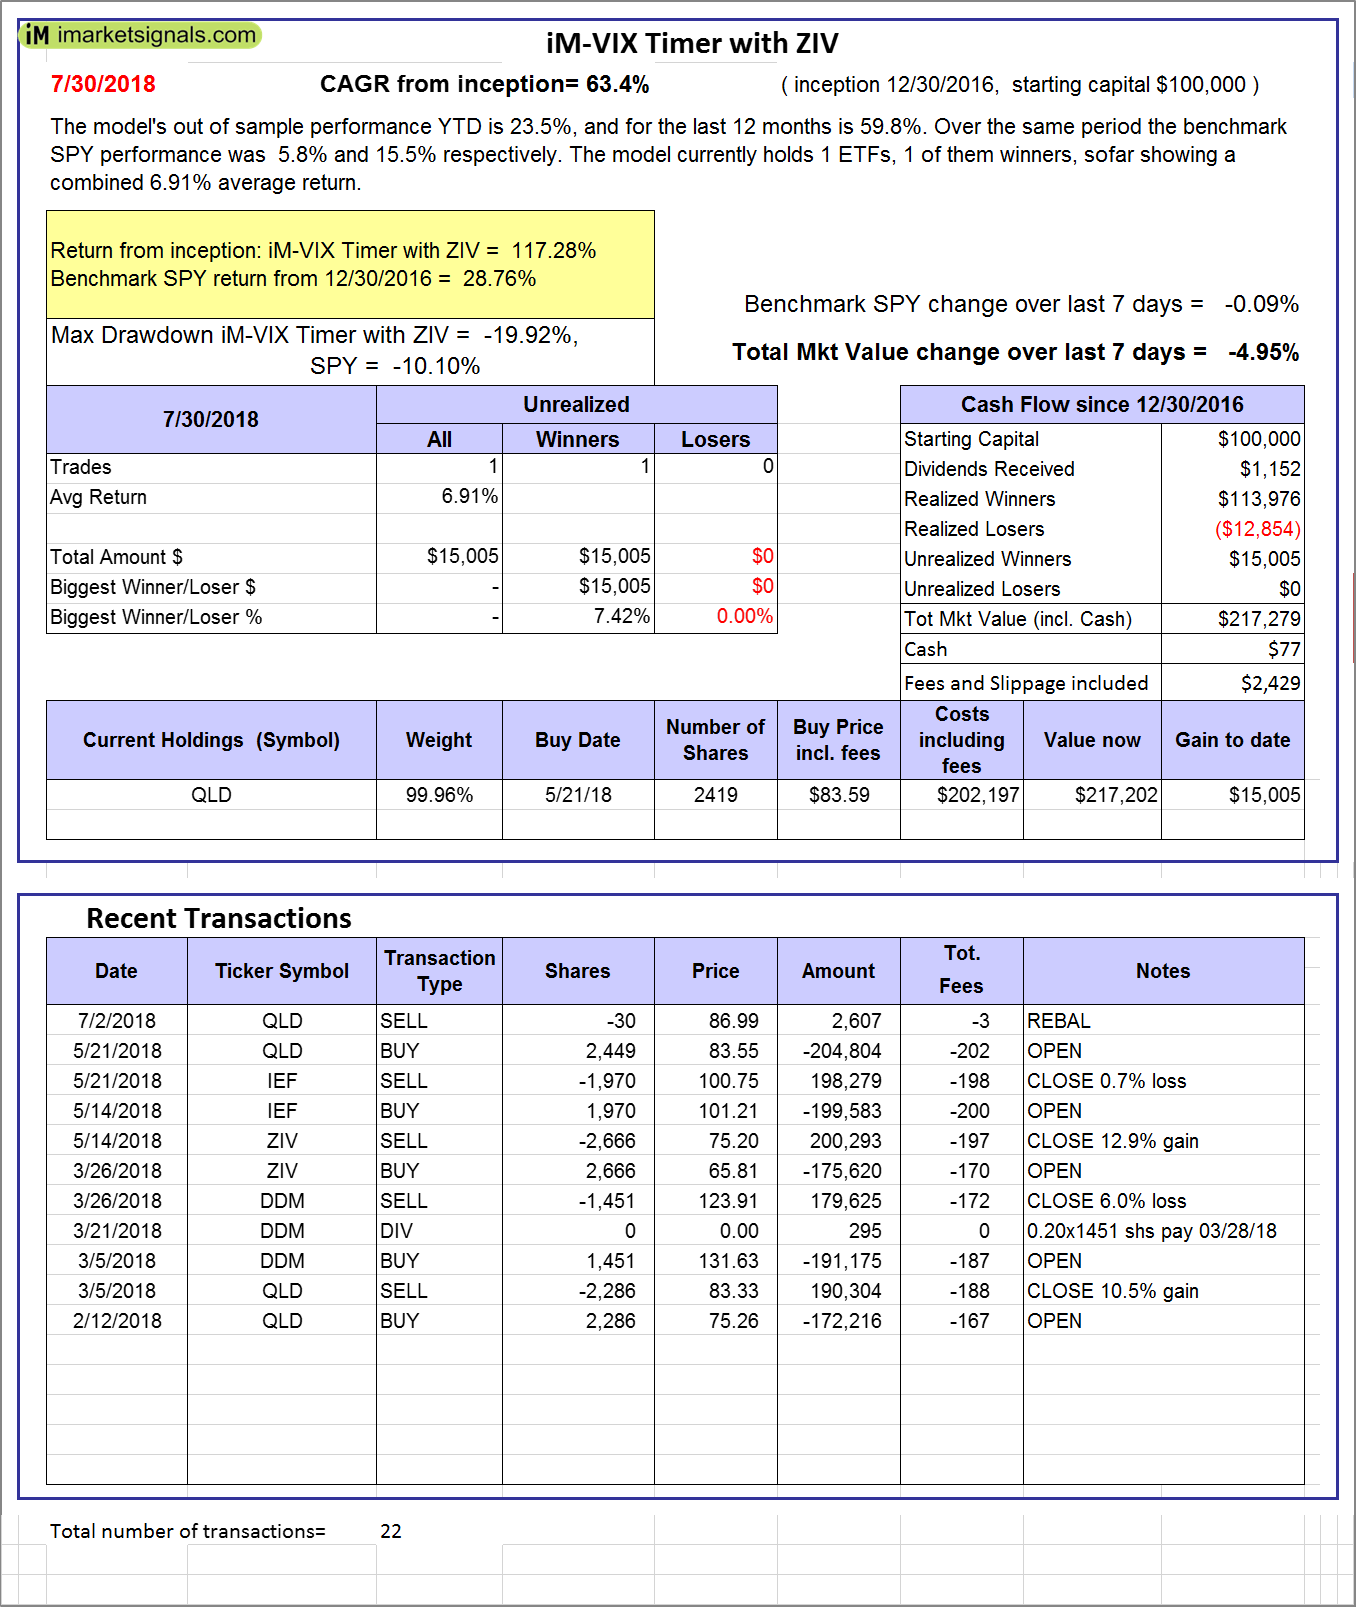
iM-VIX Timer with ZIV: The model’s out of sample performance YTD is 23.5%, and for the last 12 months is 59.8%. Over the same period the benchmark SPY performance was 5.8% and 15.5% respectively. Over the previous week the market value of the iM-VIX Timer with ZIV gained -4.95% at a time when SPY gained -0.09%. A starting capital of $100,000 at inception on 6/30/2016 would have grown to $217,279 which includes $77 cash and excludes $2,429 spent on fees and slippage. |
|
|
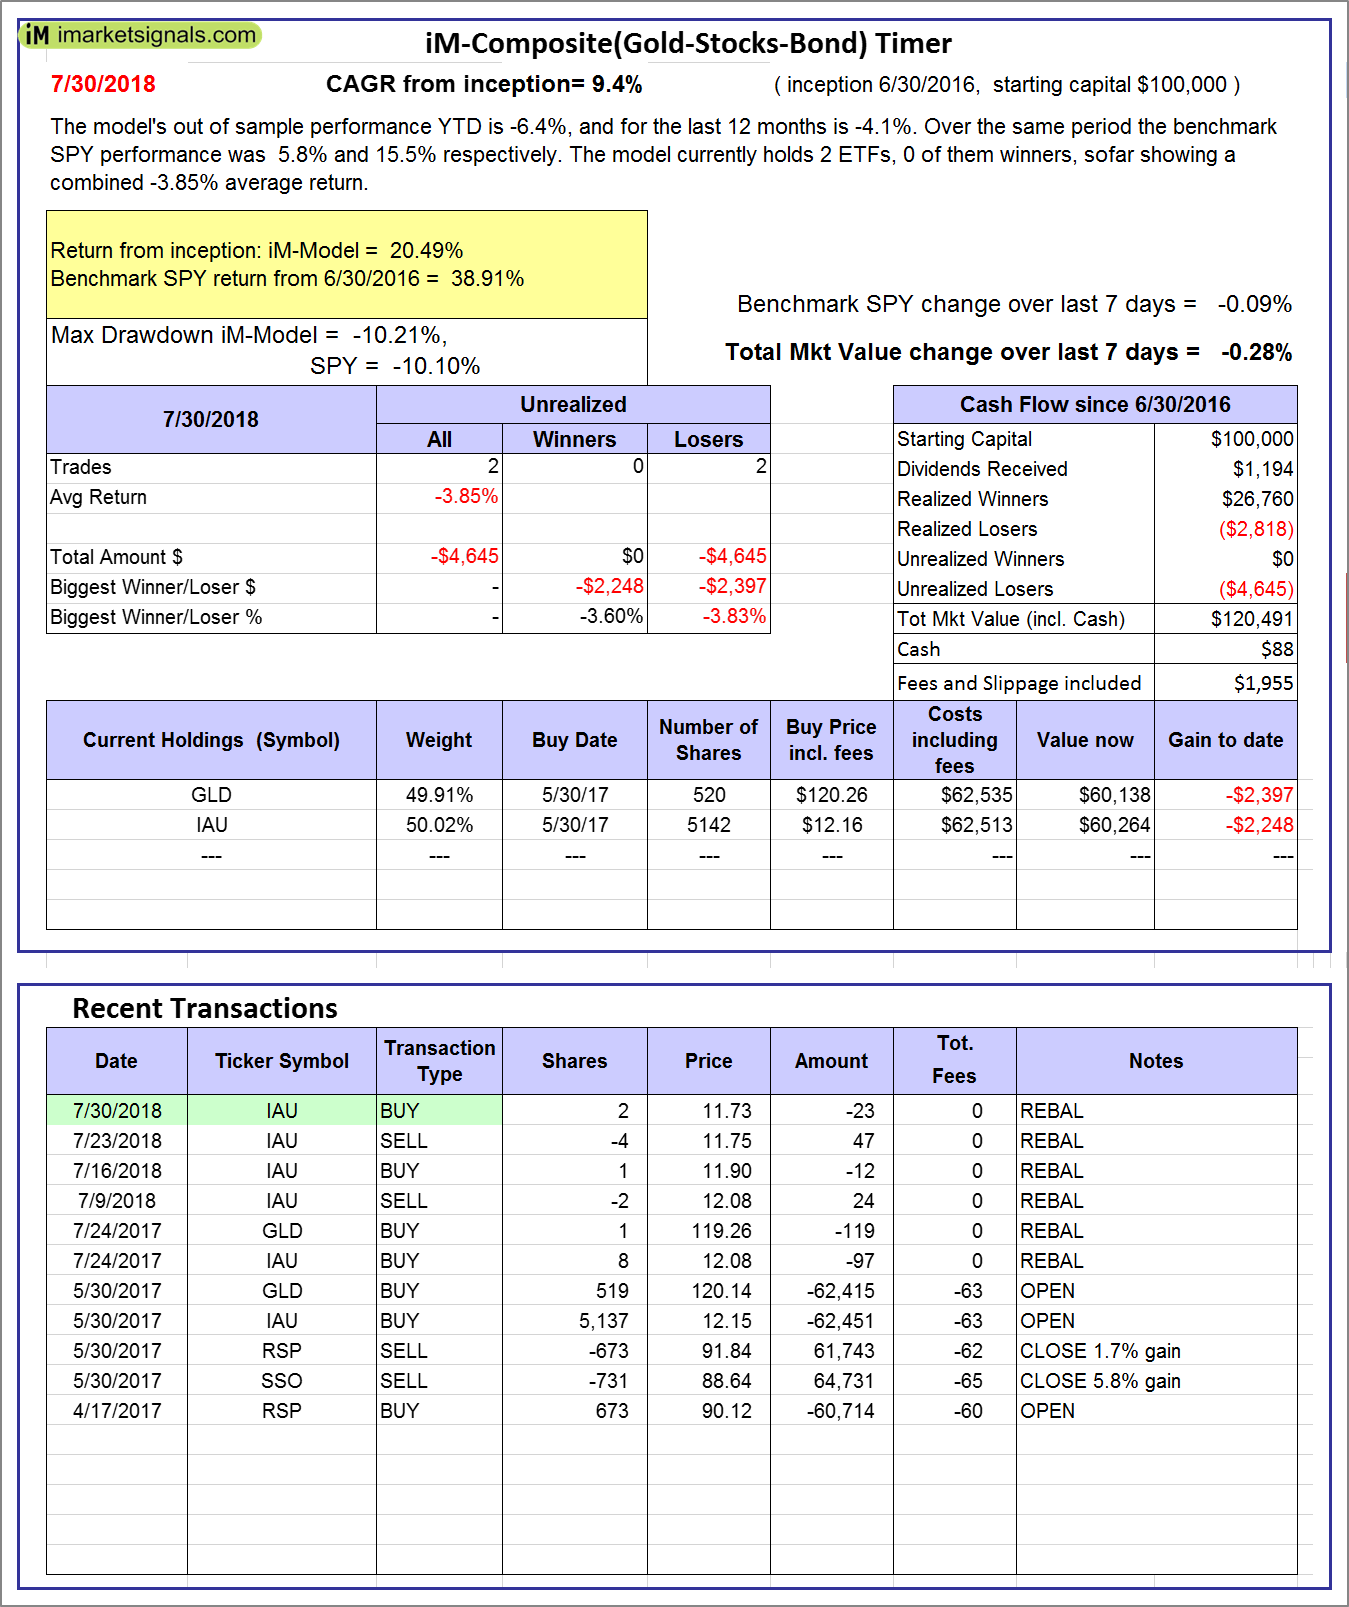
iM-Composite(Gold-Stocks-Bond) Timer: The model’s out of sample performance YTD is -6.4%, and for the last 12 months is -4.1%. Over the same period the benchmark SPY performance was 5.8% and 15.5% respectively. Over the previous week the market value of the iM-Composite(Gold-Stocks-Bond) Timer gained -0.28% at a time when SPY gained -0.09%. A starting capital of $100,000 at inception on 6/30/2016 would have grown to $120,491 which includes $88 cash and excludes $1,955 spent on fees and slippage. |
|
|
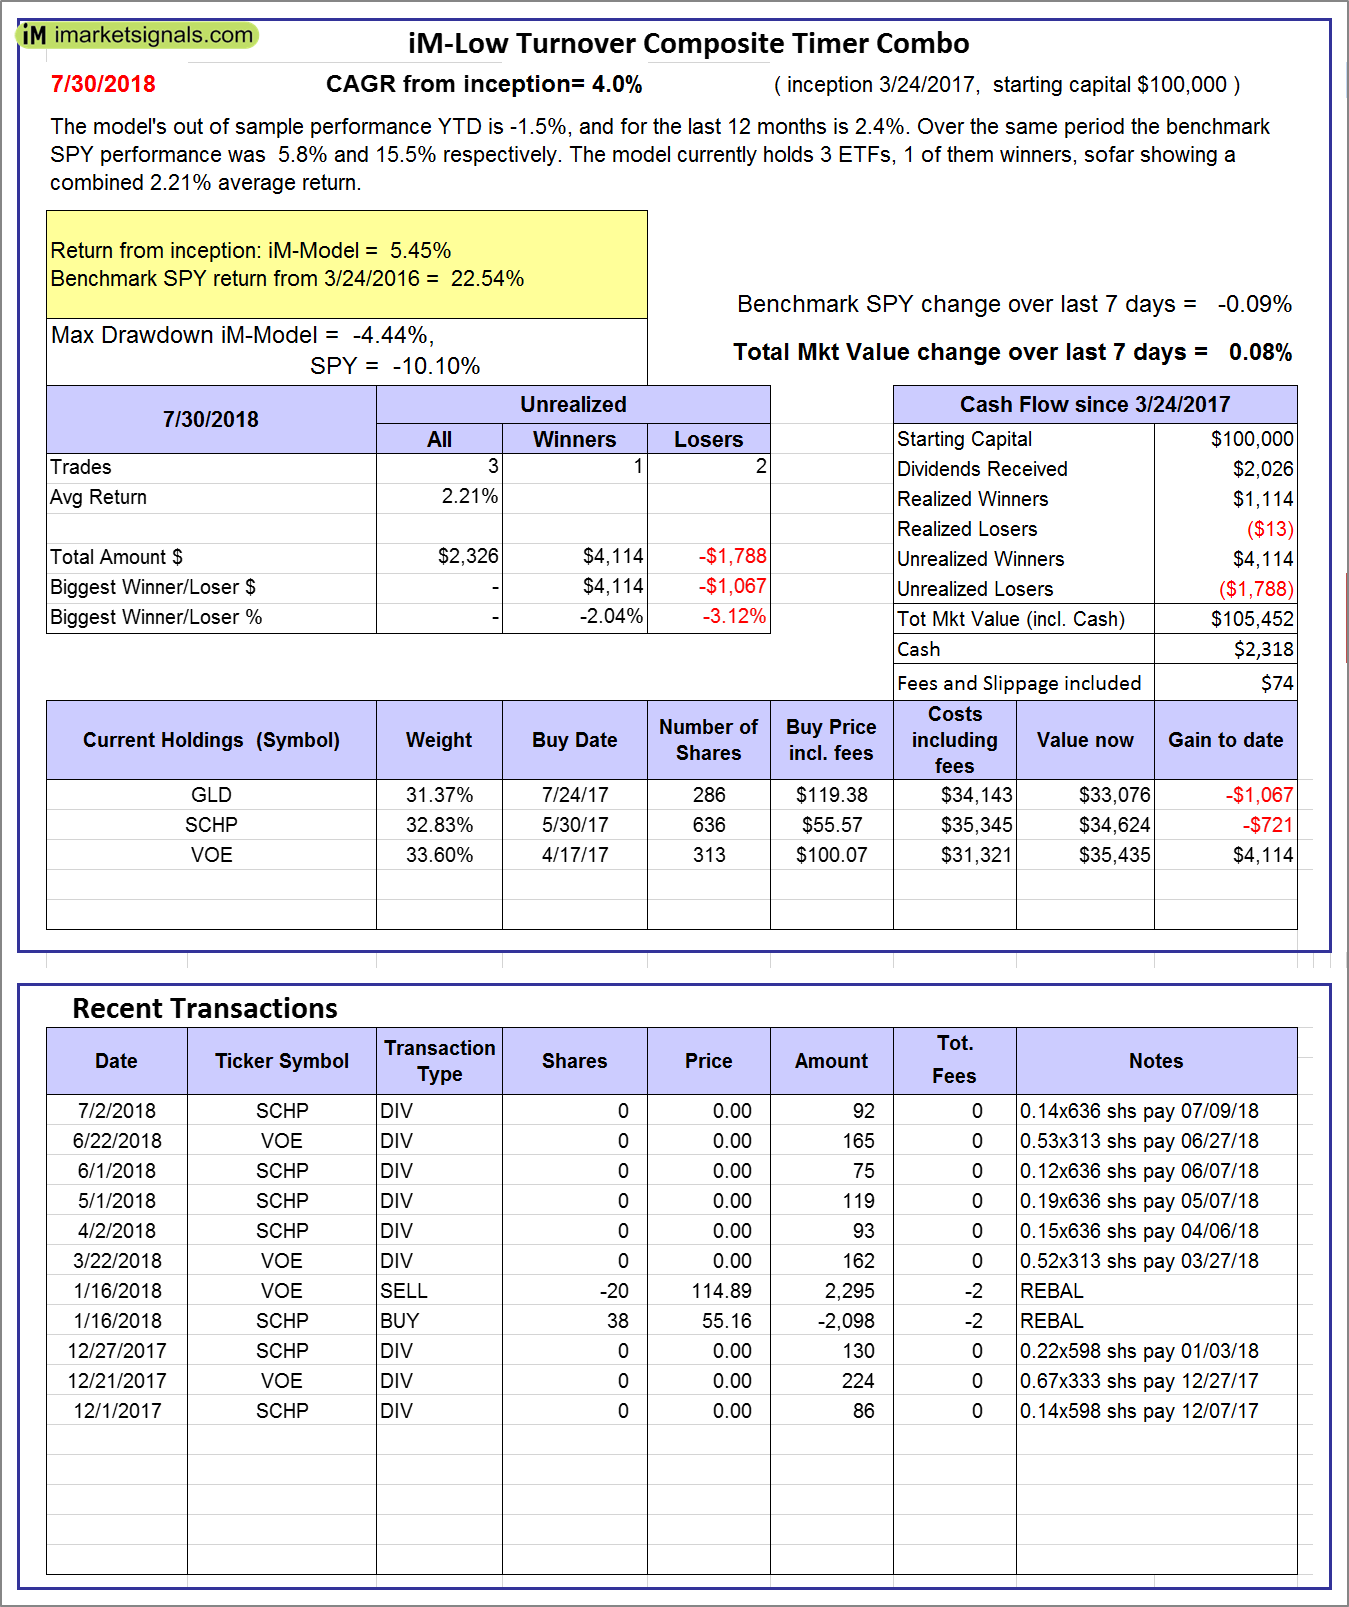
iM-Low Turnover Composite Timer Combo: The model’s out of sample performance YTD is -1.5%, and for the last 12 months is 2.4%. Over the same period the benchmark SPY performance was 5.8% and 15.5% respectively. Over the previous week the market value of the iM-Low Turnover Composite Timer Combo gained 0.08% at a time when SPY gained -0.09%. A starting capital of $100,000 at inception on 3/24/27 would have grown to $105,452 which includes $2,318 cash and excludes $74 spent on fees and slippage. |
|
|
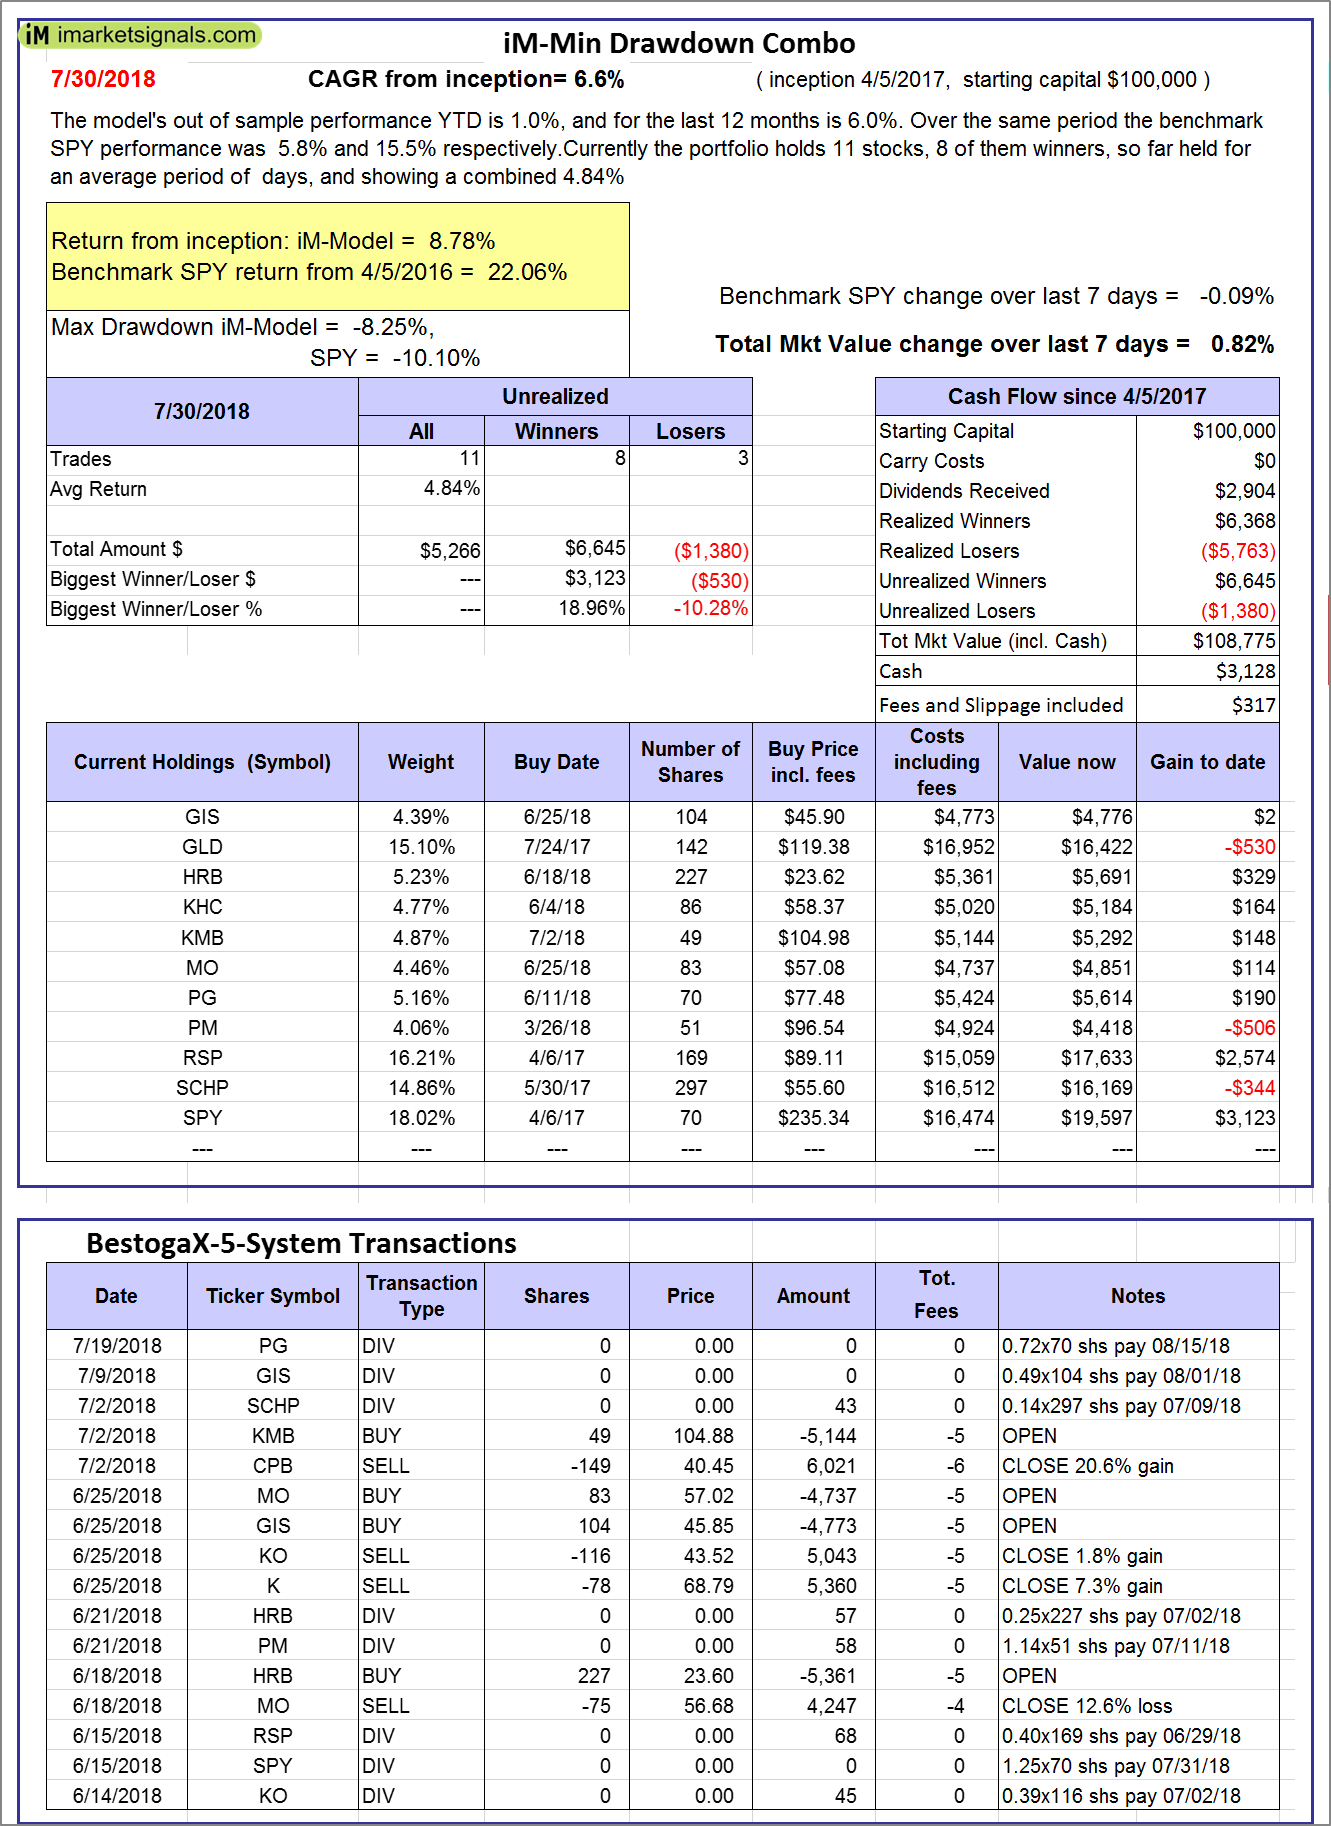
iM-Min Drawdown Combo: The model’s out of sample performance YTD is 1.0%, and for the last 12 months is 6.0%. Over the same period the benchmark SPY performance was 5.8% and 15.5% respectively. Over the previous week the market value of the iM-Min Drawdown Combo gained 0.82% at a time when SPY gained -0.09%. A starting capital of $100,000 at inception on 4/5/2017 would have grown to $108,775 which includes $3,128 cash and excludes $317 spent on fees and slippage. |
|
|
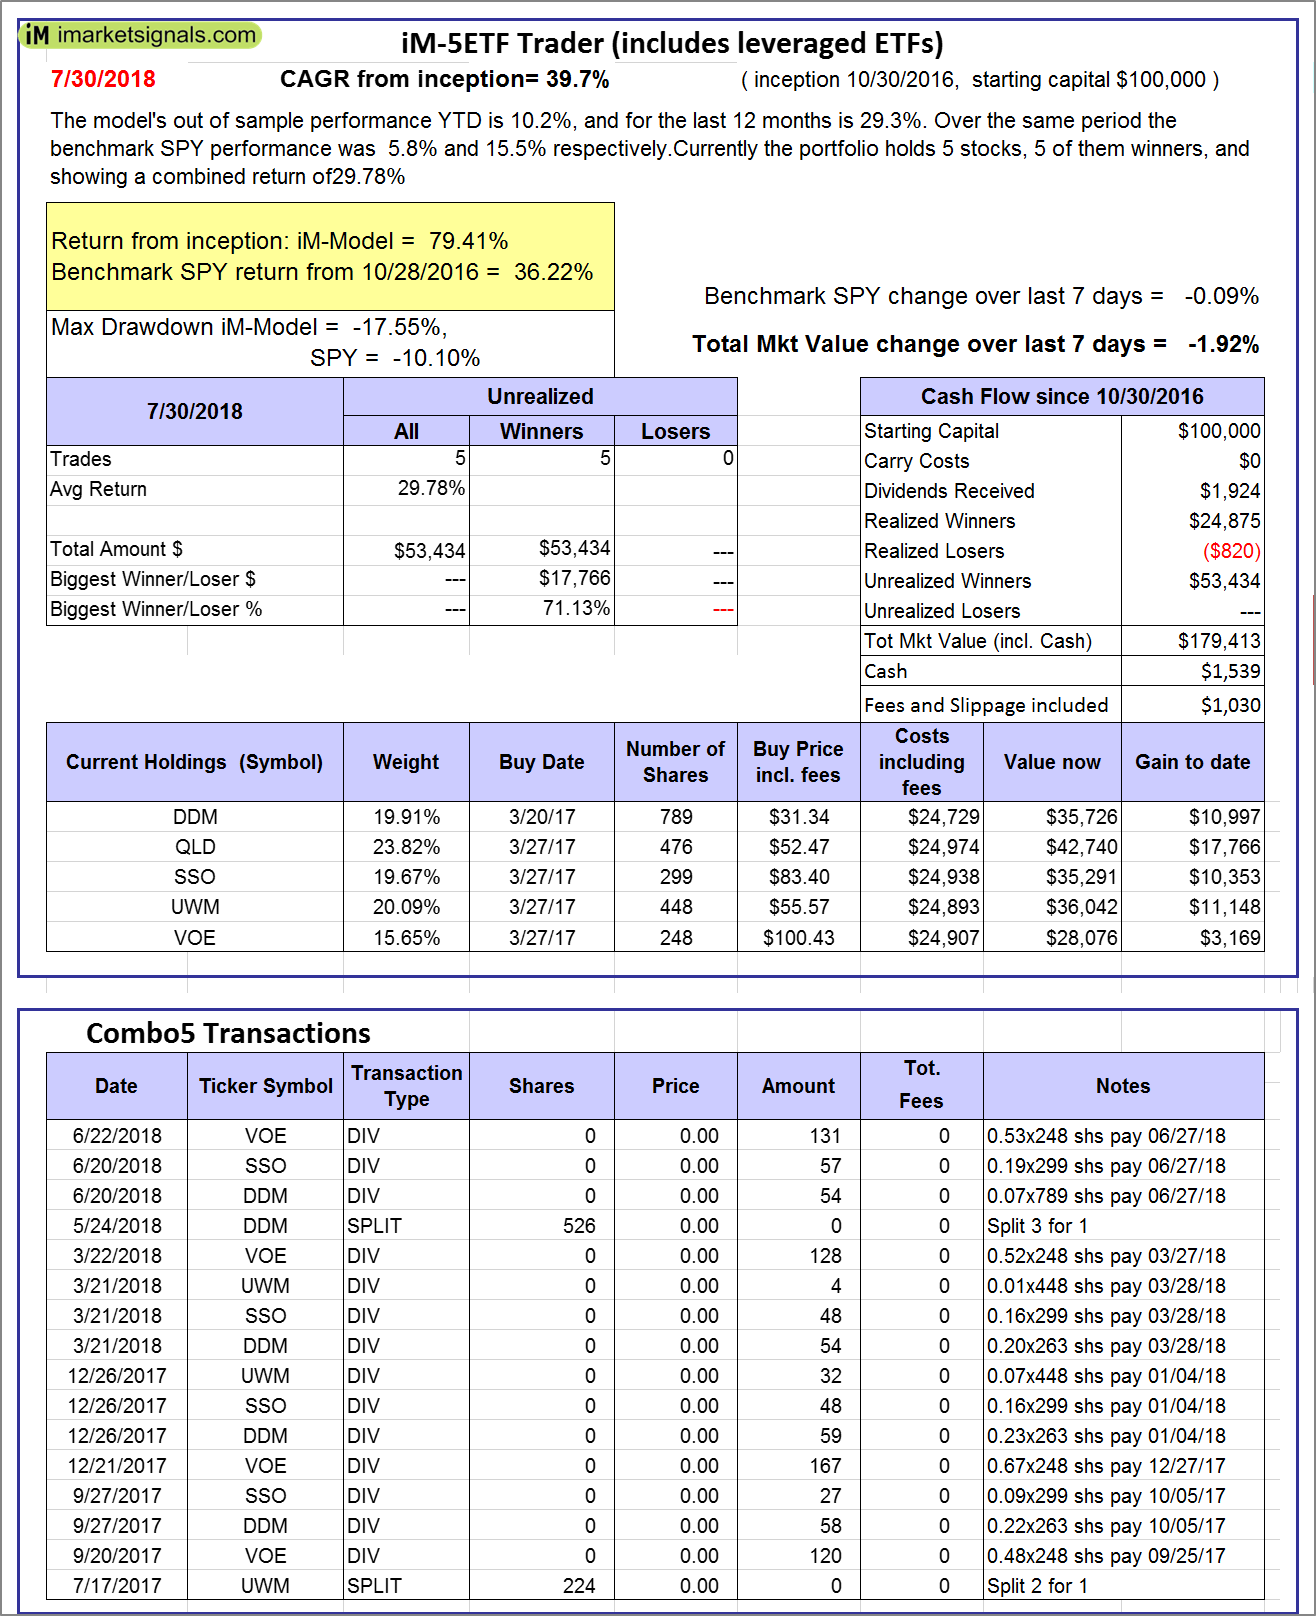
iM-5ETF Trader (includes leveraged ETFs): The model’s out of sample performance YTD is 10.2%, and for the last 12 months is 29.3%. Over the same period the benchmark SPY performance was 5.8% and 15.5% respectively. Over the previous week the market value of the iM-5ETF Trader (includes leveraged ETFs) gained -1.92% at a time when SPY gained -0.09%. A starting capital of $100,000 at inception on 10/30/2016 would have grown to $179,413 which includes $1,539 cash and excludes $1,030 spent on fees and slippage. |
|
|
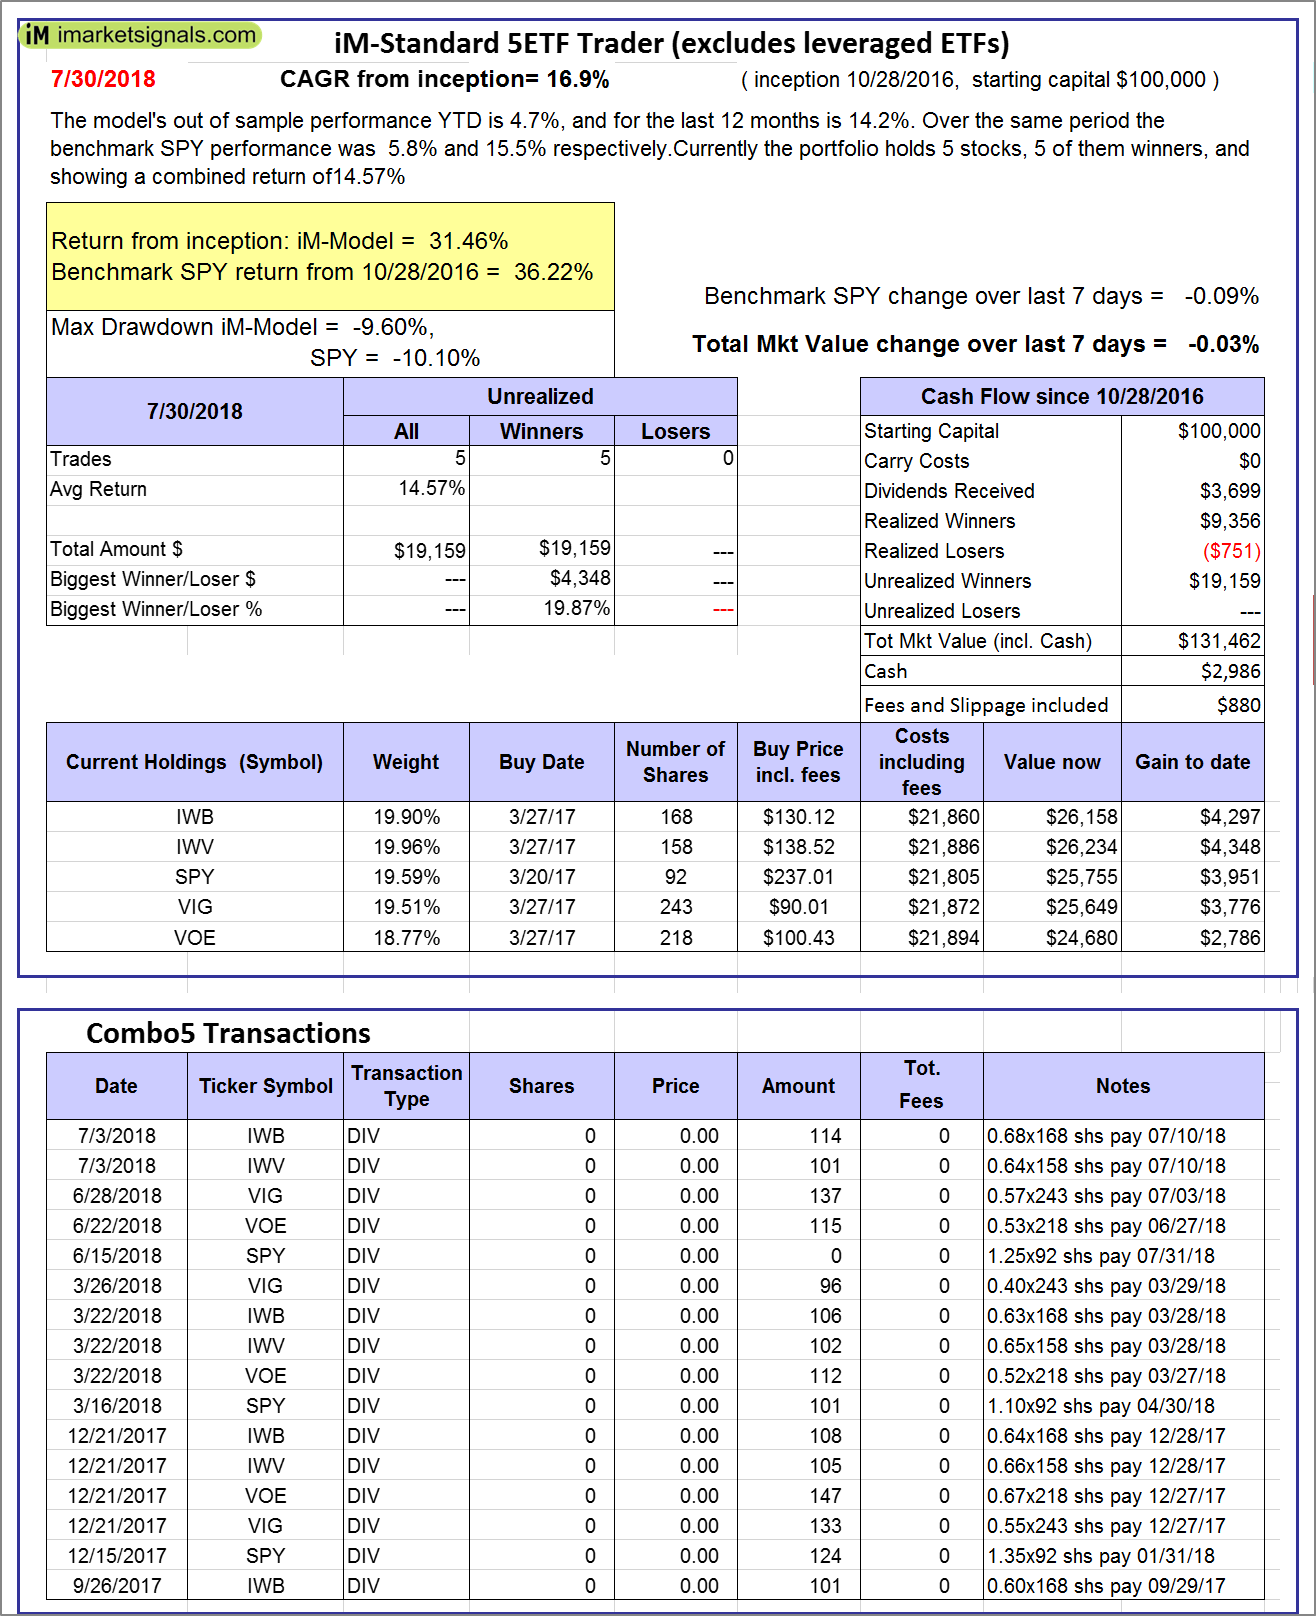
iM-Standard 5ETF Trader (excludes leveraged ETFs): The model’s out of sample performance YTD is 4.7%, and for the last 12 months is 14.2%. Over the same period the benchmark SPY performance was 5.8% and 15.5% respectively. Over the previous week the market value of the iM-Standard 5ETF Trader (excludes leveraged ETFs) gained -0.03% at a time when SPY gained -0.09%. A starting capital of $100,000 at inception on 10/30/2016 would have grown to $131,462 which includes $2,986 cash and excludes $880 spent on fees and slippage. |


Leave a Reply
You must be logged in to post a comment.