  |
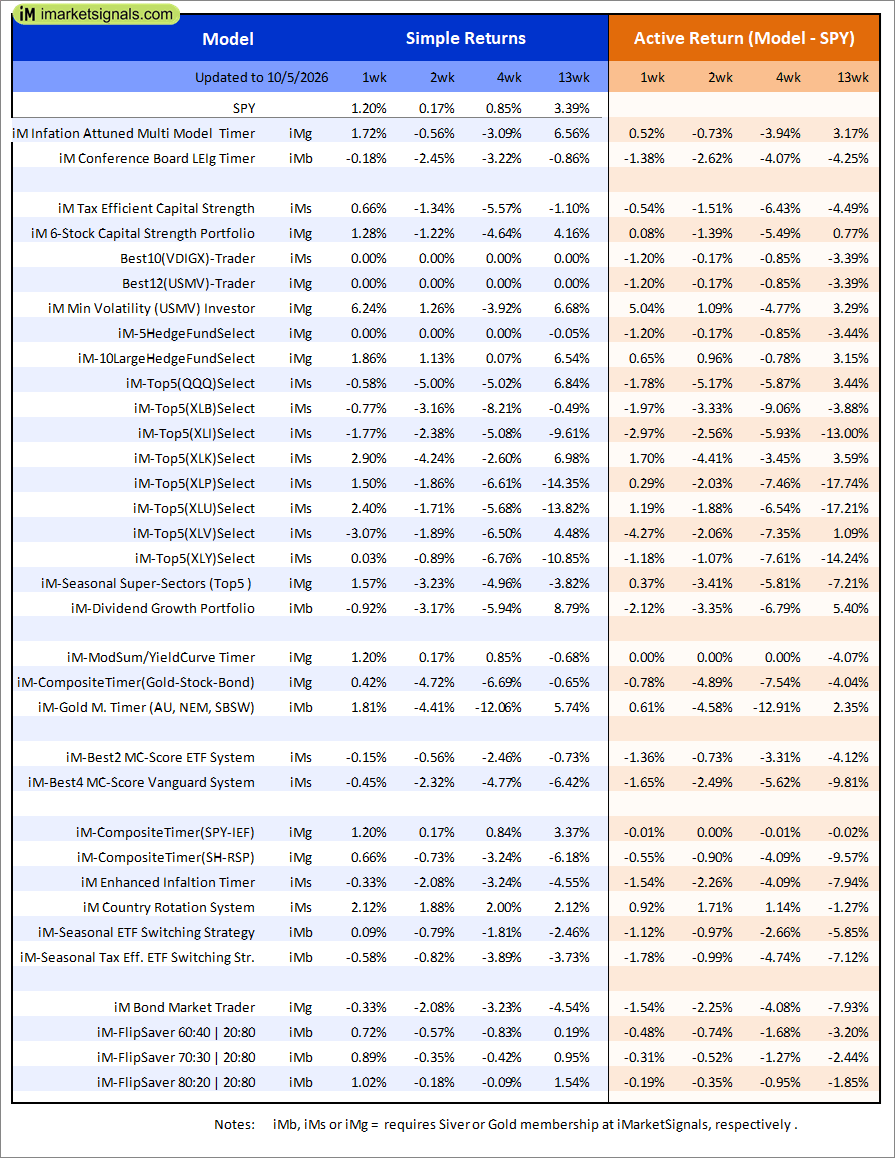
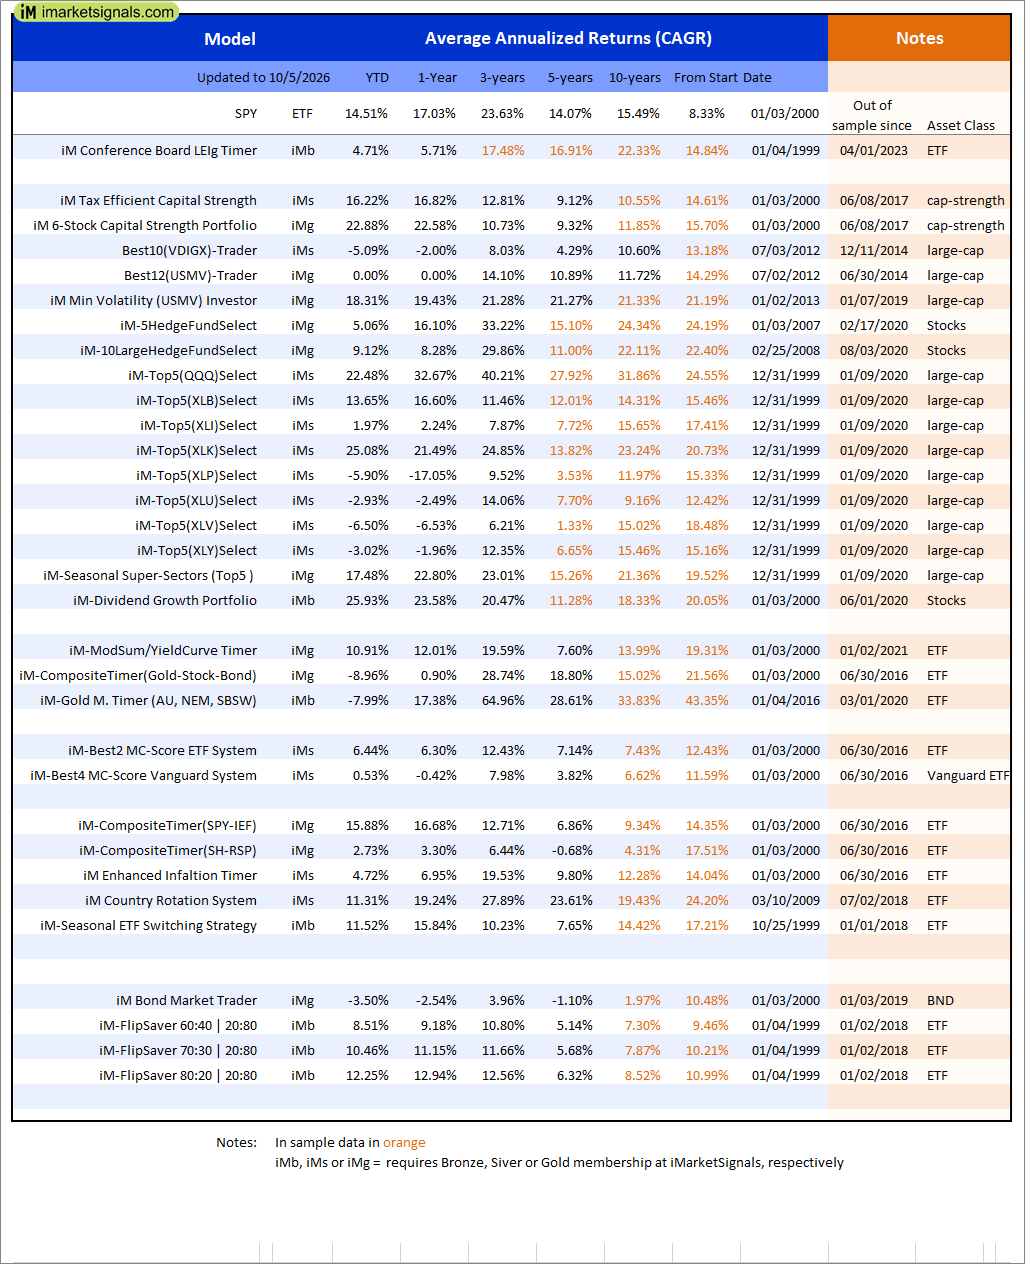
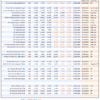
Out of sample performance summary of our models for the past 1, 2, 4 and 13 week periods. The active active return indicates how the models over- or underperformed the benchmark ETF SPY. Also the YTD, and the 1-, 3-, 5- and 10-year annualized returns are shown in the second table |
|
|
iM-Inflation Attuned Multi-Model Market Timer: The model’s out of sample performance YTD is 5.8%, and for the last 12 months is 6.0%. Over the same period the benchmark SPY performance was 14.5% and 17.0% respectively. Over the previous week the market value of the iM-Inflation Attuned Multi-Model Market Timer gained 1.72% at a time when SPY gained 1.20%. A starting capital of $100,000 at inception on 3/24/2017 would have grown to $161,978,810 which includes $4,109,301 cash and excludes $4,103,439 spent on fees and slippage. |
|
|
iM-Conference Board LEIg Timer: The model’s performance YTD is 14.3%, and for the last 12 months is 7.3%. Over the same period the benchmark SPY performance was 20.1% and 9.4% respectively. Over the previous week the market value of the iM-Conference Board LEIg Timer gained -0.16% at a time when SPY gained 1.20%. A starting capital of $100,000 at inception on 4/5/2017 would have grown to $749,165 which includes $9,534 cash and excludes $769 spent on fees and slippage. |
|
|
iM-FlipSaver 60:40 | 20:80 – 2017: The model’s out of sample performance YTD is 8.7%, and for the last 12 months is 9.2%. Over the same period the benchmark E60B40 performance was 7.4% and 9.2% respectively. Over the previous week the market value of iM-FlipSaver 80:20 | 20:80 gained 0.76% at a time when SPY gained 0.64%. A starting capital of $100,000 at inception on 7/16/2015 would have grown to $194,984 which includes $374 cash and excludes $5,614 spent on fees and slippage. |
|
|
iM-FlipSaver 70:30 | 20:80 – 2017: The model’s out of sample performance YTD is 10.5%, and for the last 12 months is 11.0%. Over the same period the benchmark E60B40 performance was 7.4% and 9.2% respectively. Over the previous week the market value of iM-FlipSaver 70:30 | 20:80 gained 0.89% at a time when SPY gained 0.64%. A starting capital of $100,000 at inception on 7/15/2015 would have grown to $206,381 which includes $830 cash and excludes $5,886 spent on fees and slippage. |
|
|
iM-FlipSaver 80:20 | 20:80 – 2017: The model’s out of sample performance YTD is 12.2%, and for the last 12 months is 12.8%. Over the same period the benchmark E60B40 performance was 7.4% and 9.2% respectively. Over the previous week the market value of iM-FlipSaver 80:20 | 20:80 gained 1.02% at a time when SPY gained 0.64%. A starting capital of $100,000 at inception on 1/2/2017 would have grown to $217,969 which includes $60 cash and excludes $6,150 spent on fees and slippage. |
|
|
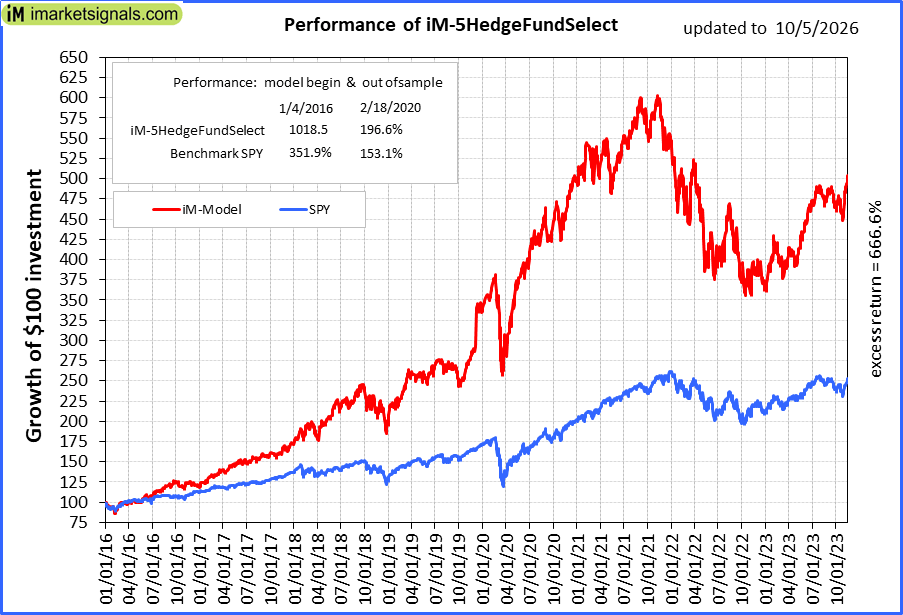
iM-5HedgeFundSelect: Since inception, on 1/5/2016, the model gained 1018.55% while the benchmark SPY gained 351.93% over the same period. Over the previous week the market value of iM-5HedgeFundSelect gained 3.26% at a time when SPY gained 1.20%. A starting capital of $25,000 at inception on 1/5/2016 would have grown to $279,637 which includes $9,818 cash and excludes $3,596 spent on fees and slippage. |
|
|
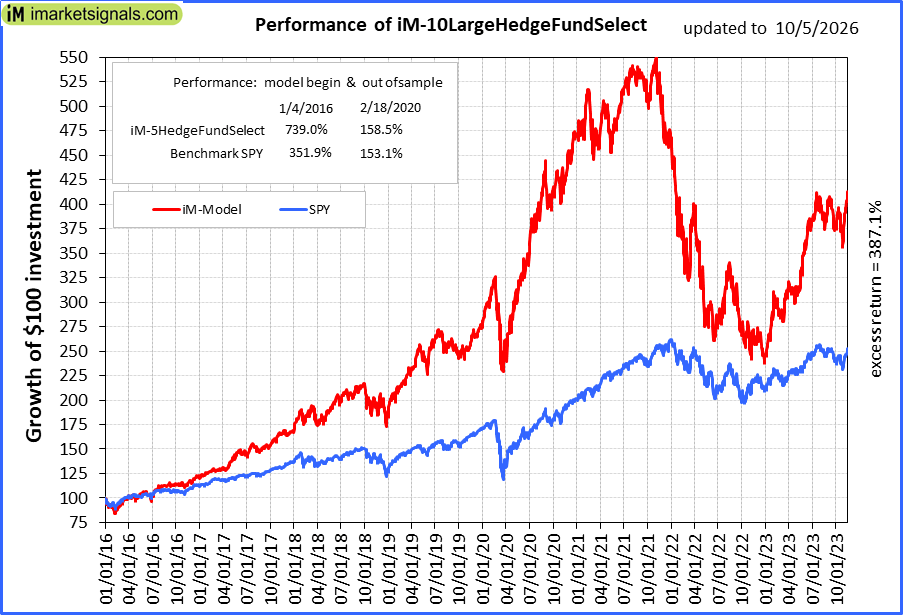
iM-10LargeHedgeFundSelect: Since inception, on 1/5/2016, the model gained 739.03% while the benchmark SPY gained 351.93% over the same period. Over the previous week the market value of iM-10LargeHedgeFundSelect gained 1.86% at a time when SPY gained 1.20%. A starting capital of $25,000 at inception on 1/5/2016 would have grown to $199,307 which includes -$9,772 cash and excludes $2,084 spent on fees and slippage. |
|
|
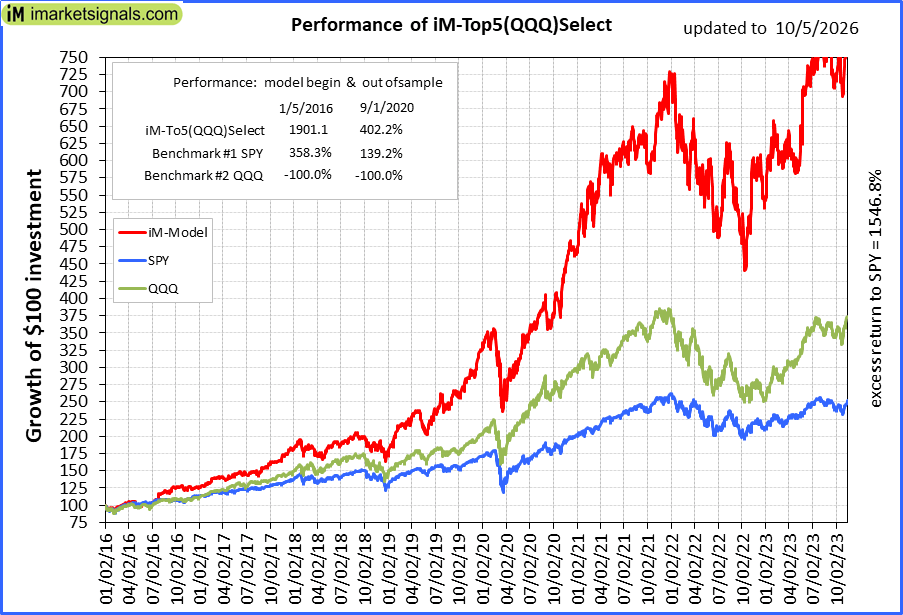
iM-Top5(QQQ)Select: Since inception, on 1/5/2016, the model gained 1898.77% while the benchmark SPY gained 351.93% over the same period. Over the previous week the market value of iM-Top5(QQQ)Select gained -0.58% at a time when SPY gained 1.20%. A starting capital of $100,000 at inception on 1/5/2016 would have grown to $1,998,768 which includes -$27,079 cash and excludes $35,396 spent on fees and slippage. |
|
|
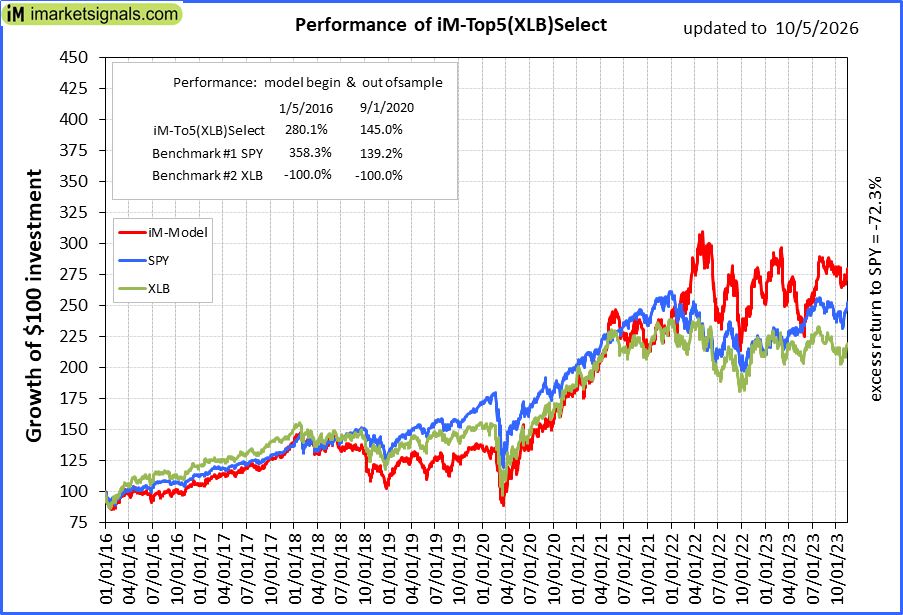
iM-Top5(XLB)Select: Since inception, on 1/5/2016, the model gained 279.68% while the benchmark SPY gained 351.93% over the same period. Over the previous week the market value of iM-Top5(XLB)Select gained -0.77% at a time when SPY gained 1.20%. A starting capital of $100,000 at inception on 1/5/2016 would have grown to $379,682 which includes $3,848 cash and excludes $18,262 spent on fees and slippage. |
|
|
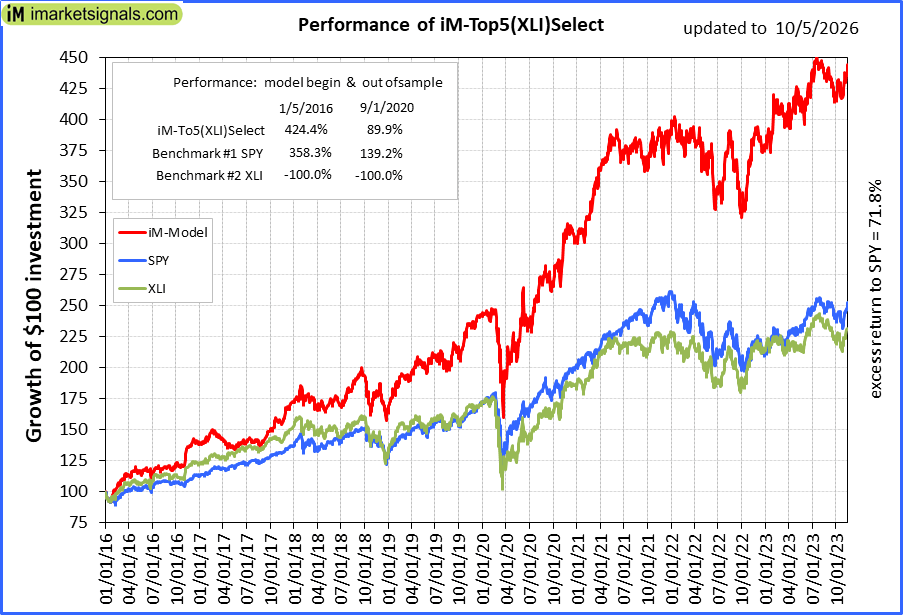
iM-Top5(XLI)Select: Since inception, on 1/5/2016, the model gained 423.76% while the benchmark SPY gained 351.93% over the same period. Over the previous week the market value of iM-Top5(XLI)Select gained -1.77% at a time when SPY gained 1.20%. A starting capital of $100,000 at inception on 1/5/2016 would have grown to $523,760 which includes $3,704 cash and excludes $10,212 spent on fees and slippage. |
|
|
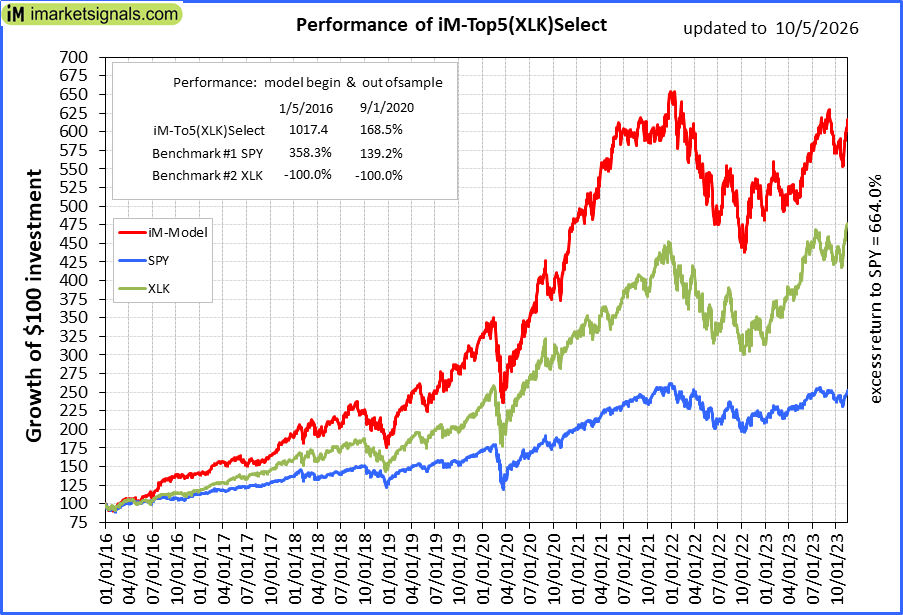
iM-Top5(XLK)Select: Since inception, on 1/5/2016, the model gained 1015.96% while the benchmark SPY gained 351.93% over the same period. Over the previous week the market value of iM-Top5(XLK)Select gained 2.91% at a time when SPY gained 1.20%. A starting capital of $100,000 at inception on 1/5/2016 would have grown to $1,115,964 which includes $3,728 cash and excludes $3,886 spent on fees and slippage. |
|
|
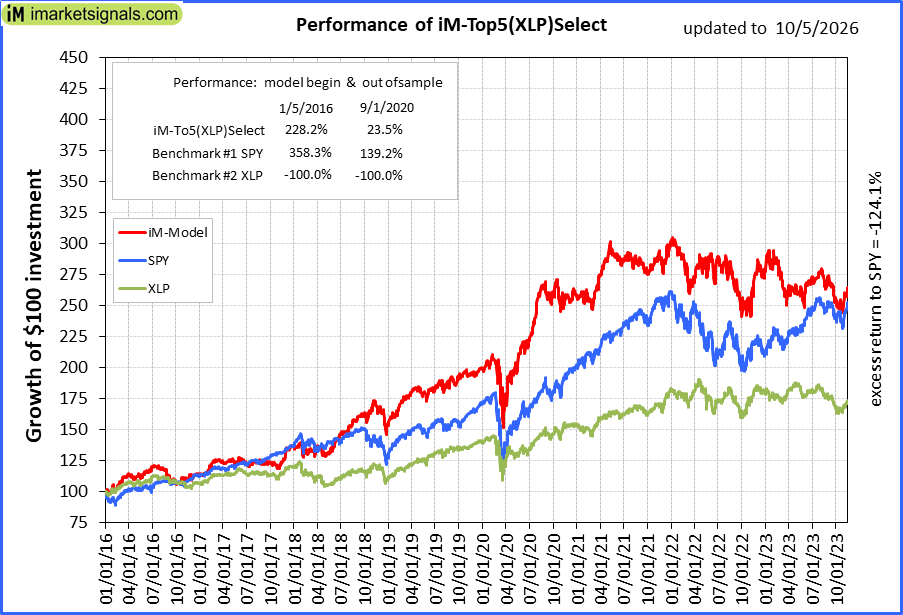
iM-Top5(XLP)Select: Since inception, on 1/5/2016, the model gained 227.81% while the benchmark SPY gained 351.93% over the same period. Over the previous week the market value of iM-Top5(XLP)Select gained 1.49% at a time when SPY gained 1.20%. A starting capital of $100,000 at inception on 1/5/2016 would have grown to $327,806 which includes -$1,368 cash and excludes $3,653 spent on fees and slippage. |
|
|
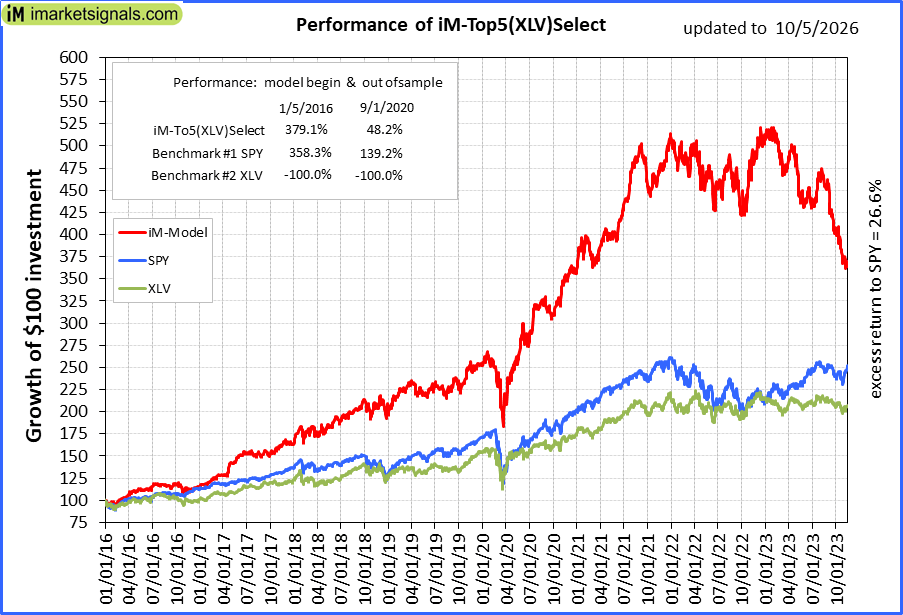
iM-Top5(XLV)Select: Since inception, on 1/5/2016, the model gained 378.54% while the benchmark SPY gained 351.93% over the same period. Over the previous week the market value of iM-Top5(XLV)Select gained -3.07% at a time when SPY gained 1.20%. A starting capital of $100,000 at inception on 1/5/2016 would have grown to $478,536 which includes -$9,969 cash and excludes $20,936 spent on fees and slippage. |
|
|
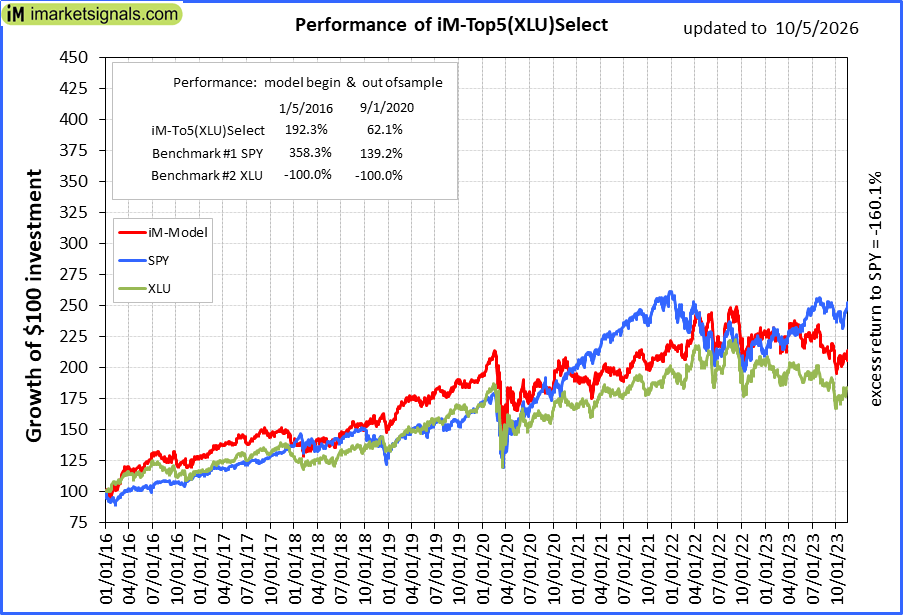
iM-Top5(XLU)Select: Since inception, on 1/5/2016, the model gained 191.87% while the benchmark SPY gained 351.93% over the same period. Over the previous week the market value of iM-Top5(XLU)Select gained 2.40% at a time when SPY gained 1.20%. A starting capital of $100,000 at inception on 1/5/2016 would have grown to $291,875 which includes $2,867 cash and excludes $19,252 spent on fees and slippage. |
|
|
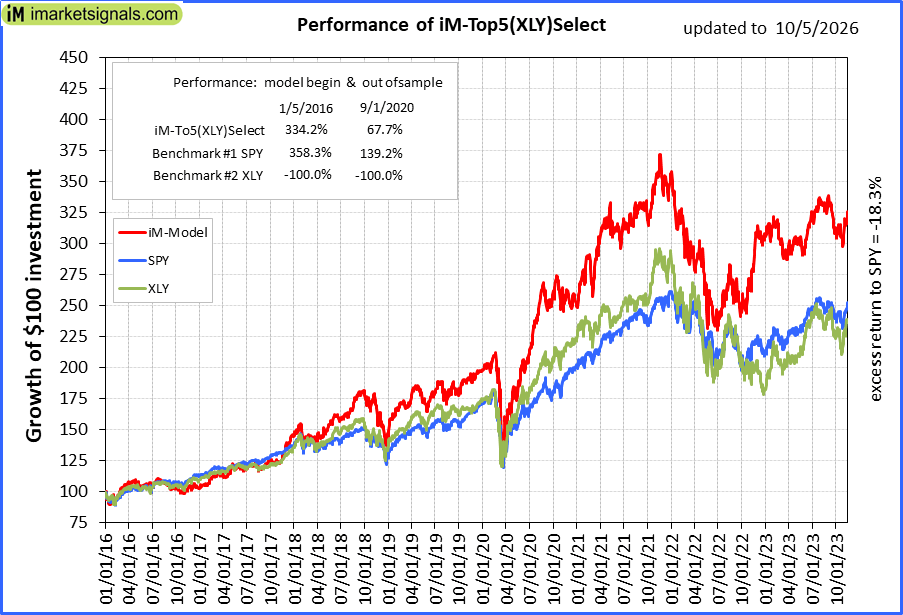
iM-Top5(XLY)Select: Since inception, on 1/5/2016, the model gained 333.68% while the benchmark SPY gained 351.93% over the same period. Over the previous week the market value of iM-Top5(XLY)Select gained 0.03% at a time when SPY gained 1.20%. A starting capital of $100,000 at inception on 1/5/2016 would have grown to $433,676 which includes $450 cash and excludes $8,952 spent on fees and slippage. |
|
|
iM-Seasonal Super-Sectors (Top5 combo) : Since inception, on 11/17/2020, the model gained 142.71% while the benchmark SPY gained 134.60% over the same period. Over the previous week the market value of iM-Seasonal Super-Sectors (Top5 combo) gained 1.57% at a time when SPY gained 1.20%. A starting capital of $100,000 at inception on 11/17/2020 would have grown to $242,709 which includes -$476 cash and excludes $00 spent on fees and slippage. |
|
|
iM-Dividend Growth Portfolio: The model’s out of sample performance YTD is 25.1%, and for the last 12 months is 23.4%. Over the same period the benchmark SPY performance was 14.5% and 17.0% respectively. Over the previous week the market value of the iM-Dividend Growth Portfolio gained -1.21% at a time when SPY gained 1.20%. A starting capital of $100,000 at inception on 6/30/2016 would have grown to $666,486 which includes $1,552 cash and excludes $16,095 spent on fees and slippage. |
|
|
iM-Gold Momentum Timer (AU, NEM, SBSW): The model’s out of sample performance YTD is -8.0%, and for the last 12 months is 17.4%. Over the same period the benchmark SPY performance was 14.5% and 17.0% respectively. Over the previous week the market value of iM-Gold Momentum Timer (AU, NEM, SBSW) gained 1.81% at a time when SPY gained 1.20%. A starting capital of $100,000 at inception on 6/30/2016 would have grown to $80,326 which includes $299,177 cash and excludes Gain to date spent on fees and slippage. |
|
|
iM-ModSum/YieldCurve Timer: The model’s out of sample performance YTD is 10.9%, and for the last 12 months is 11.7%. Over the same period the benchmark SPY performance was 14.5% and 17.0% respectively. Over the previous week the market value of iM-PortSum/YieldCurve Timer gained 1.20% at a time when SPY gained 1.20%. A starting capital of $100,000 at inception on 1/1/2016 would have grown to $424,751 which includes $144 cash and excludes $2,605 spent on fees and slippage. |
|
|
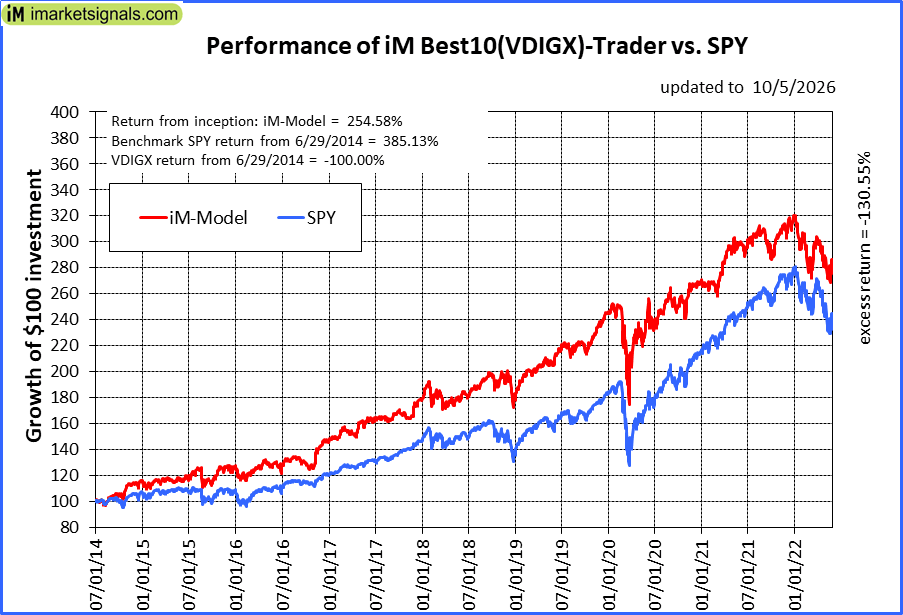
iM-Best10(VDIGX)-Trader: The model’s out of sample performance YTD is -4.8%, and for the last 12 months is -1.7%. Over the same period the benchmark SPY performance was 14.5% and 17.0% respectively. Since inception, on 7/1/2014, the model gained 254.58% while the benchmark SPY gained 385.13% and VDIGX gained -100.00% over the same period. Over the previous week the market value of iM-Best10(VDIGX) gained -0.06% at a time when SPY gained 1.20%. A starting capital of $100,000 at inception on 7/1/2014 would have grown to $354,582 which includes $656 cash and excludes $5,808 spent on fees and slippage. |
|
|
iM 6-Stock Capital Strength Portfolio: The model’s out of sample performance YTD is 22.3%, and for the last 12 months is 22.2%. Over the same period the benchmark SPY performance was 14.5% and 17.0% respectively. Over the previous week the market value of the iM 6-Stock Capital Strength Portfolio gained 0.86% at a time when SPY gained 1.20%. A starting capital of $100,000 at inception on 10/28/2016 would have grown to $314,065 which includes $2,680 cash and excludes $4,732 spent on fees and slippage. |
|
|
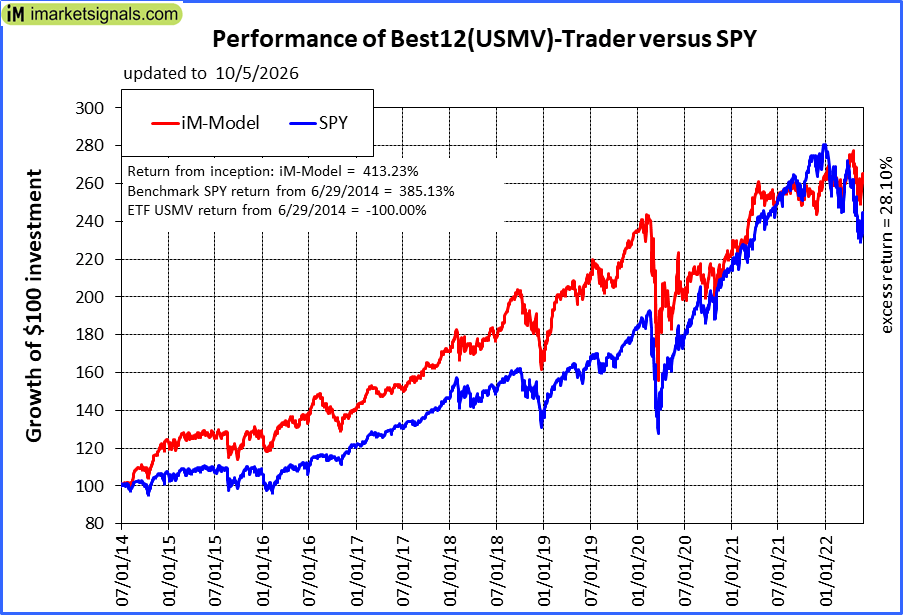
iM-Best12(USMV)-Trader: The model’s out of sample performance YTD is 20.1%, and for the last 12 months is 23.0%. Over the same period the benchmark SPY performance was 14.5% and 17.0% respectively. Since inception, on 6/30/2014, the model gained 413.23% while the benchmark SPY gained 385.13% and the ETF USMV gained -100.00% over the same period. Over the previous week the market value of iM-Best12(USMV)-Trader gained -0.06% at a time when SPY gained 1.20%. A starting capital of $100,000 at inception on 6/30/2014 would have grown to $513,232 which includes $1,728 cash and excludes $9,286 spent on fees and slippage. |
|
|
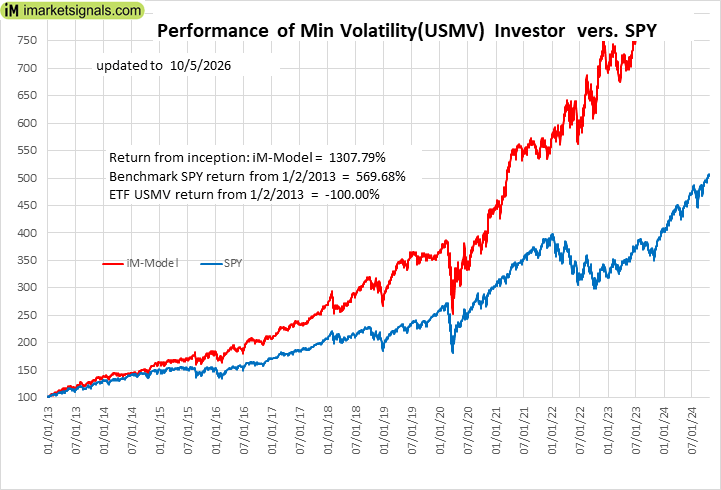
iM-Min Volatility(USMV) Investor (Tax Efficient): The model’s out of sample performance YTD is 18.3%, and for the last 12 months is 19.3%. Over the same period the benchmark SPY performance was 14.5% and 17.0% respectively. Since inception, on 1/3/2013, the model gained 1307.79% while the benchmark SPY gained 569.68% and the ETF USMV gained -100.00% over the same period. Over the previous week the market value of iM-Best12(USMV)Q1 gained 6.24% at a time when SPY gained 1.20%. A starting capital of $100,000 at inception on 1/3/2013 would have grown to $1,407,789 which includes $332 cash and excludes $18,138 spent on fees and slippage. |
|
|
iM-Bond Market Trader (High-Yield Bond or 10-yr Treasury Bond): The model’s out of sample performance YTD is -3.5%, and for the last 12 months is -2.8%. Over the same period the benchmark BND performance was -2.8% and -2.1% respectively. Over the previous week the market value of the iM-Bond Market Trader (High-Yield Bond or 10-yr Treasury Bond) gained -0.33% at a time when BND gained -0.22%. A starting capital of $10,000 at inception on 1/3/2000 would have grown to $143,875 which includes $2,492 cash and excludes $2,977 spent on fees and slippage. |
|
|
iM-ModSum/YieldCurve Timer: The model’s out of sample performance YTD is 10.9%, and for the last 12 months is 11.7%. Over the same period the benchmark SPY performance was 14.5% and 17.0% respectively. Over the previous week the market value of iM-PortSum/YieldCurve Timer gained 1.20% at a time when SPY gained 1.20%. A starting capital of $100,000 at inception on 1/1/2016 would have grown to $424,751 which includes $144 cash and excludes $2,605 spent on fees and slippage. |
|
|
iM-Best2 MC-Score ETF System: The model’s out of sample performance YTD is 6.4%, and for the last 12 months is 6.3%. Over the same period the benchmark SPY performance was 14.5% and 17.0% respectively. Over the previous week the market value of the iM-Best2 MC-Score ETF System gained -0.15% at a time when SPY gained 1.20%. A starting capital of $100,000 at inception on 6/30/2016 would have grown to $200,271 which includes $2,974 cash and excludes $5,779 spent on fees and slippage. |
|
|
iM-Best4 MC-Score Vanguard System: The model’s out of sample performance YTD is 0.5%, and for the last 12 months is -0.4%. Over the same period the benchmark SPY performance was 14.5% and 17.0% respectively. Over the previous week the market value of the iM-Best4 MC-Score Vanguard System gained -0.45% at a time when SPY gained 1.20%. A starting capital of $100,000 at inception on 6/30/2016 would have grown to $183,880 which includes $8,854 cash and excludes $00 spent on fees and slippage. |
|
|
iM-Composite (SPY-IEF) Timer: The model’s out of sample performance YTD is 15.9%, and for the last 12 months is 16.7%. Over the same period the benchmark SPY performance was 14.5% and 17.0% respectively. Over the previous week the market value of the iM-Composite (SPY-IEF) Timer gained 1.19% at a time when SPY gained 1.20%. A starting capital of $100,000 at inception on 6/30/2016 would have grown to $250,877 which includes $2,156 cash and excludes $8,651 spent on fees and slippage. |
|
|
iM-Composite(Gold-Stocks-Bond) Timer: The model’s out of sample performance YTD is -9.0%, and for the last 12 months is 0.9%. Over the same period the benchmark SPY performance was 14.5% and 17.0% respectively. Over the previous week the market value of the iM-Composite(Gold-Stocks-Bond) Timer gained 0.42% at a time when SPY gained 1.20%. A starting capital of $100,000 at inception on 6/30/2016 would have grown to $367,623 which includes $188 cash and excludes $10,872 spent on fees and slippage. |