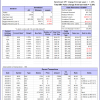
 Currently the portfolio holds 10 stocks, 7 of them winners, so far held for an average period of 65 days, and showing combined 3.93% average return to 8/5/2013
Read more >
Blog Archives
Best10 8-5-13
Monthly 8-2-13
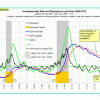
Based on the historic patterns of the unemployment rate indicators prior to recessions one can reasonably conclude that the U.S. economy is currently not close to a recession. The indicator pattern is consistent with those from prior in-between recession periods.
Read more >
iM Update 8-2-13
The IBH stock market model is out of the market. The MAC stock market model is invested, the bond market model avoids high beta (long) bonds, the yield curve is steepening, the gold model is not invested, but the silver model is invested. The recession indicators COMP and iM-BCIg are near last week’s levels. MAC-AU is also invested. The unemployment rate does not signal recession.
Best10 7-29-13
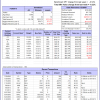 Currently the portfolio holds 10 stocks, 5 of them winners, so far held for an average period of 66 days, and showing combined 1.56% average return to 7/29/2013
Read more >
Best10 7-22-13
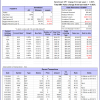 Currently the portfolio holds 10 stocks, 7 of them winners, so far held for an average period of 59 days, and showing combined 1.8% average return to 7/22/2013
Read more >
iM Update 7-26-13
Please also see the Best10 weekly update on the [Systems][Best10 Portfolio Management Systems] page.
Read more >
iM Update 7-19-13
The IBH stock market model is out of the market. The MAC stock market model is invested, the bond market model avoids high beta (long) bonds, the yield curve is steepening, the gold model is not invested, but the silver model is invested. The recession indicators COMP and iM-BCIg are near last week’s levels. MAC-AU is also invested.
Best10 7-15-13
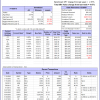
Currently the portfolio holds 10 stocks, 7 of them winners, so far held for an average period of 52 days, and showing combined 2.6% average return to 7/15/2013
Read more >
iM Update 7-12-13
Please also see the Best10 weekly update on the [Systems][Best10 Portfolio Management Systems] page.
Read more >
iM-Best10(S&P 1500): A Portfolio Management System for High Returns from the S&P 1500
Trading stock selected from the pool S&P1500 using the revised survivorship bias free Best10 portfolio management system would have generated returns of 49.2% for the period January 1999 to May 2013 and without draw-down protection 45.5%; both a multiple of the 3.8% that the SPY (the ETF tracking the S&P 500) produced over the same period.
