Latest iM-Systems performance tables for the seven systems are updated monthly

Blog Archives
03/31/2016: TIAA Real Estate Timed
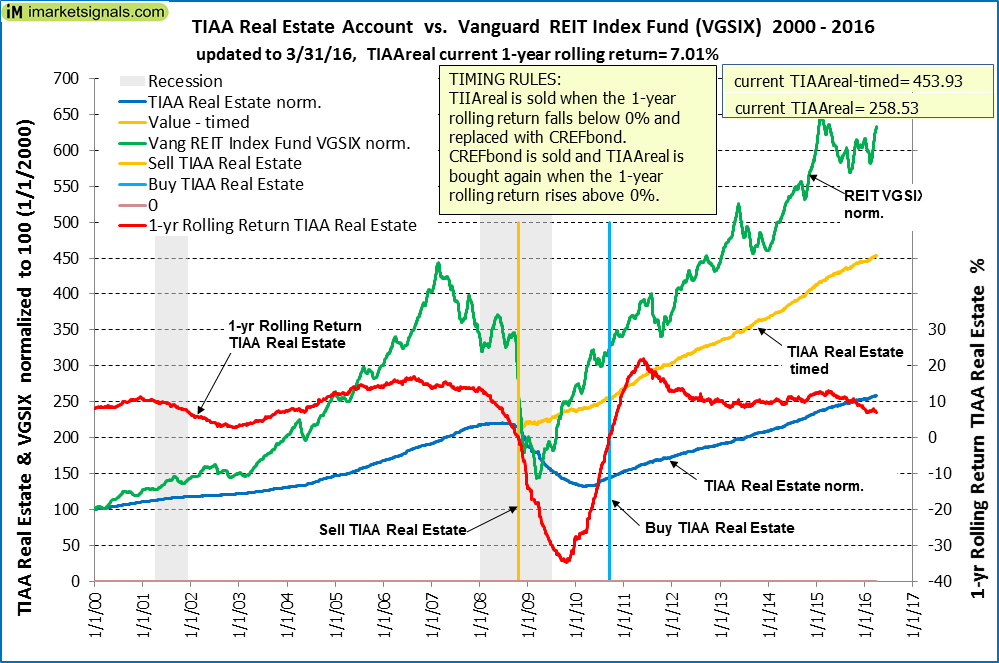 As of end March, 2016 the 1-year rolling return is 7.01%. The Vanguard REIT Index Fund is retreating from its all time high, however the good positive returns of TIAA Real Estate Account are expected to continue. A sell signal is not imminent. Read more …
Read more >
Posted in TIAA real timed
No Recession Is Signaled By iM’s Business Cycle Index: Update March 31, 2016
Knowing when the U.S. Economy is heading for recession is paramount for successful investment decisions. Our weekly Business Cycle Index (BCI) would have provided early reliably warnings for the past seven recessions.
Read more >
A New All-Time High for iM’s Business Cycle Index: Update March 24, 2016
Knowing when the U.S. Economy is heading for recession is paramount for successful investment decisions. Our weekly Business Cycle Index (BCI) would have provided early reliably warnings for the past seven recessions.
Read more >
iM-Best Reports – 3/21/2016
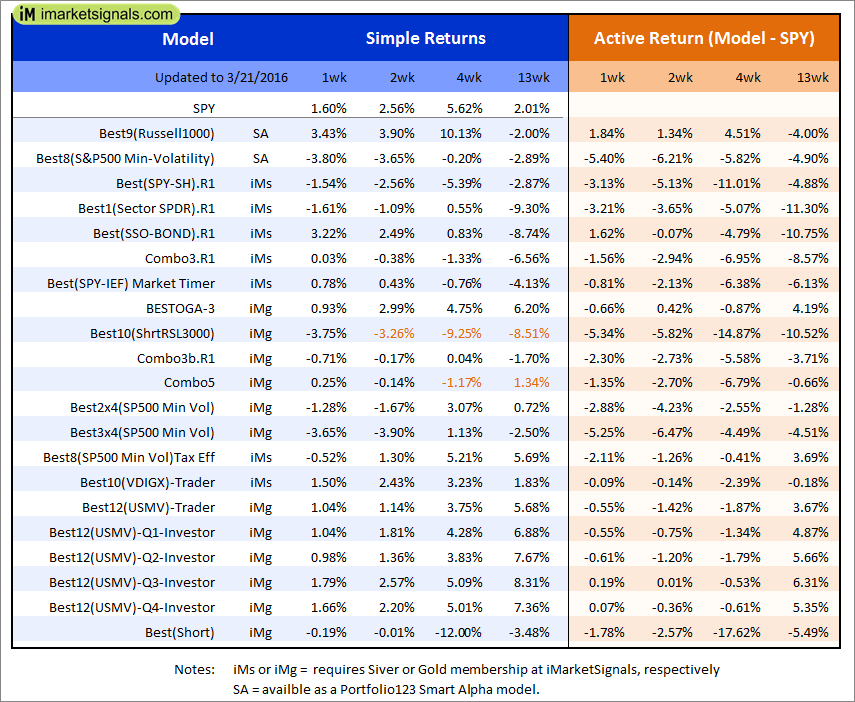 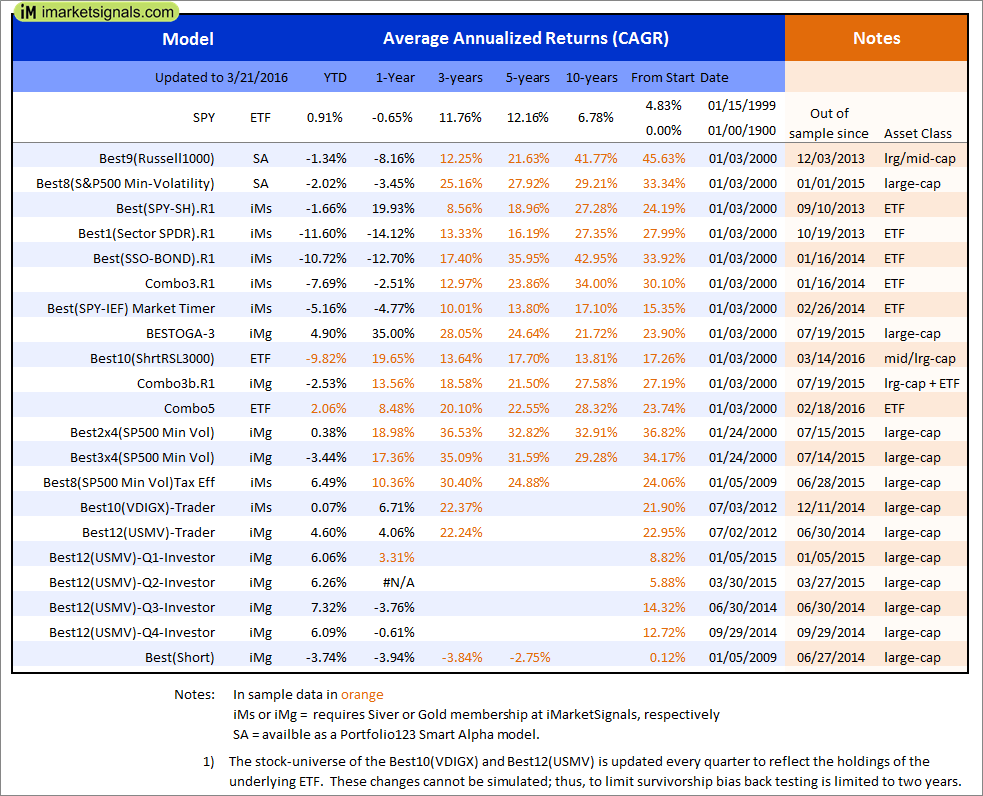 |
Out of sample performance summary of our models for the past 1, 2, 4 and 13 week periods. The active active return indicates how the models over- or underperformed the benchmark ETF SPY. Also the YTD, and the 1-, 3-, 5- and 10-year annualized returns are shown in the second table |
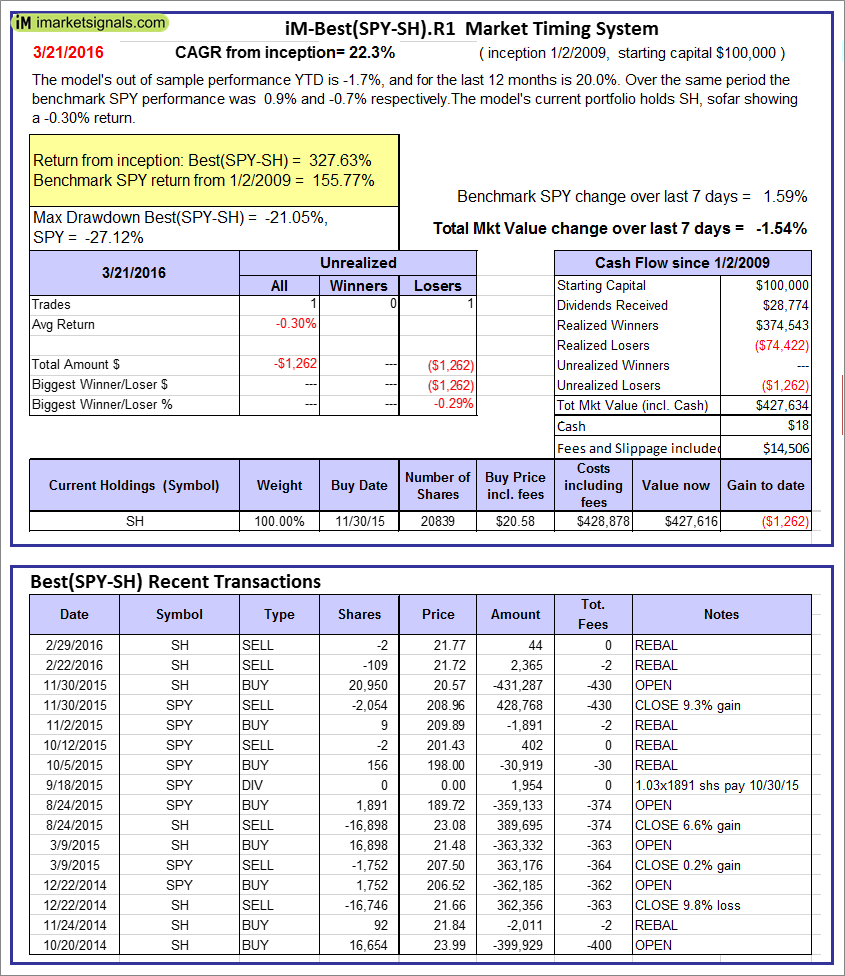 |
iM-Best(SPY-SH).R1: The model’s out of sample performance YTD is -1.7%, and for the last 12 months is 20.0%. Over the same period the benchmark SPY performance was 0.9% and -0.7% respectively. Over the previous week the market value of Best(SPY-SH) gained -1.54% at a time when SPY gained 1.59%. A starting capital of $100,000 at inception on 1/2/2009 would have grown to $427,634 which includes $18 cash and excludes $14,506 spent on fees and slippage. |
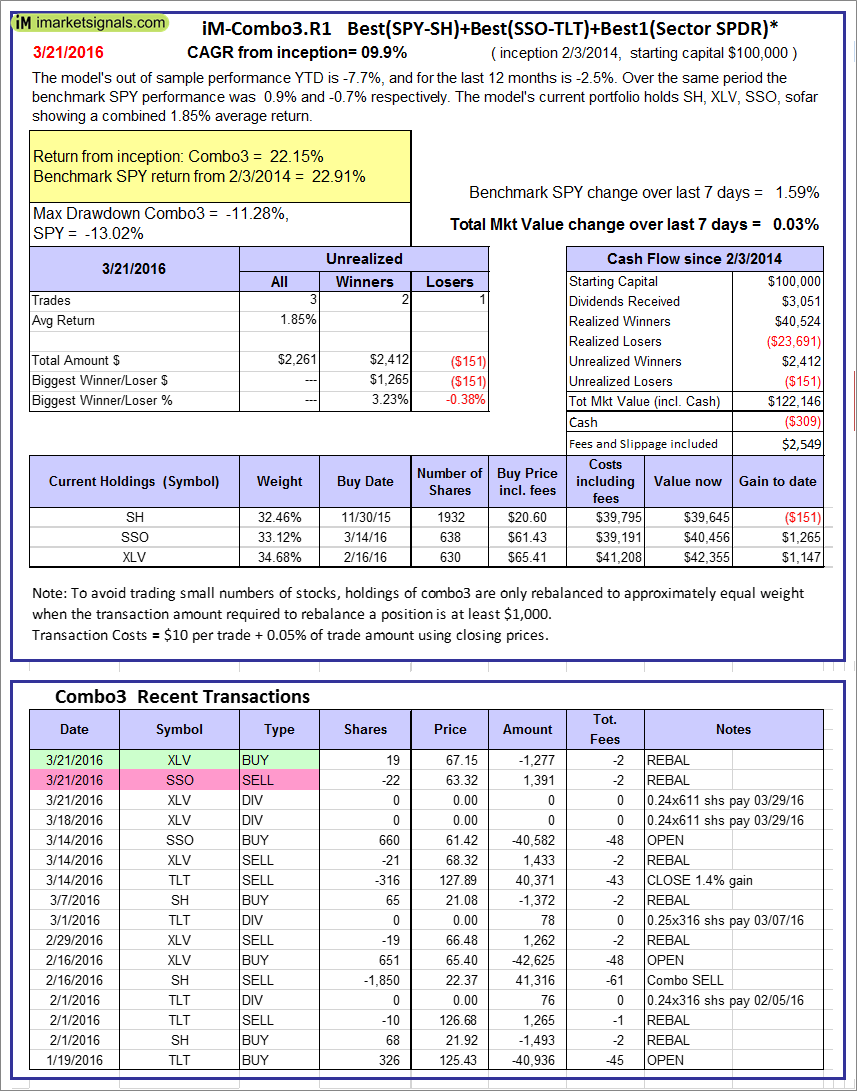 |
iM-Combo3.R1: The model’s out of sample performance YTD is -7.7%, and for the last 12 months is -2.5%. Over the same period the benchmark SPY performance was 0.9% and -0.7% respectively. Over the previous week the market value of iM-Combo-3 gained 0.03% at a time when SPY gained 1.59%[/iM]. A starting capital of $100,000 at inception on 2/3/2014 would have grown to $122,146 which includes -$309 cash and excludes $2,549 spent on fees and slippage. |
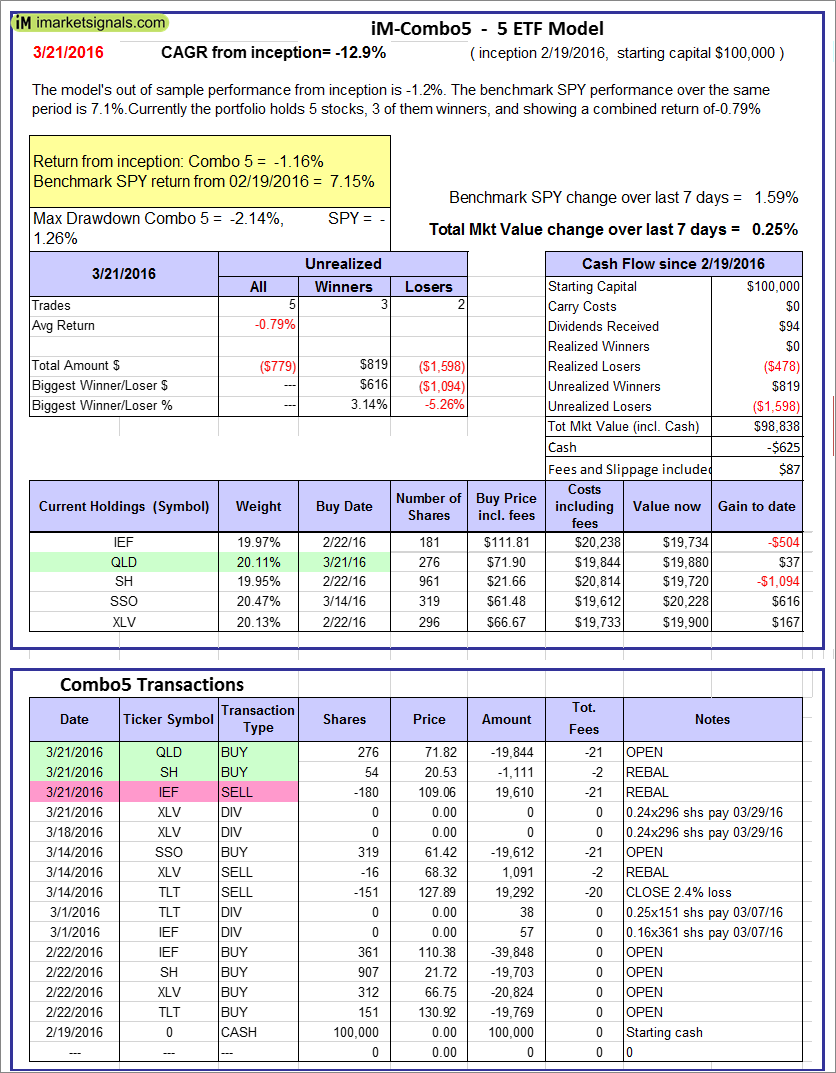 |
iM-Combo5: The model’s out of sample performance from inception is -1.2%. The benchmark SPY performance over the same period is 7.1%. Over the previous week the market value of iM-Combo-3 gained 0.25% at a time when SPY gained 1.59%. A starting capital of $100,000 at inception on 2/22/2016 would have grown to $98,838 which includes -$625 cash and excludes $87 spent on fees and slippage. |
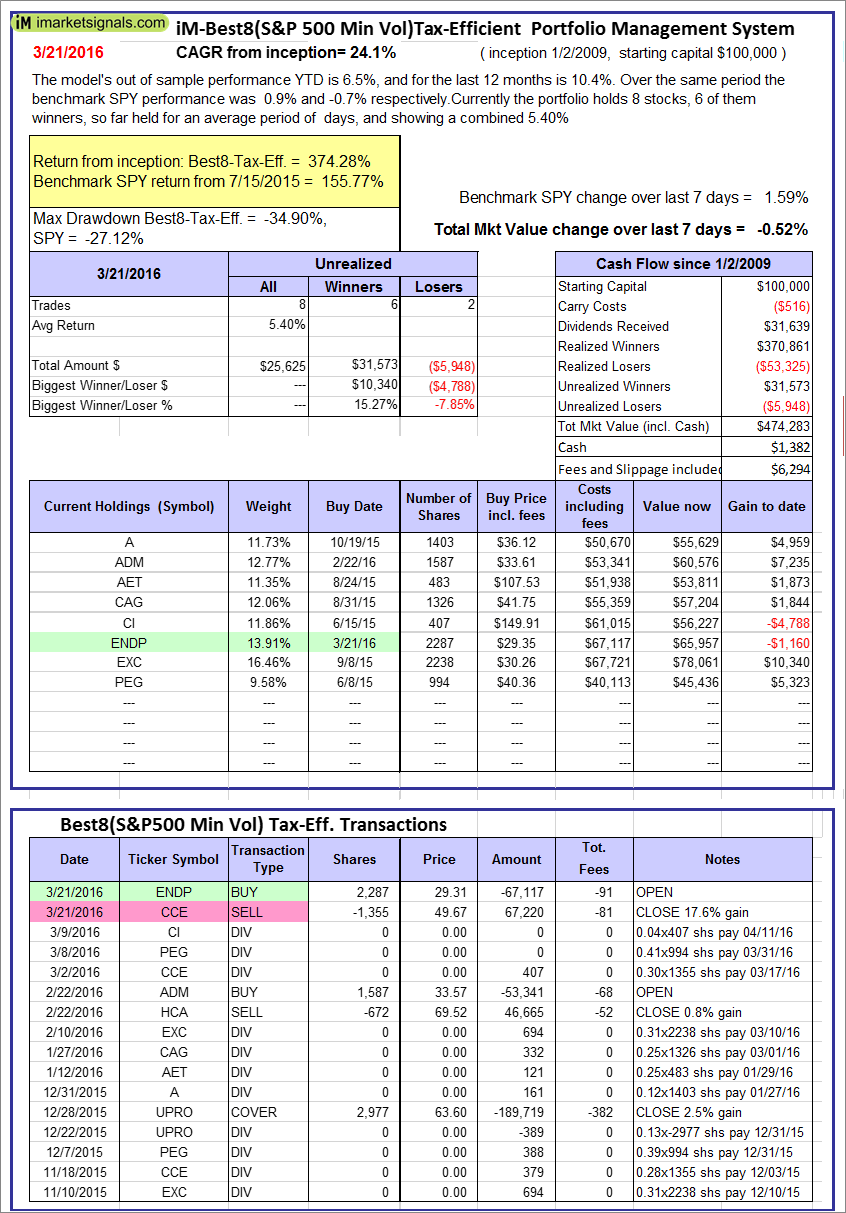 |
The iM-Best8(S&P500 Min Vol)Tax-Efficient The model’s out of sample performance YTD is 6.5%, and for the last 12 months is 10.4%. Over the same period the benchmark SPY performance was 0.9% and -0.7% respectively. Over the previous week the market value of iM-Best8(S&P 500)Tax-Eff. gained -0.52% at a time when SPY gained 1.59%. A starting capital of $100,000 at inception on 1/2/2009 would have grown to $474,283 which includes $1,382 cash and excludes $6,294 spent on fees and slippage. |
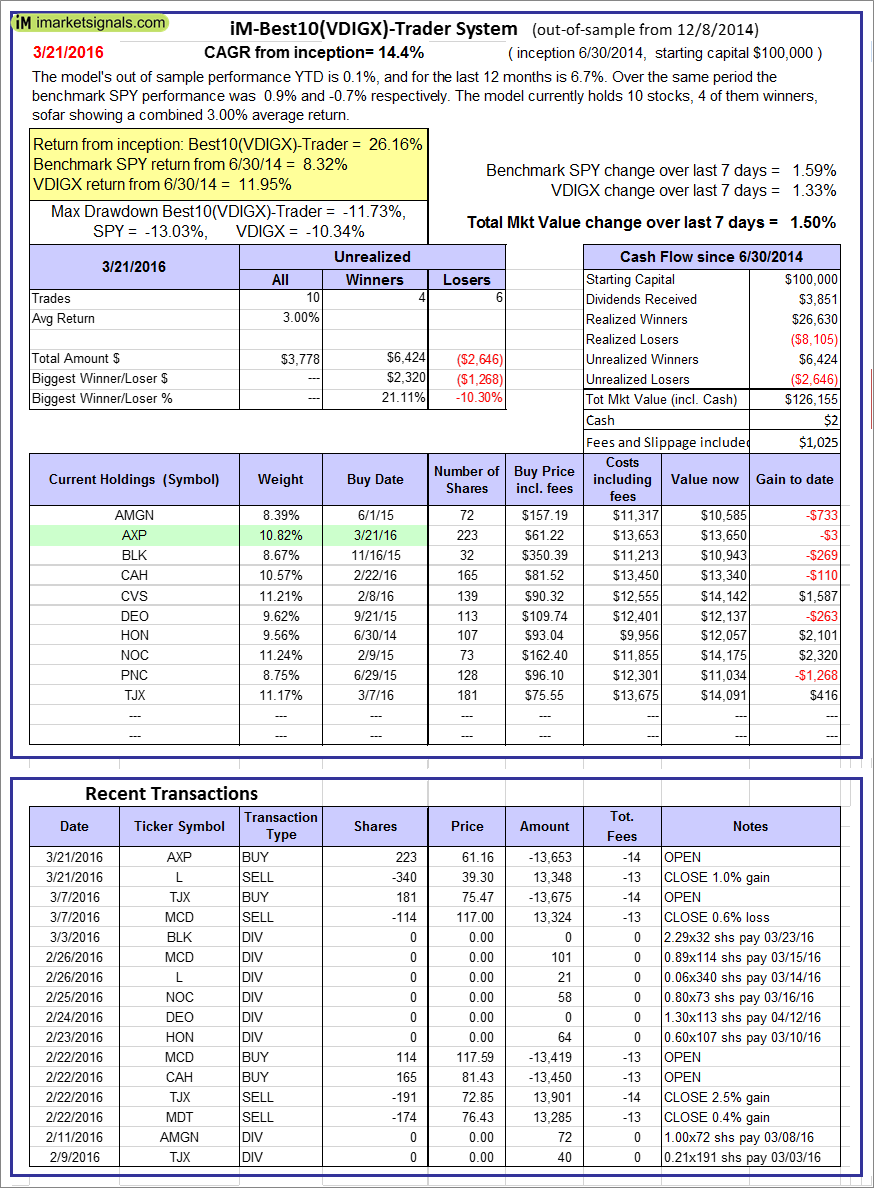 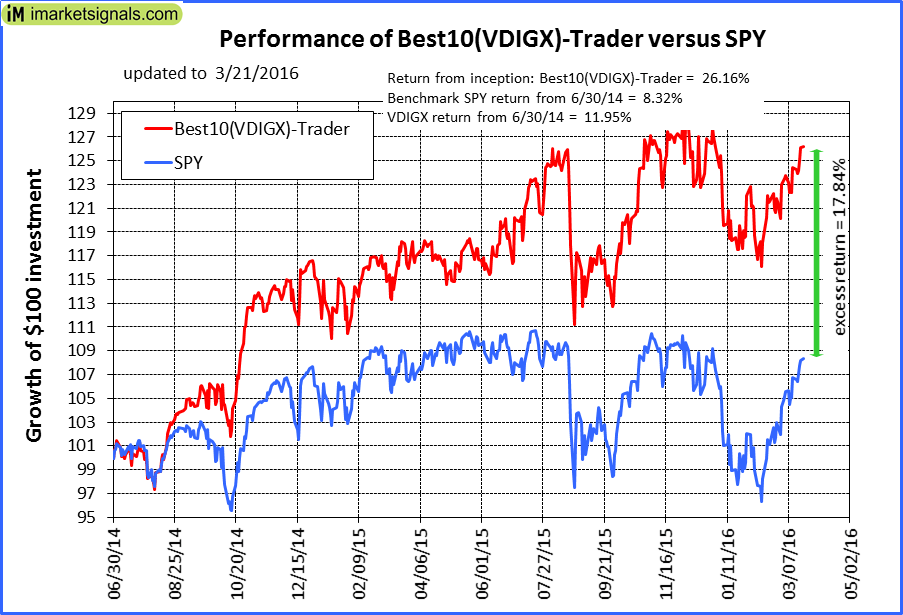 |
iM-Best10(VDIGX)-Trader: The model’s out of sample performance YTD is 0.1%, and for the last 12 months is 6.7%. Over the same period the benchmark SPY performance was 0.9% and -0.7% respectively. Since inception, on 7/1/2014, the model gained 26.16% while the benchmark SPY gained 8.32% and the ETF VDIGX gained 11.95% over the same period. Over the previous week the market value of iM-Best10(VDIGX) gained 1.50% at a time when SPY gained 1.59%. A starting capital of $100,000 at inception on 7/1/2014 would have grown to $126,155 which includes $2 cash and excludes $1,025 spent on fees and slippage. |
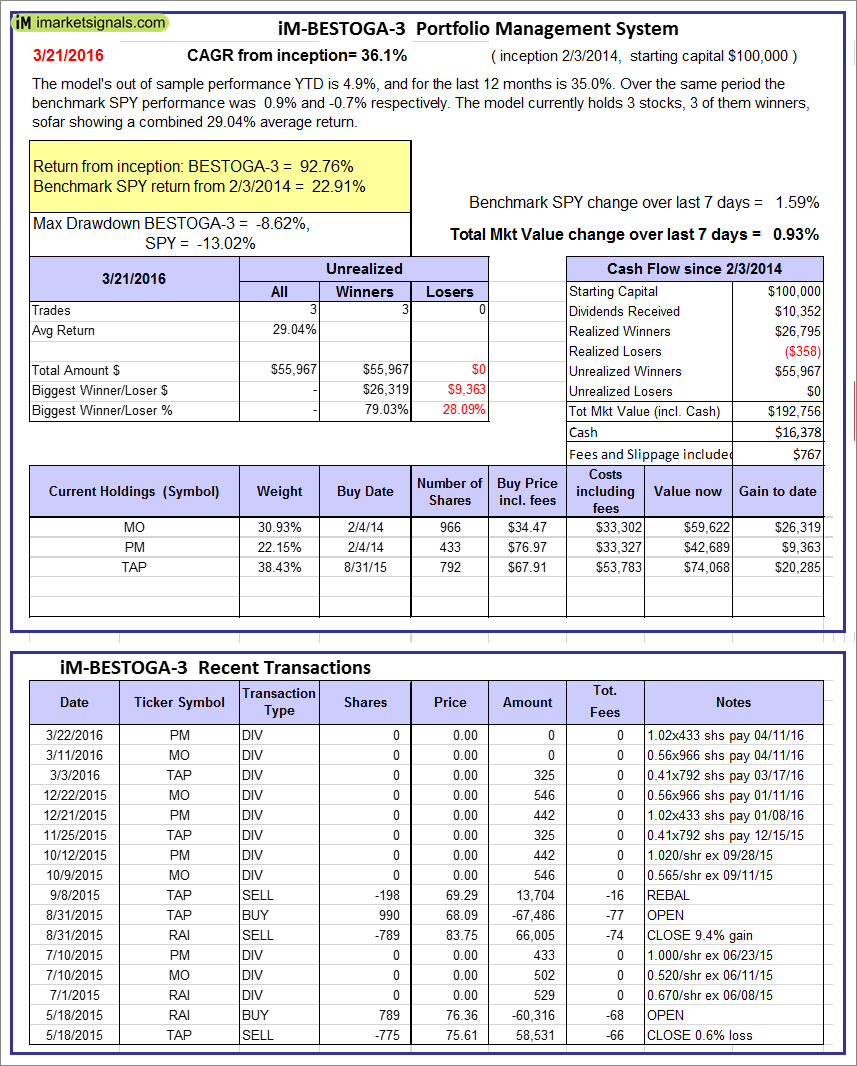 |
iM-BESTOGA-3: The model’s out of sample performance YTD is 4.9%, and for the last 12 months is 35.0%. Over the same period the benchmark SPY performance was 0.9% and -0.7% respectively. Over the previous week the market value of iM-BESTOGA-3 gained 0.93% at a time when SPY gained 1.59%. A starting capital of $100,000 at inception on 2/3/2014 would have grown to $192,756 which includes $16,378 cash and excludes $767 spent on fees and slippage. |
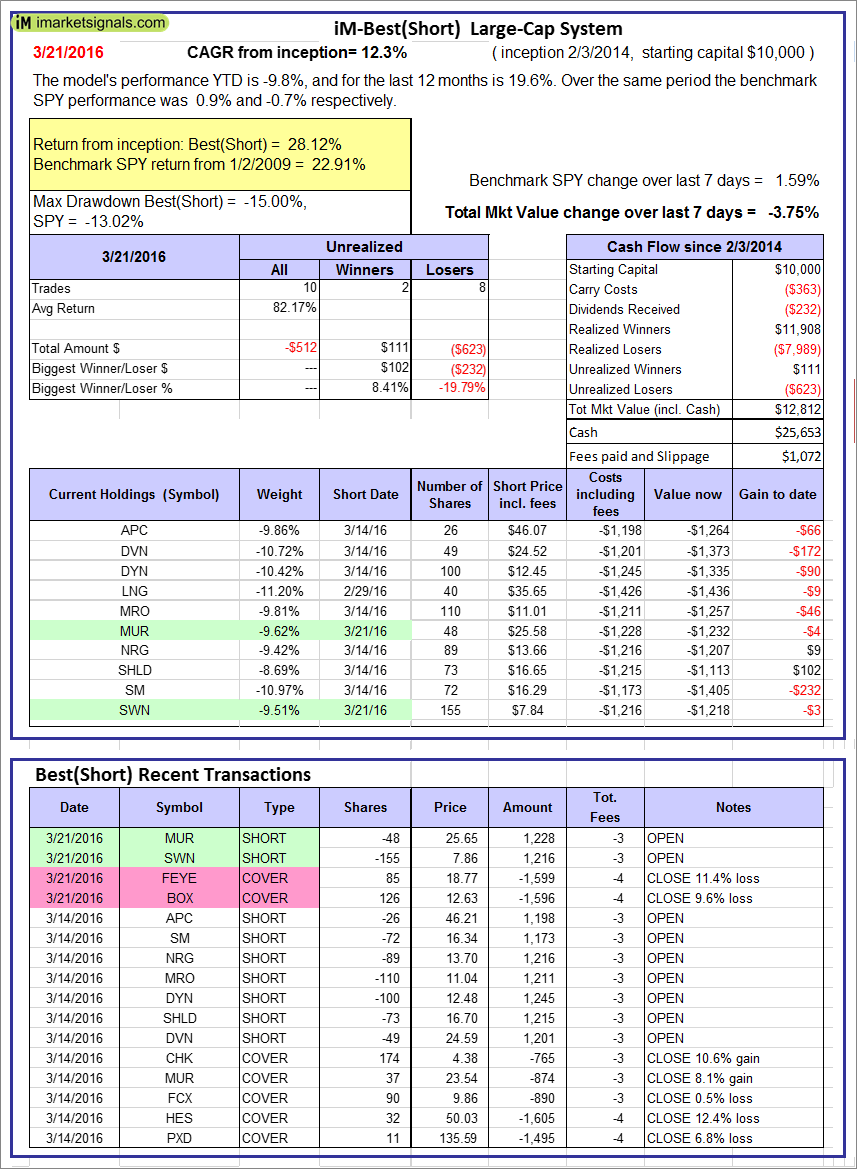 |
iM-Best10(Short Russell3000): The model’s performance YTD is -9.8%, and for the last 12 months is 19.6%. Over the same period the benchmark SPY performance was 0.9% and -0.7% respectively. Over the previous week the market value of iM-Best10(Short Russell3000) gained -3.75% at a time when SPY gained 1.59%. Over the period 2/3/2014 to 3/21/2016 the starting capital of $100,000 would have grown to $12,812 which includes $25,653 cash and excludes $1,072 spent on fees and slippage. |
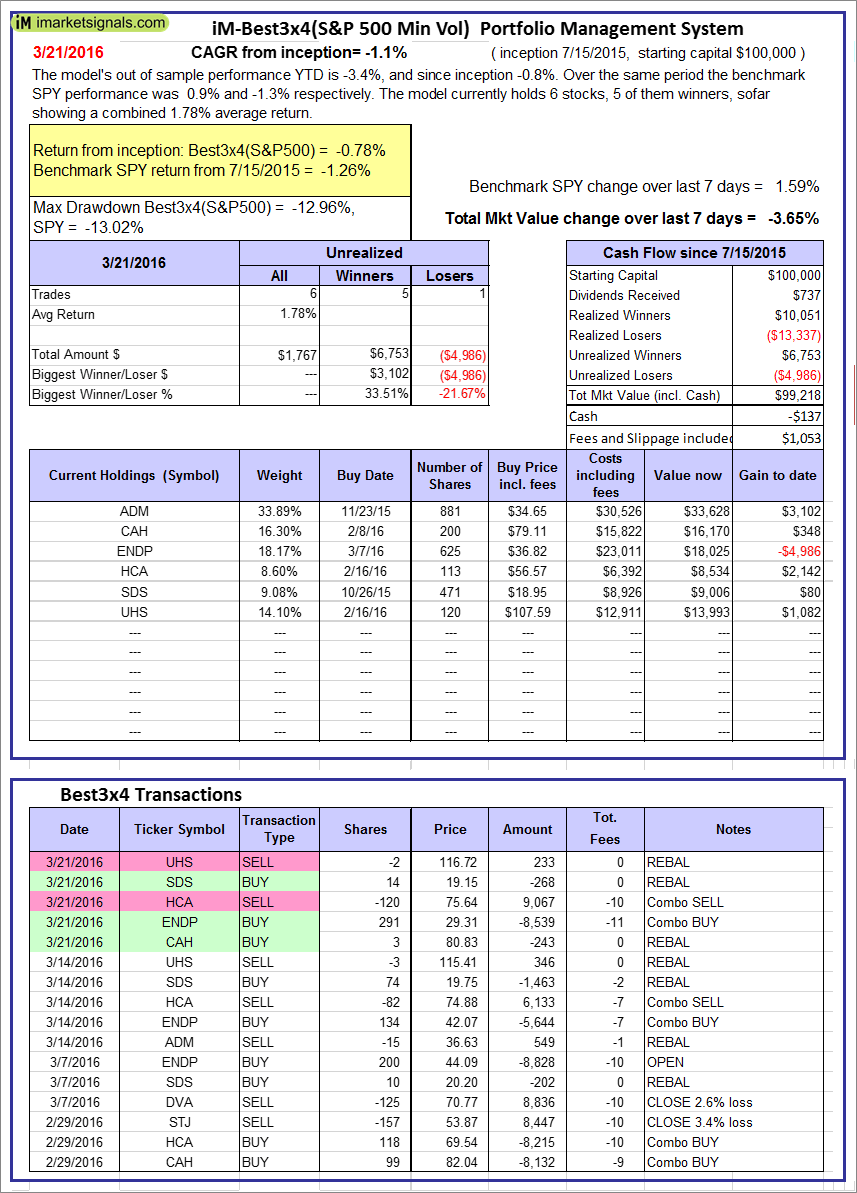 |
iM-Best3x4(S&P 500 Min Vol): The model’s out of sample performance YTD is -3.4%, and since inception -0.8%. Over the same period the benchmark SPY performance was 0.9% and -1.3% respectively. Over the previous week the market value of iM-Best3x4 gained -3.65% at a time when SPY gained 1.59%. A starting capital of $100,000 at inception on 7/15/2015 would have grown to $99,218 which includes -$137 cash and excludes $1,053 spent on fees and slippage. |
 |
iM-Best2x4(S&P 500 Min Vol): The model’s out of sample performance YTD is 0.4%, and since inception -0.8%. Over the same period the benchmark SPY performance was 0.9% and -1.2% respectively. Over the previous week the market value of iM-Best2x4 gained -1.28% at a time when SPY gained 1.59%. A starting capital of $100,000 at inception on 7/16/2015 would have grown to $99,171 which includes $1,589 cash and excludes $757 spent on fees and slippage. |
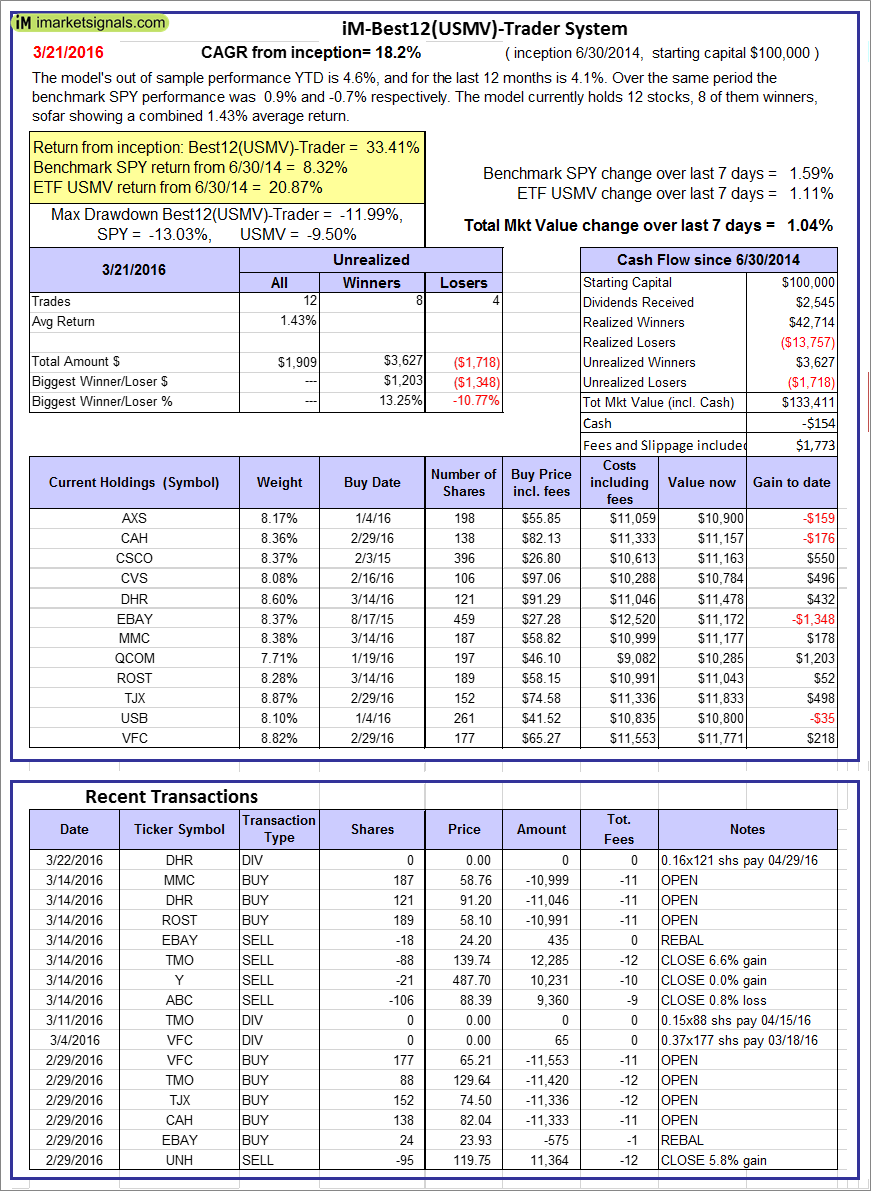 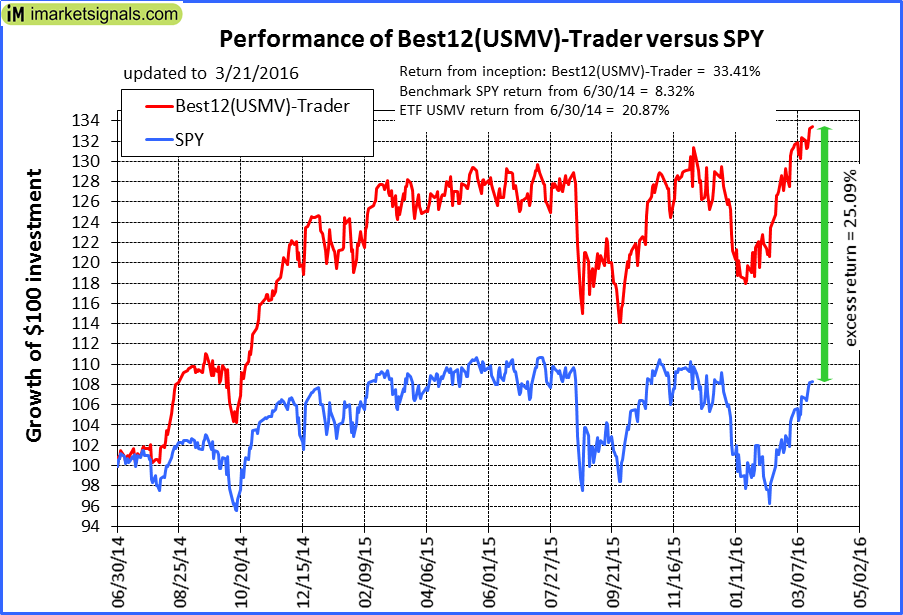 |
iM-Best12(USMV)-Trader: The model’s out of sample performance YTD is 4.6%, and for the last 12 months is 4.1%. Over the same period the benchmark SPY performance was 0.9% and -0.7% respectively. Since inception, on 7/1/2014, the model gained 33.41% while the benchmark SPY gained 8.32% and the ETF USMV gained 20.87% over the same period. Over the previous week the market value of iM-Best12(USMV)-Trader gained 1.04% at a time when SPY gained 1.59%. A starting capital of $100,000 at inception on 7/1/2014 would have grown to $133,411 which includes -$154 cash and excludes $1,773 spent on fees and slippage. |
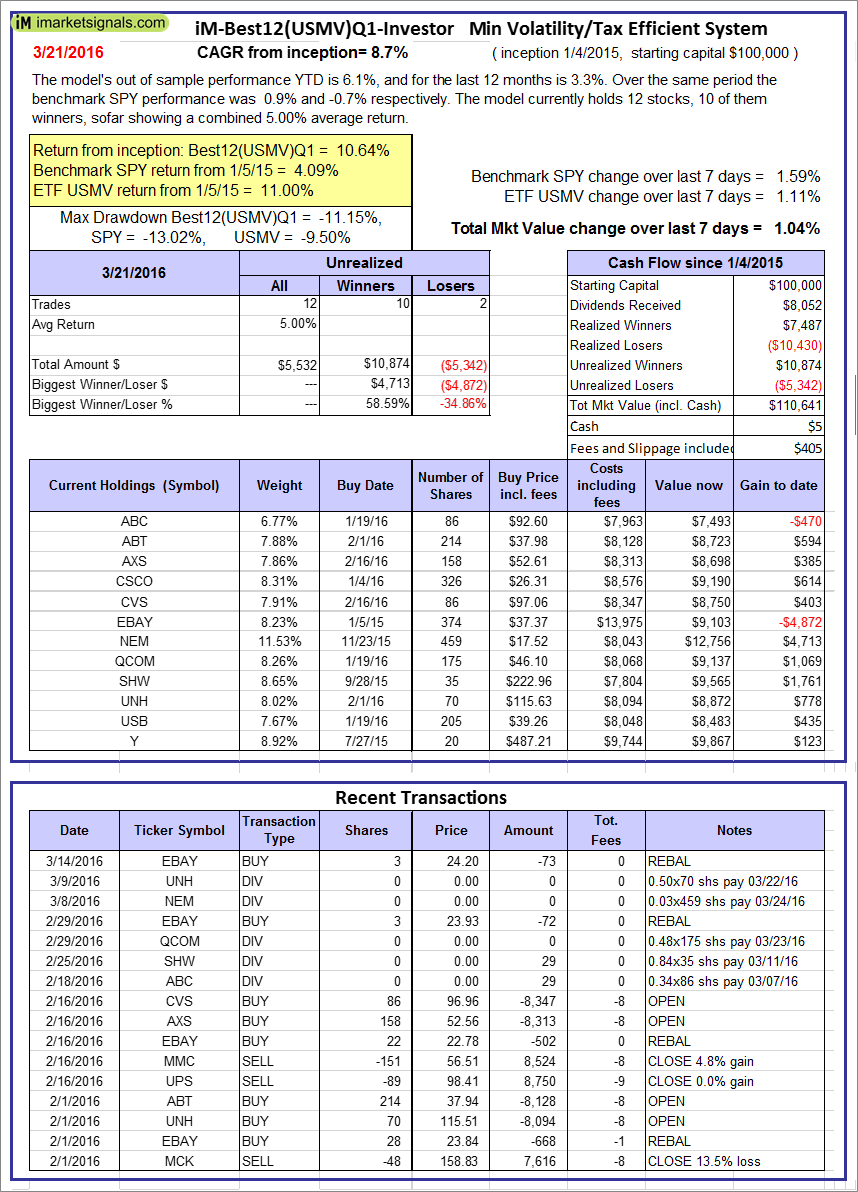 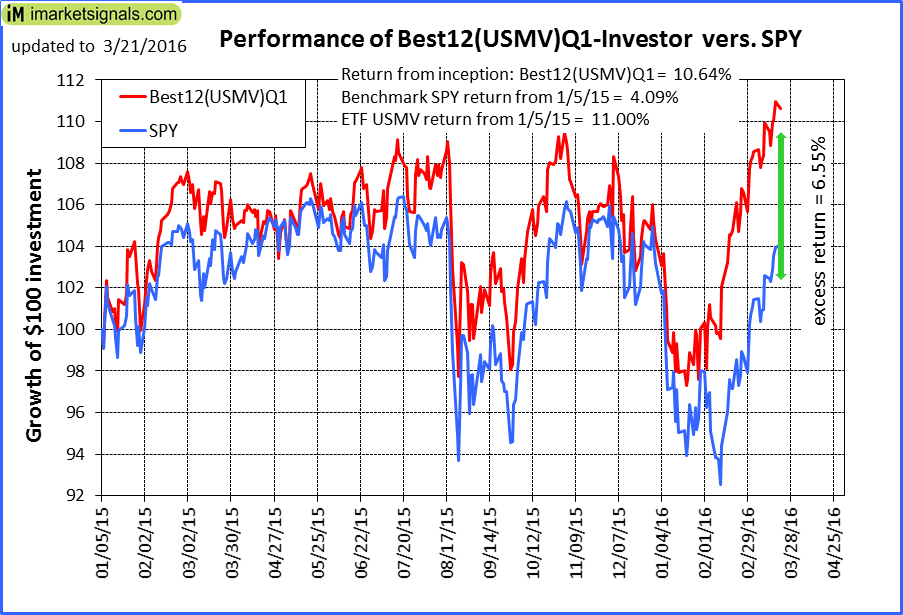 |
iM-Best12(USMV)Q1-Investor: The model’s out of sample performance YTD is 6.1%, and for the last 12 months is 3.3%. Over the same period the benchmark SPY performance was 0.9% and -0.7% respectively. Since inception, on 1/5/2015, the model gained 10.64% while the benchmark SPY gained 4.09% and the ETF USMV gained 11.00% over the same period. Over the previous week the market value of iM-Best12(USMV)Q1 gained 1.04% at a time when SPY gained 1.59%. A starting capital of $100,000 at inception on 1/5/2015 would have grown to $110,641 which includes $5 cash and excludes $405 spent on fees and slippage. |
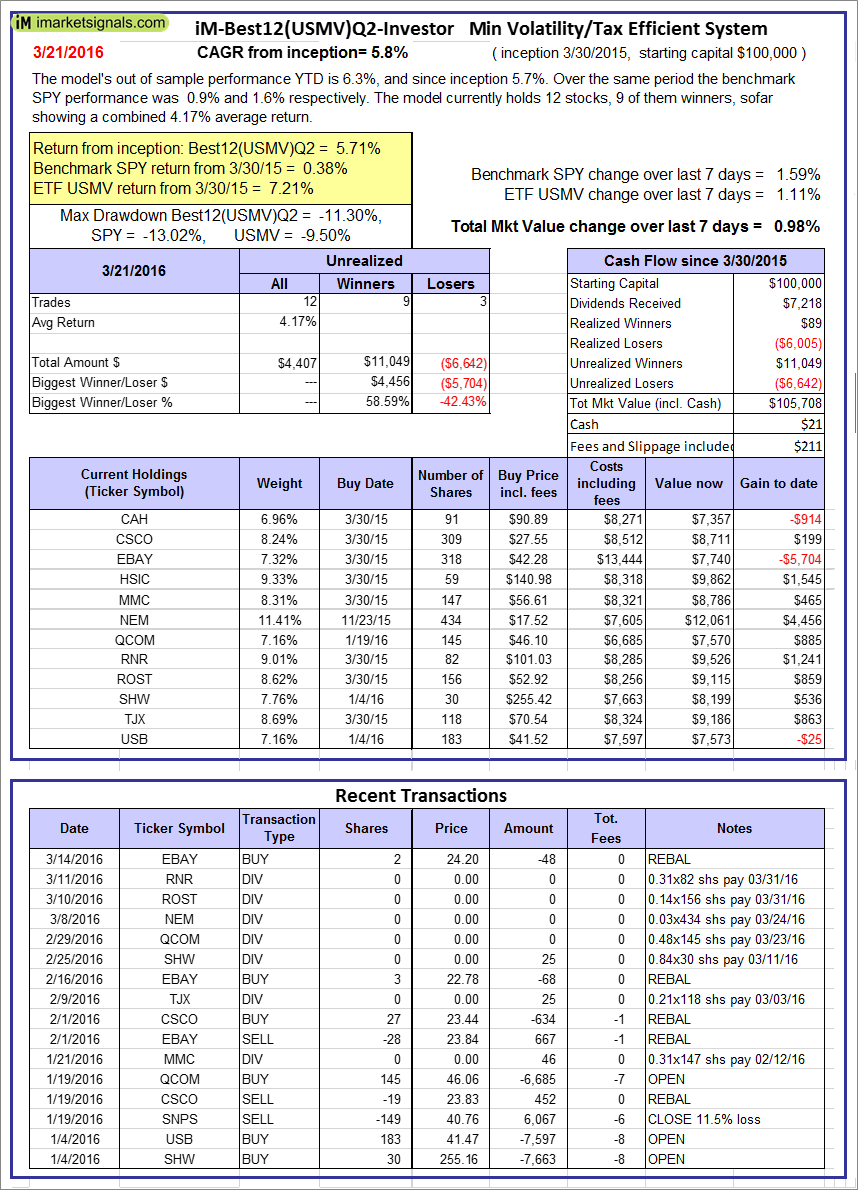  |
iM-Best12(USMV)Q2-Investor: The model’s out of sample performance YTD is 6.3%, and since inception 5.7%. Over the same period the benchmark SPY performance was 0.9% and 1.6% respectively. Since inception, on 3/31/2015, the model gained 5.71% while the benchmark SPY gained 0.38% and the ETF USMV gained 7.21% over the same period. Over the previous week the market value of iM-Best12(USMV)Q2 gained 0.98% at a time when SPY gained 1.59%. A starting capital of $100,000 at inception on 3/31/2015 would have grown to $105,708 which includes $21 cash and excludes $211 spent on fees and slippage. |
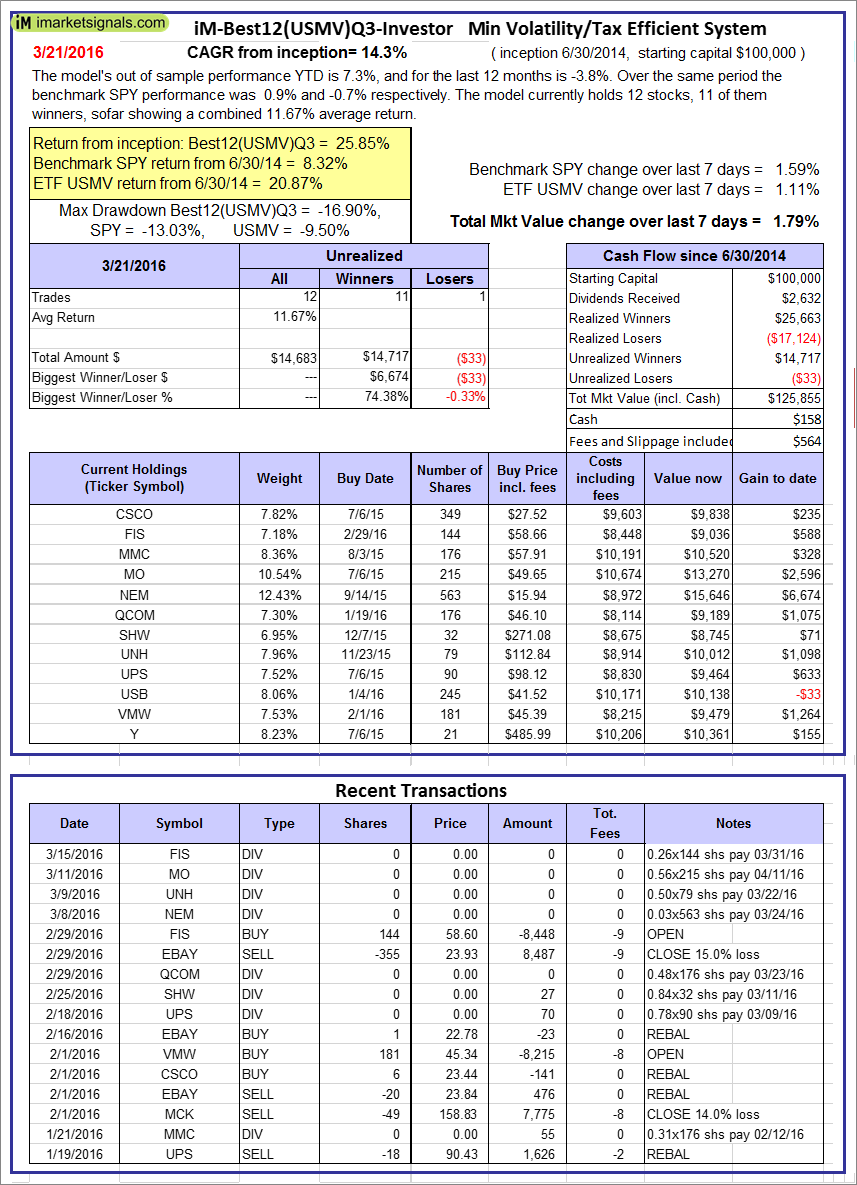  |
iM-Best12(USMV)Q3-Investor: The model’s out of sample performance YTD is 7.3%, and for the last 12 months is -3.8%. Over the same period the benchmark SPY performance was 0.9% and -0.7% respectively. Since inception, on 7/1/2014, the model gained 25.85% while the benchmark SPY gained 8.32% and the ETF USMV gained 20.87% over the same period. Over the previous week the market value of iM-Best12(USMV)Q3 gained 1.79% at a time when SPY gained 1.59%. A starting capital of $100,000 at inception on 7/1/2014 would have grown to $125,855 which includes $158 cash and excludes $564 spent on fees and slippage. |
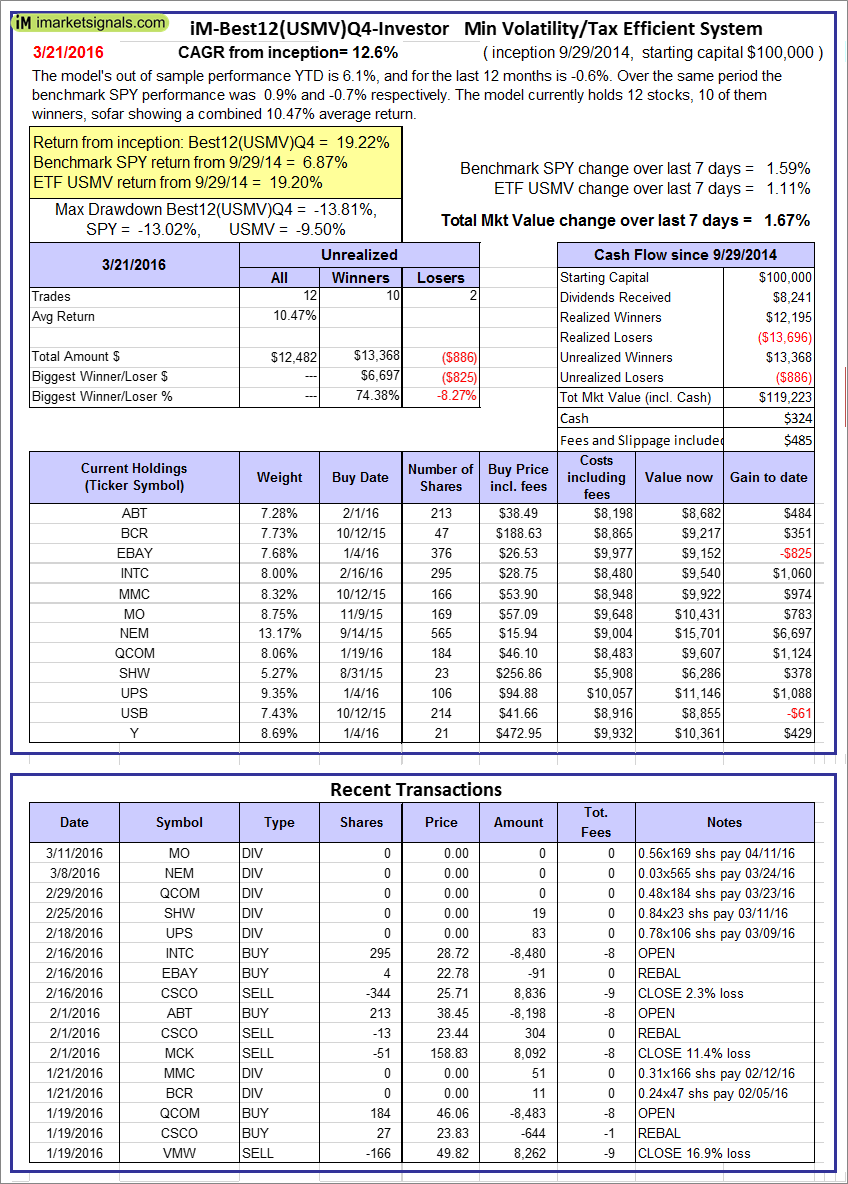 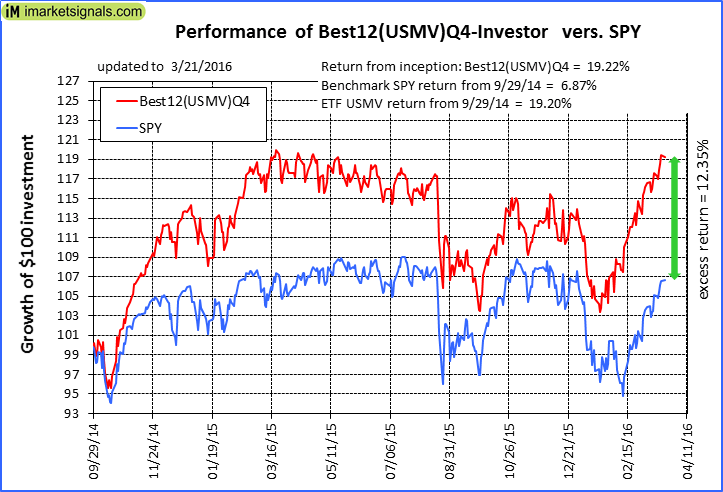 |
iM-Best12(USMV)Q4-Investor: Since inception, on 9/30/2014, the model gained 19.22% while the benchmark SPY gained 6.87% and the ETF USMV gained 19.20% over the same period. Over the previous week the market value of iM-Best12(USMV)Q4 gained 1.67% at a time when SPY gained 1.59%. A starting capital of $100,000 at inception on 9/30/2014 would have grown to $119,223 which includes $324 cash and excludes $485 spent on fees and slippage. |
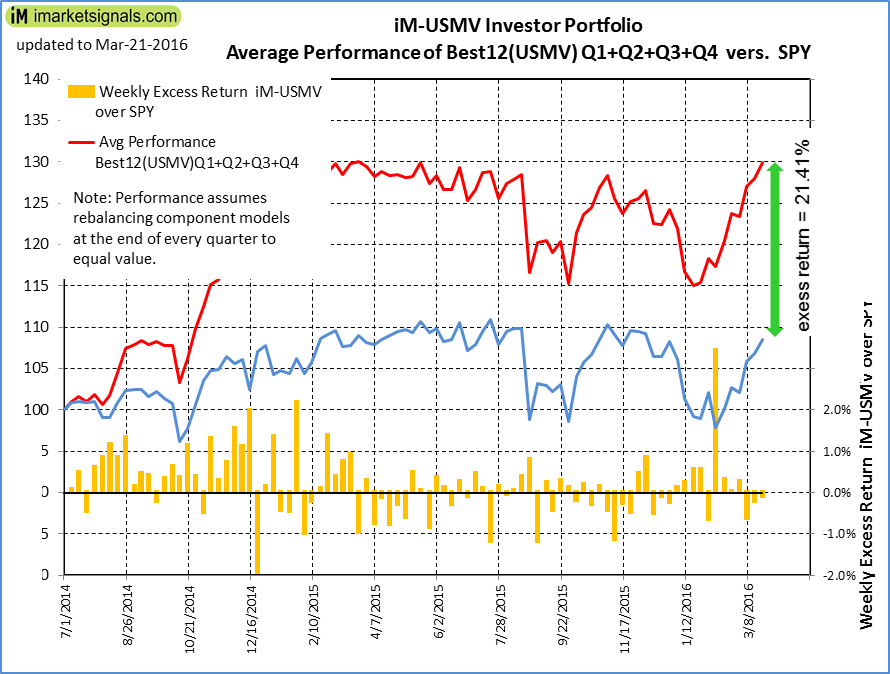 |
Average Performance of iM-Best12(USMV)Q1+Q2+Q3+Q4-Investor resulted in an excess return of 21.41% over SPY. (see iM-USMV Investor Portfolio) |
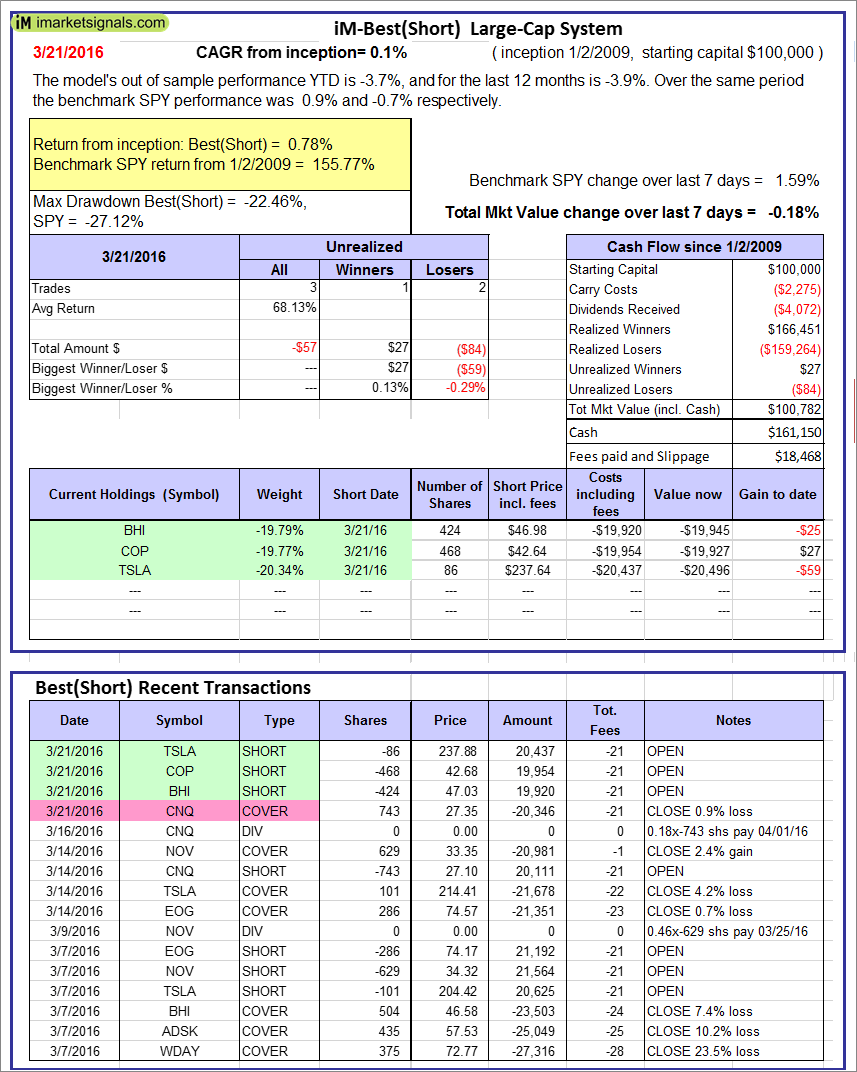 |
iM-Best(Short): The model’s out of sample performance YTD is -3.7%, and for the last 12 months is -3.9%. Over the same period the benchmark SPY performance was 0.9% and -0.7% respectively. Over the previous week the market value of iM-Best(Short) gained -0.18% at a time when SPY gained 1.59%. Over the period 1/2/2009 to 3/21/2016 the starting capital of $100,000 would have grown to $100,782 which includes $161,150 cash and excludes $18,468 spent on fees and slippage. |
Posted in pmp SPY-SH
With reference to Section 202(a)(11)(D) of the Investment Advisers Act:
We are Engineers and not Investment Advisers,
read more ...
By the mere act of reading this page and navigating this site you acknowledge, agree to, and abide by the
Terms of Use / Disclaimer