
  |
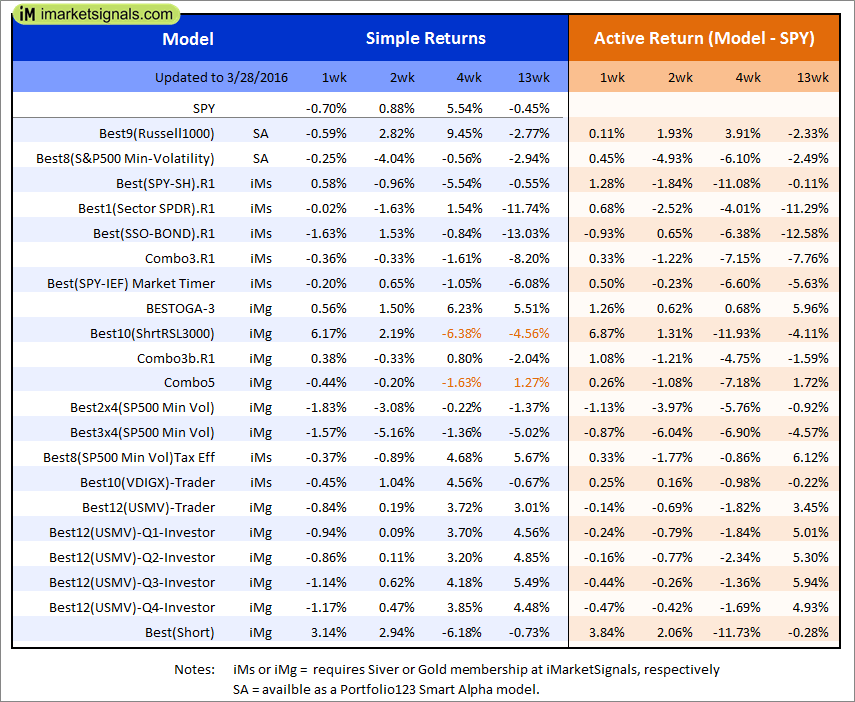
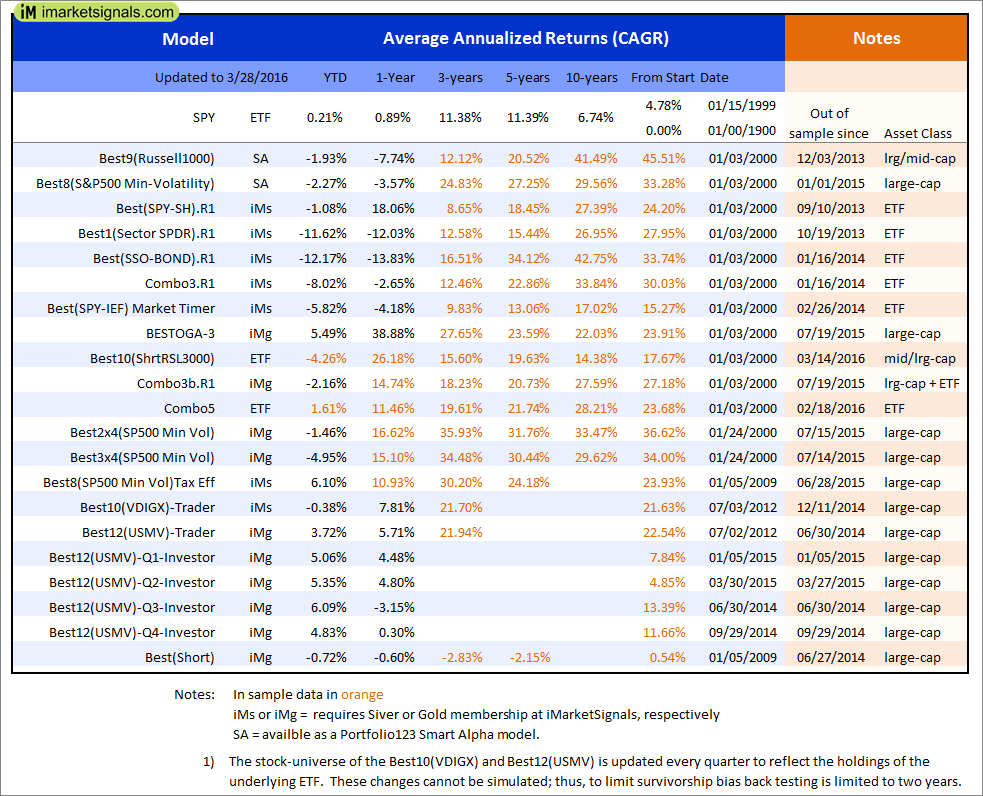
Out of sample performance summary of our models for the past 1, 2, 4 and 13 week periods. The active active return indicates how the models over- or underperformed the benchmark ETF SPY. Also the YTD, and the 1-, 3-, 5- and 10-year annualized returns are shown in the second table |
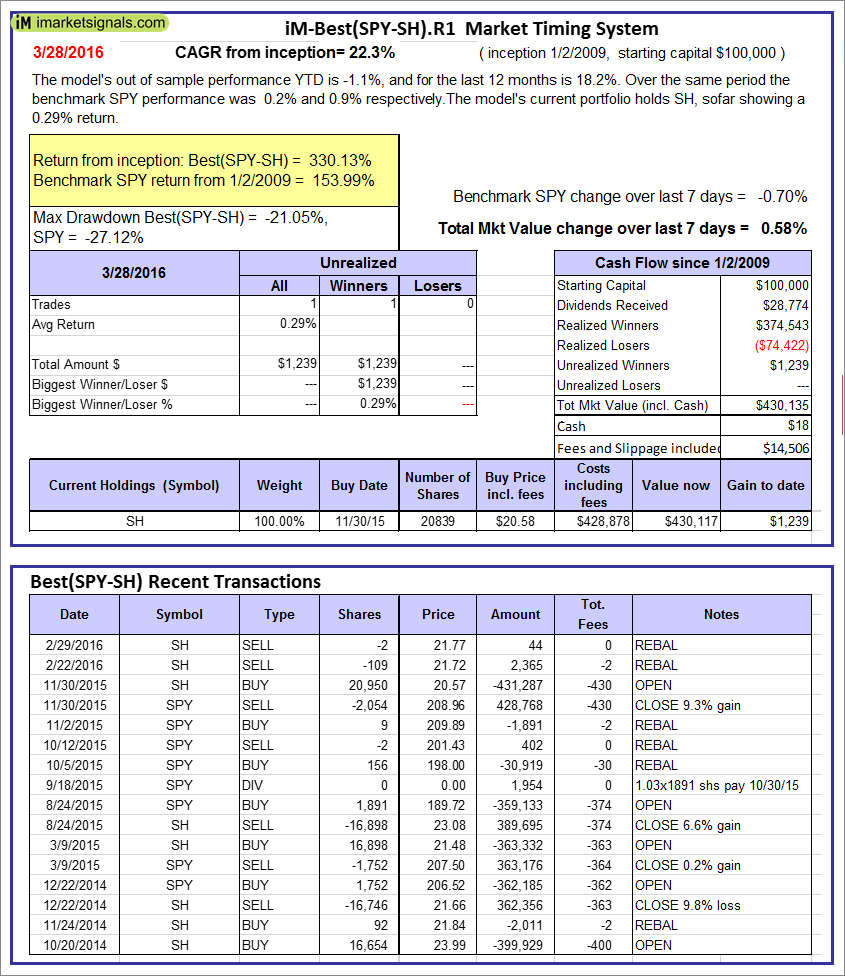 |
iM-Best(SPY-SH).R1: The model’s out of sample performance YTD is -1.1%, and for the last 12 months is 18.2%. Over the same period the benchmark SPY performance was 0.2% and 0.9% respectively. Over the previous week the market value of Best(SPY-SH) gained 0.58% at a time when SPY gained -0.70%. A starting capital of $100,000 at inception on 1/2/2009 would have grown to $430,135 which includes $18 cash and excludes $14,506 spent on fees and slippage. |
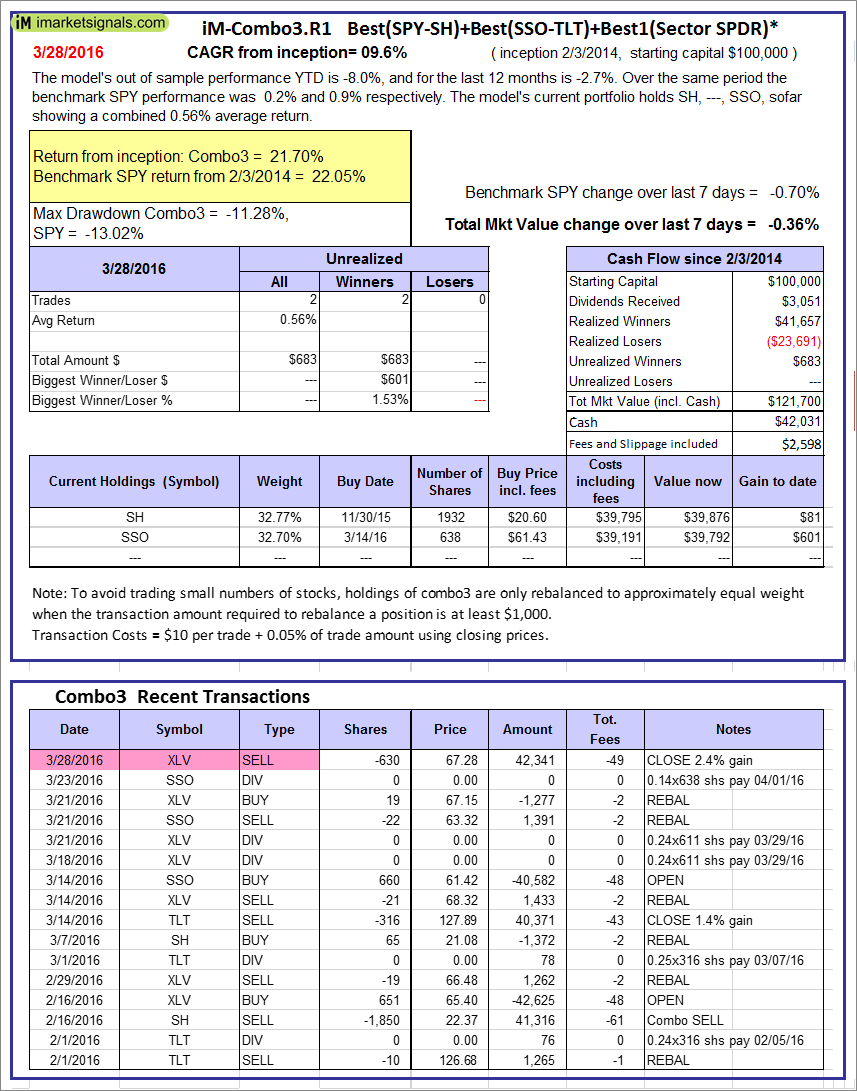 |
iM-Combo3.R1: The model’s out of sample performance YTD is -8.0%, and for the last 12 months is -2.7%. Over the same period the benchmark SPY performance was 0.2% and 0.9% respectively. Over the previous week the market value of iM-Combo3.R1 gained -0.36% at a time when SPY gained -0.70%. A starting capital of $100,000 at inception on 2/3/2014 would have grown to $121,700 which includes $42,031 cash and excludes $2,598 spent on fees and slippage. |
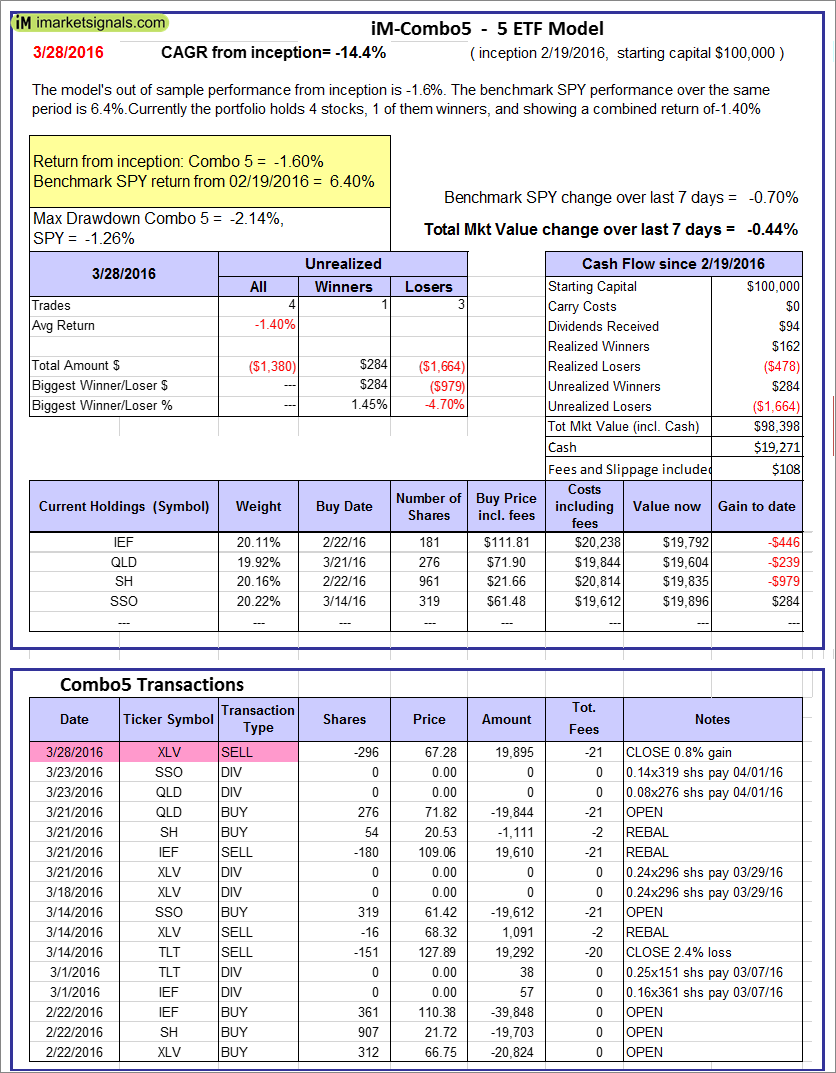 |
iM-Combo5: The model’s out of sample performance from inception is -1.6%. The benchmark SPY performance over the same period is 6.4%. Over the previous week the market value of iM-Combo5 gained -0.44% at a time when SPY gained -0.70%. A starting capital of $100,000 at inception on 2/22/2016 would have grown to $98,398 which includes $19,271 cash and excludes $108 spent on fees and slippage. |
 |
The iM-Best8(S&P500 Min Vol)Tax-Efficient The model’s out of sample performance YTD is 6.1%, and for the last 12 months is 10.9%. Over the same period the benchmark SPY performance was 0.2% and 0.9% respectively. Over the previous week the market value of iM-Best8(S&P 500)Tax-Eff. gained -0.37% at a time when SPY gained -0.70%. A starting capital of $100,000 at inception on 1/2/2009 would have grown to $472,528 which includes $1,382 cash and excludes $6,294 spent on fees and slippage. |
 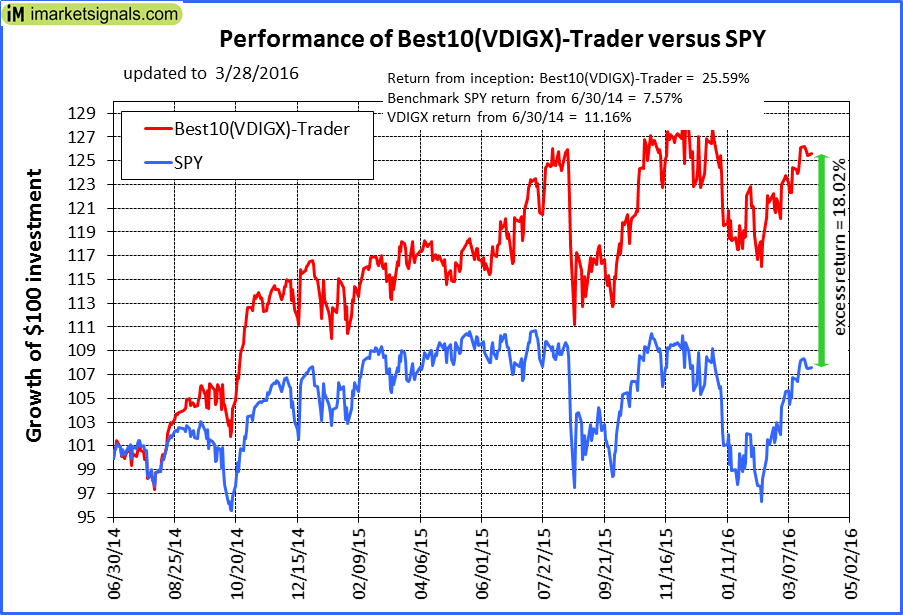 |
iM-Best10(VDIGX)-Trader: The model’s out of sample performance YTD is -0.4%, and for the last 12 months is 7.8%. Over the same period the benchmark SPY performance was 0.2% and 0.9% respectively. Since inception, on 7/1/2014, the model gained 25.59% while the benchmark SPY gained 7.57% and the ETF VDIGX gained 11.16% over the same period. Over the previous week the market value of iM-Best10(VDIGX) gained -0.45% at a time when SPY gained -0.70%. A starting capital of $100,000 at inception on 7/1/2014 would have grown to $125,587 which includes $75 cash and excludes $1,025 spent on fees and slippage. |
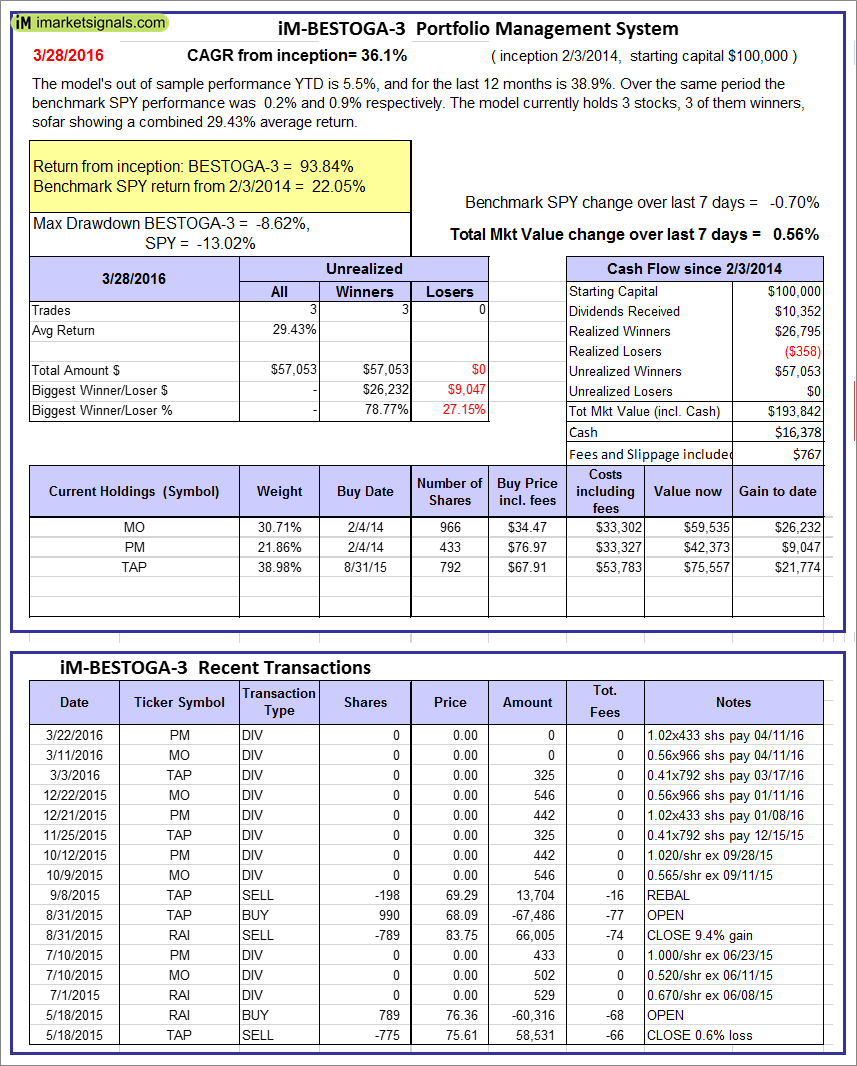 |
iM-BESTOGA-3: The model’s out of sample performance YTD is 5.5%, and for the last 12 months is 38.9%. Over the same period the benchmark SPY performance was 0.2% and 0.9% respectively. Over the previous week the market value of iM-BESTOGA-3 gained 0.56% at a time when SPY gained -0.70%. A starting capital of $100,000 at inception on 2/3/2014 would have grown to $193,842 which includes $16,378 cash and excludes $767 spent on fees and slippage. |
 |
iM-Best10(Short Russell3000): The model’s performance YTD is -4.3%, and for the last 12 months is 26.2%. Over the same period the benchmark SPY performance was 0.2% and 0.9% respectively. Over the previous week the market value of iM-Best10(Short Russell3000) gained 6.17% at a time when SPY gained -0.70%. Over the period 2/3/2014 to 3/28/2016 the starting capital of $100,000 would have grown to $13,603 which includes $25,653 cash and excludes $1,072 spent on fees and slippage. |
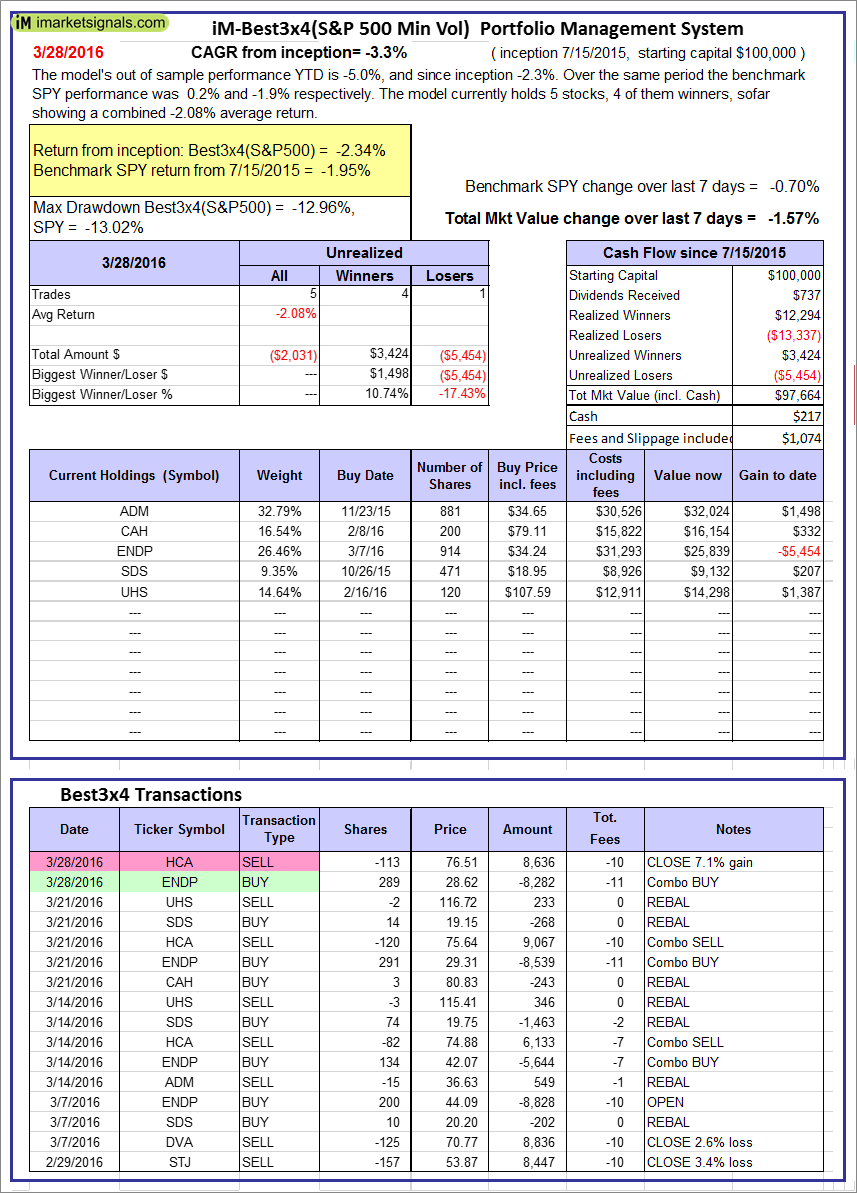 |
iM-Best3x4(S&P 500 Min Vol): The model’s out of sample performance YTD is -5.0%, and since inception -2.3%. Over the same period the benchmark SPY performance was 0.2% and -1.9% respectively. Over the previous week the market value of iM-Best3x4 gained -1.57% at a time when SPY gained -0.70%. A starting capital of $100,000 at inception on 7/15/2015 would have grown to $97,664 which includes $217 cash and excludes $1,074 spent on fees and slippage. |
 |
iM-Best2x4(S&P 500 Min Vol): The model’s out of sample performance YTD is -1.5%, and since inception -2.6%. Over the same period the benchmark SPY performance was 0.2% and -1.9% respectively. Over the previous week the market value of iM-Best2x4 gained -1.83% at a time when SPY gained -0.70%. A starting capital of $100,000 at inception on 7/16/2015 would have grown to $97,360 which includes $1,589 cash and excludes $757 spent on fees and slippage. |
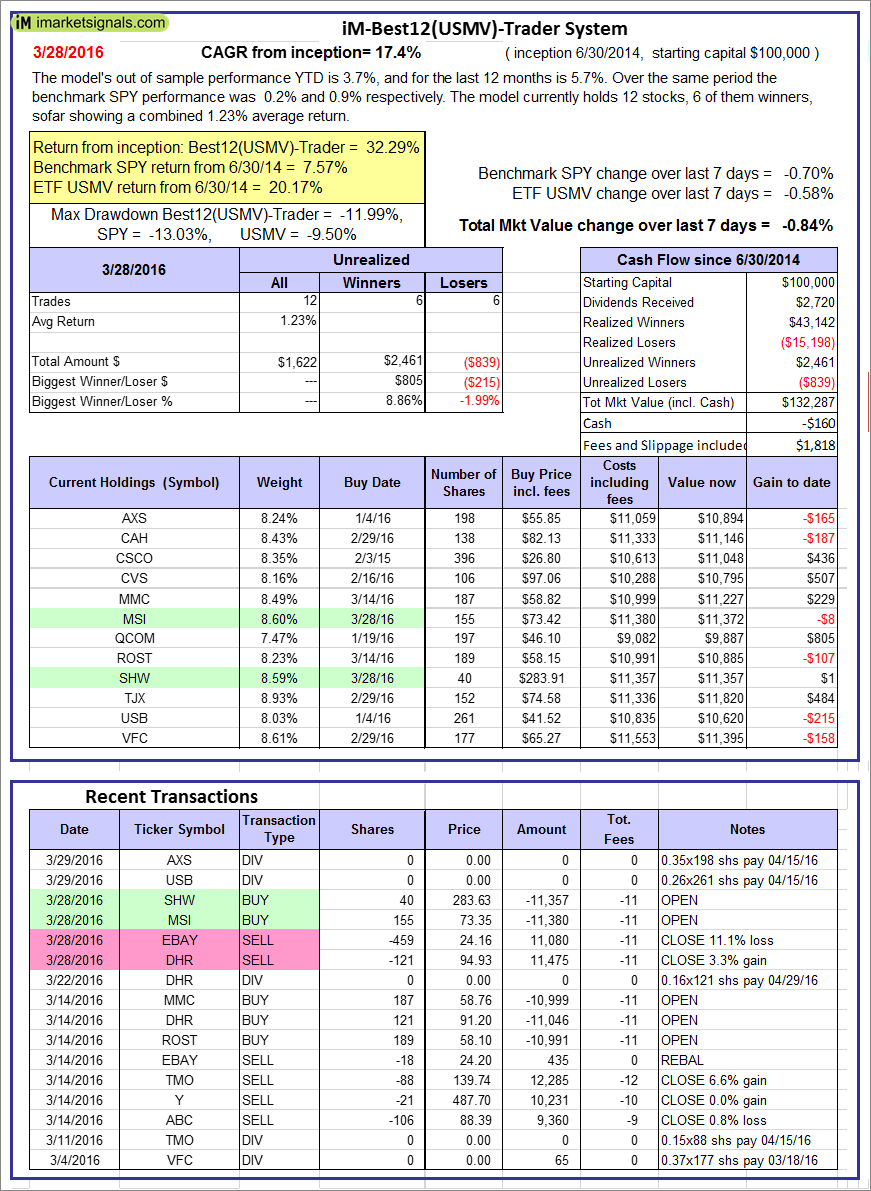 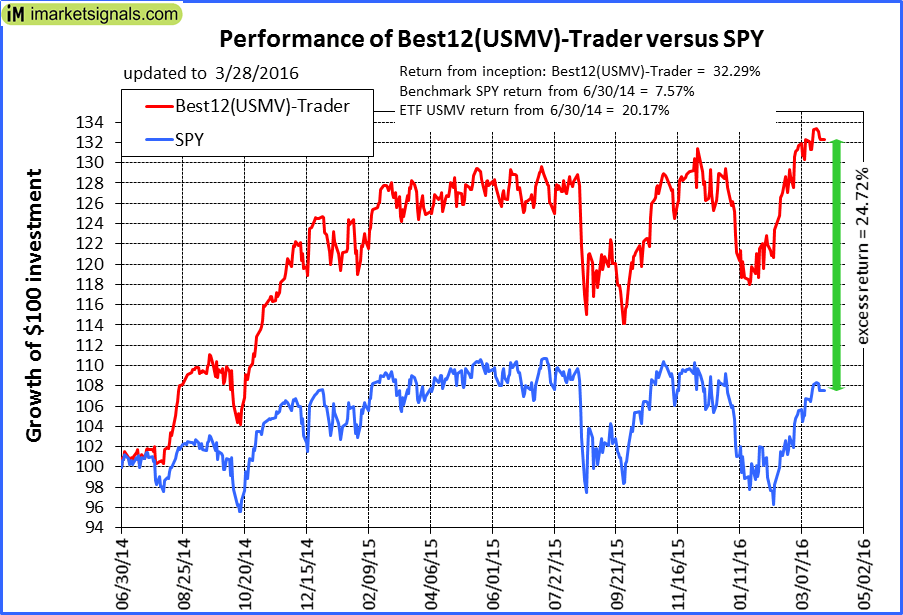 |
iM-Best12(USMV)-Trader: The model’s out of sample performance YTD is 3.7%, and for the last 12 months is 5.7%. Over the same period the benchmark SPY performance was 0.2% and 0.9% respectively. Since inception, on 7/1/2014, the model gained 32.29% while the benchmark SPY gained 7.57% and the ETF USMV gained 20.17% over the same period. Over the previous week the market value of iM-Best12(USMV)-Trader gained -0.84% at a time when SPY gained -0.70%. A starting capital of $100,000 at inception on 7/1/2014 would have grown to $132,287 which includes -$160 cash and excludes $1,818 spent on fees and slippage. |
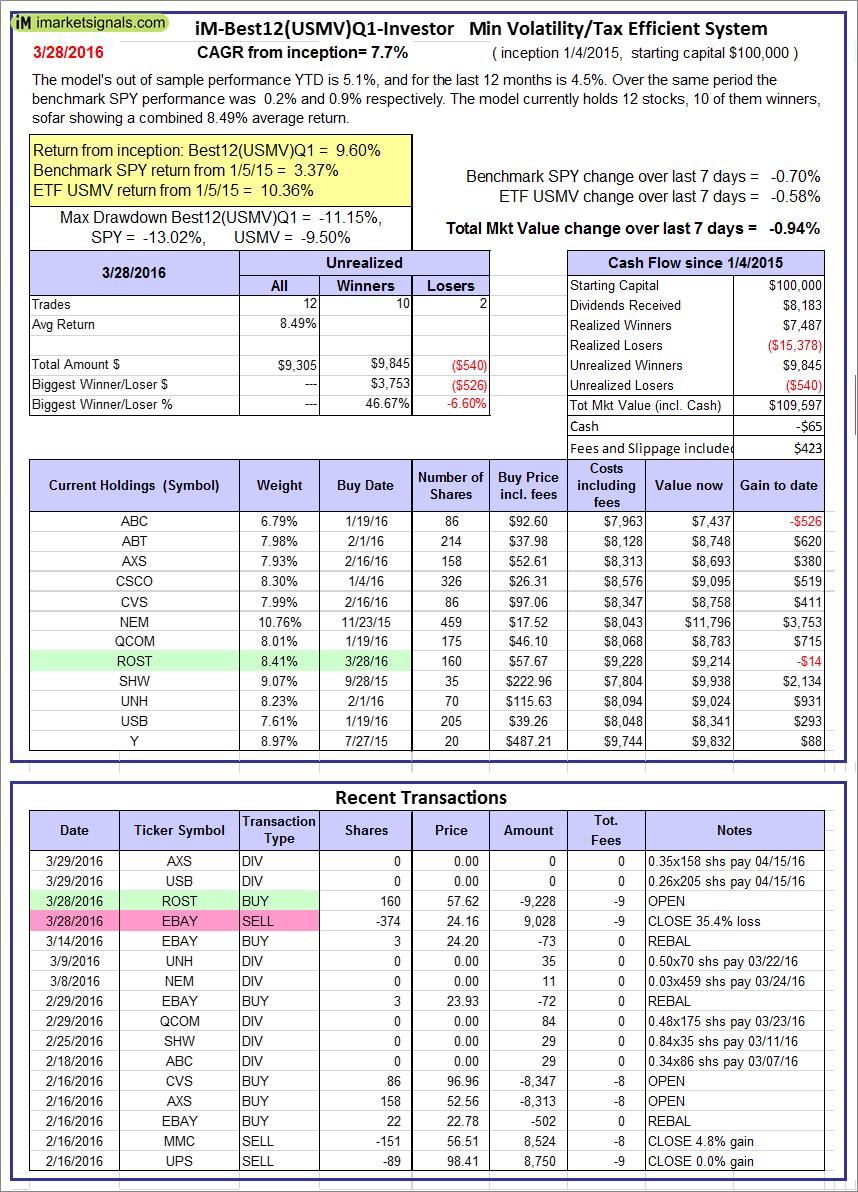 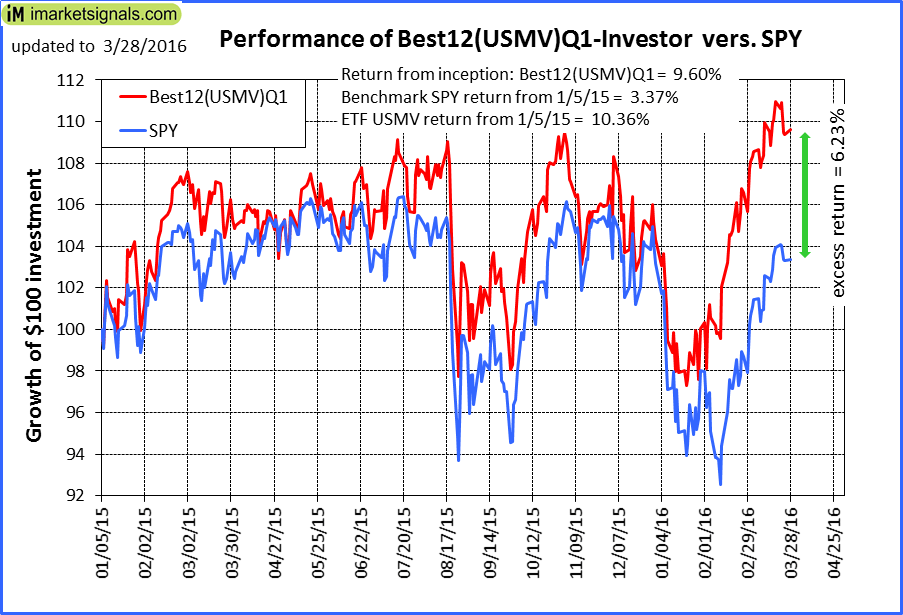 |
iM-Best12(USMV)Q1-Investor: The model’s out of sample performance YTD is 5.1%, and for the last 12 months is 4.5%. Over the same period the benchmark SPY performance was 0.2% and 0.9% respectively. Since inception, on 1/5/2015, the model gained 9.60% while the benchmark SPY gained 3.37% and the ETF USMV gained 10.36% over the same period. Over the previous week the market value of iM-Best12(USMV)Q1 gained -0.94% at a time when SPY gained -0.70%. A starting capital of $100,000 at inception on 1/5/2015 would have grown to $109,597 which includes -$65 cash and excludes $423 spent on fees and slippage. |
 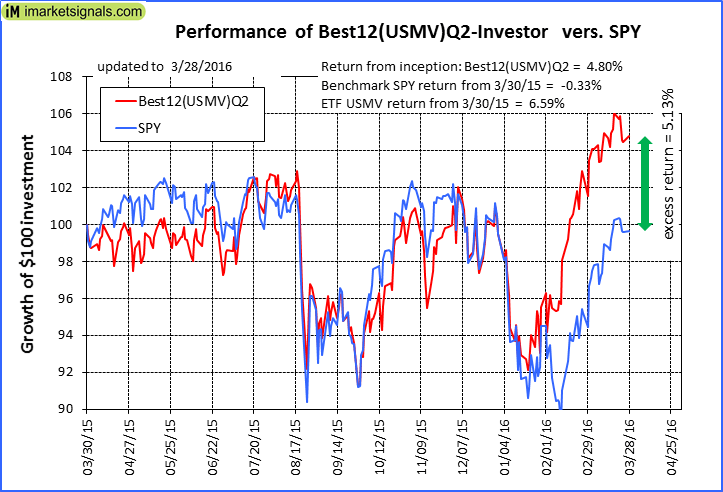 |
iM-Best12(USMV)Q2-Investor: The model’s out of sample performance YTD is 5.3%, and for the last 12 months is 4.8%. Over the same period the benchmark SPY performance was 0.2% and 0.9% respectively. Since inception, on 3/31/2015, the model gained 4.80% while the benchmark SPY gained -0.33% and the ETF USMV gained 6.59% over the same period. Over the previous week the market value of iM-Best12(USMV)Q2 gained -0.86% at a time when SPY gained -0.70%. A starting capital of $100,000 at inception on 3/31/2015 would have grown to $104,798 which includes -$78 cash and excludes $227 spent on fees and slippage. |
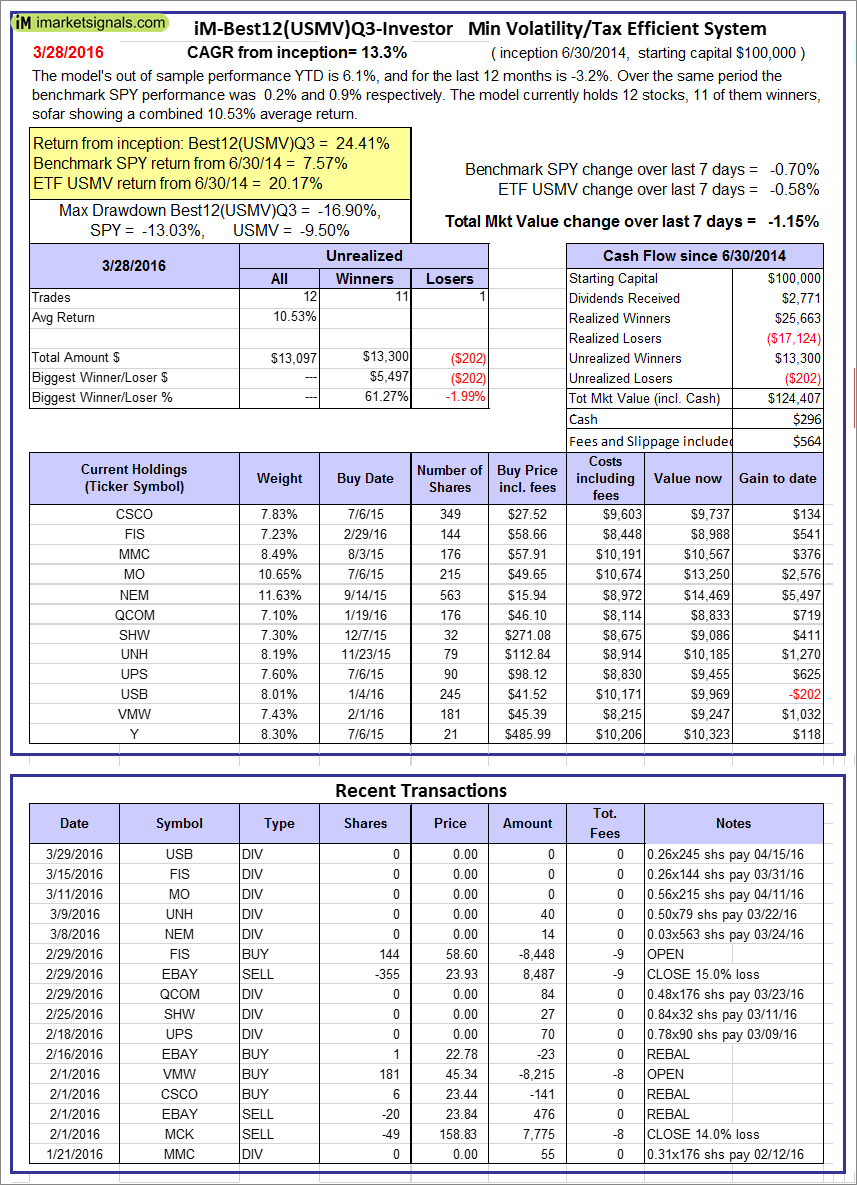 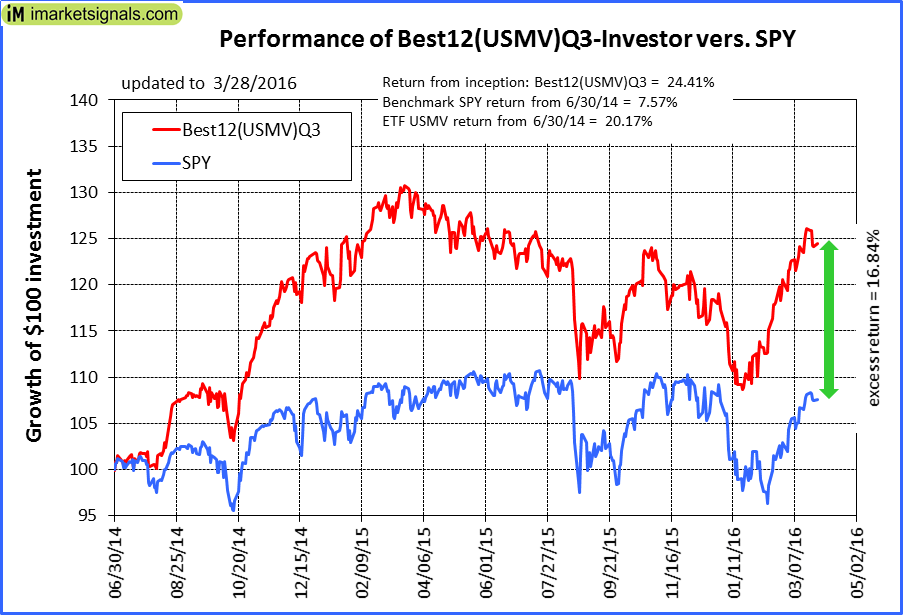 |
iM-Best12(USMV)Q3-Investor: The model’s out of sample performance YTD is 6.1%, and for the last 12 months is -3.2%. Over the same period the benchmark SPY performance was 0.2% and 0.9% respectively. Since inception, on 7/1/2014, the model gained 24.41% while the benchmark SPY gained 7.57% and the ETF USMV gained 20.17% over the same period. Over the previous week the market value of iM-Best12(USMV)Q3 gained -1.15% at a time when SPY gained -0.70%. A starting capital of $100,000 at inception on 7/1/2014 would have grown to $124,407 which includes $296 cash and excludes $564 spent on fees and slippage. |
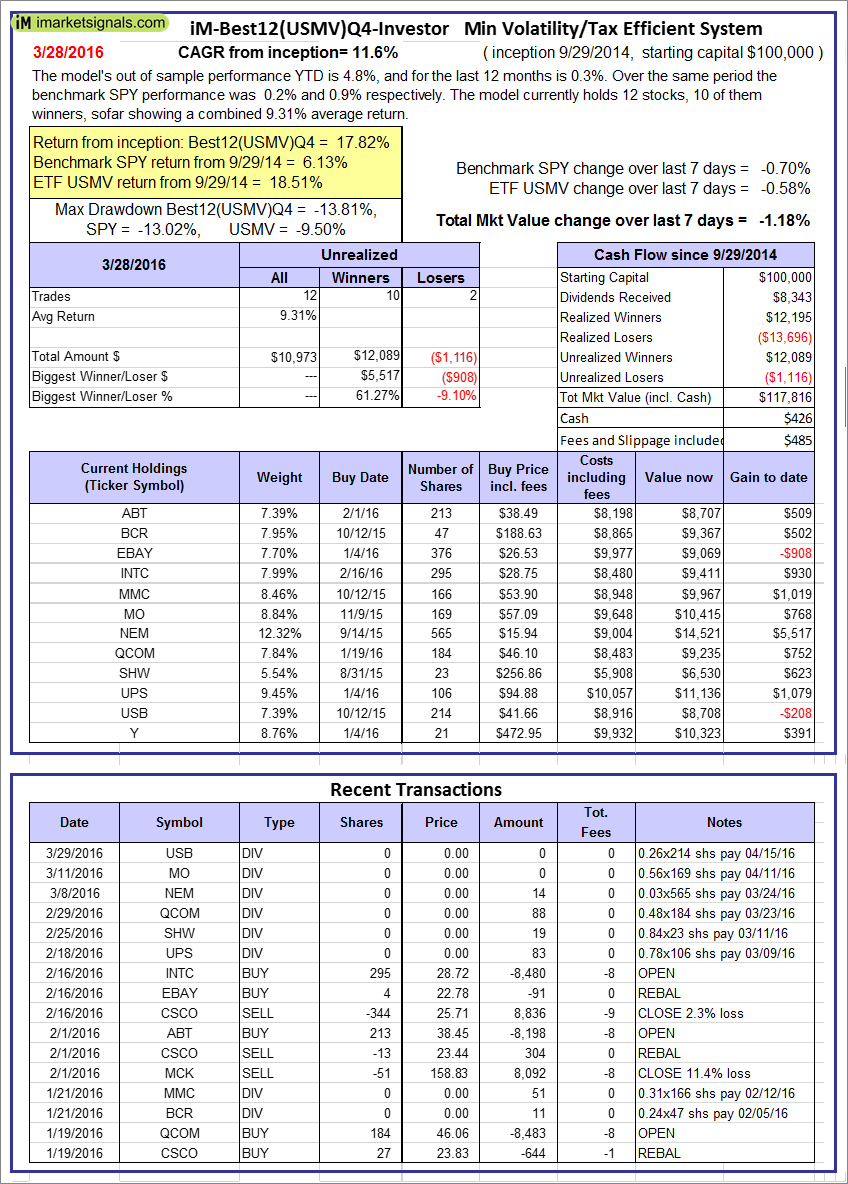 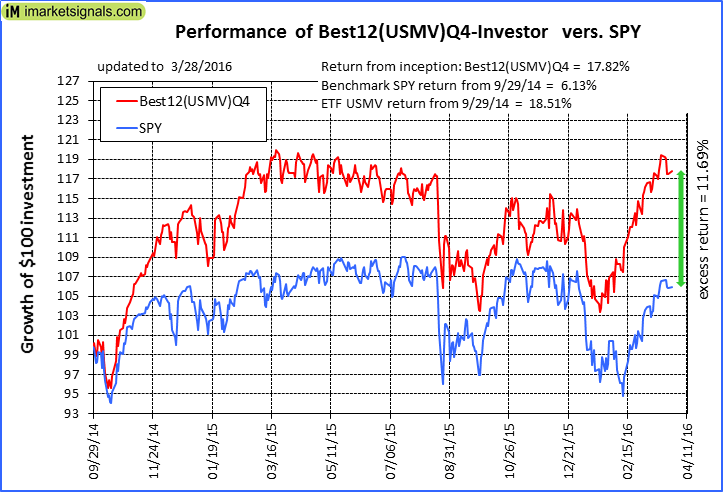 |
iM-Best12(USMV)Q4-Investor: Since inception, on 9/30/2014, the model gained 17.82% while the benchmark SPY gained 6.13% and the ETF USMV gained 18.51% over the same period. Over the previous week the market value of iM-Best12(USMV)Q4 gained -1.18% at a time when SPY gained -0.70%. A starting capital of $100,000 at inception on 9/30/2014 would have grown to $117,816 which includes $426 cash and excludes $485 spent on fees and slippage. |
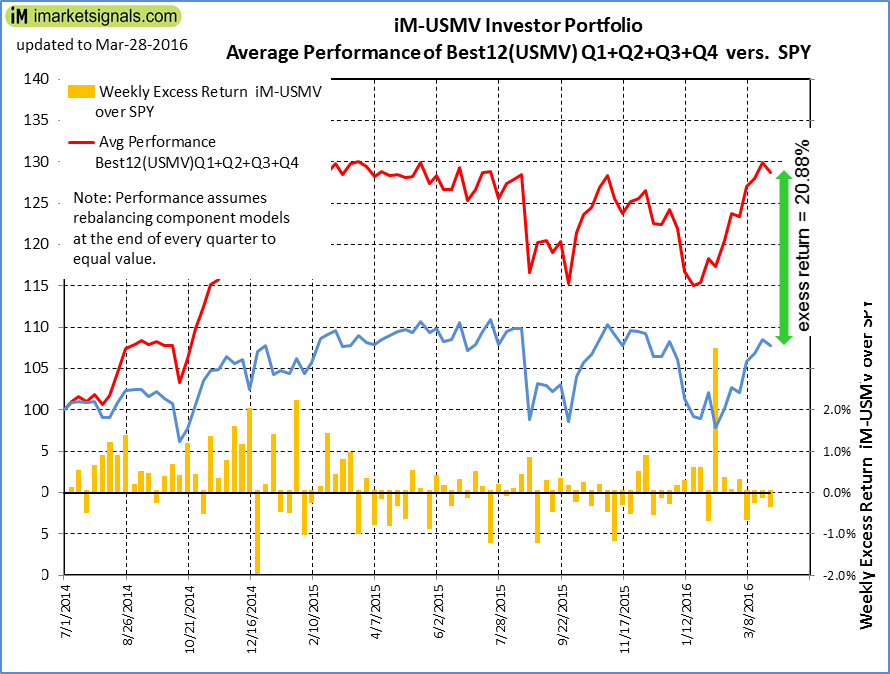 |
Average Performance of iM-Best12(USMV)Q1+Q2+Q3+Q4-Investor resulted in an excess return of 20.88% over SPY. (see iM-USMV Investor Portfolio) |
 |
iM-Best(Short): The model’s out of sample performance YTD is -0.7%, and for the last 12 months is -0.6%. Over the same period the benchmark SPY performance was 0.2% and 0.9% respectively. Over the previous week the market value of iM-Best(Short) gained 3.13% at a time when SPY gained -0.70%. Over the period 1/2/2009 to 3/28/2016 the starting capital of $100,000 would have grown to $103,939 which includes $124,268 cash and excludes $18,550 spent on fees and slippage. |
iM-Best Reports – 3/28/2016
Posted in pmp SPY-SH
Leave a Reply
You must be logged in to post a comment.