
- This combination model aims to provide good returns with low drawdowns during all market conditions.
- For the period 2000 to 2016 the backtested annualized return is 24.0% with maximum drawdown of -10.5%.
- There are five equal weight component models in Combo5.
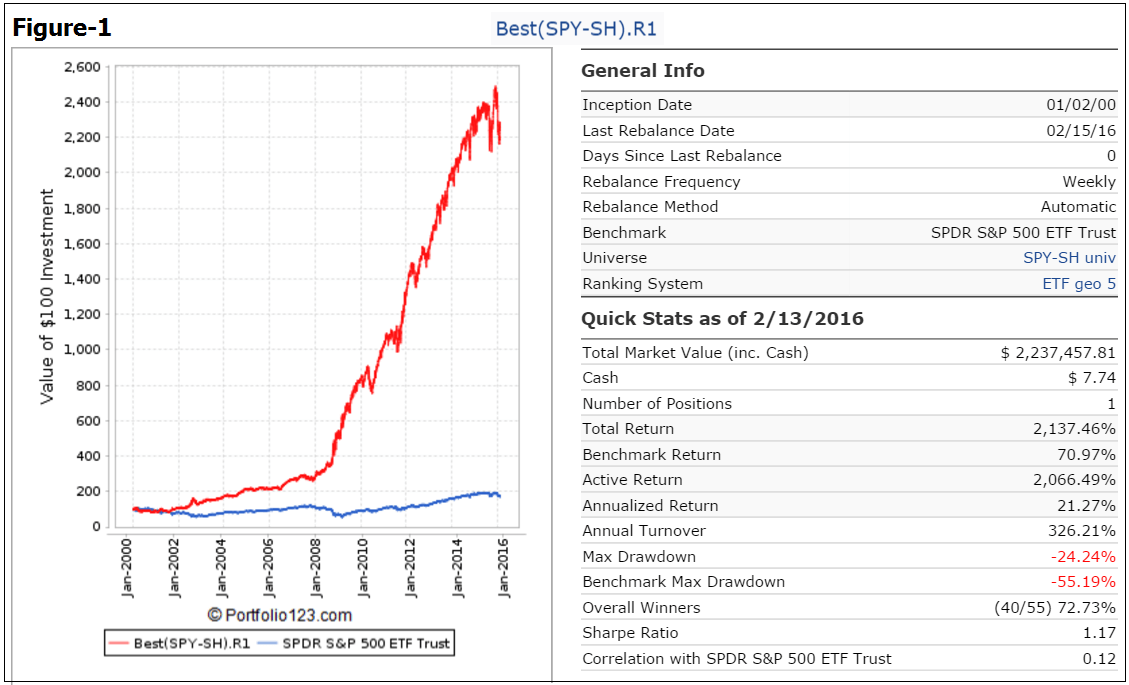
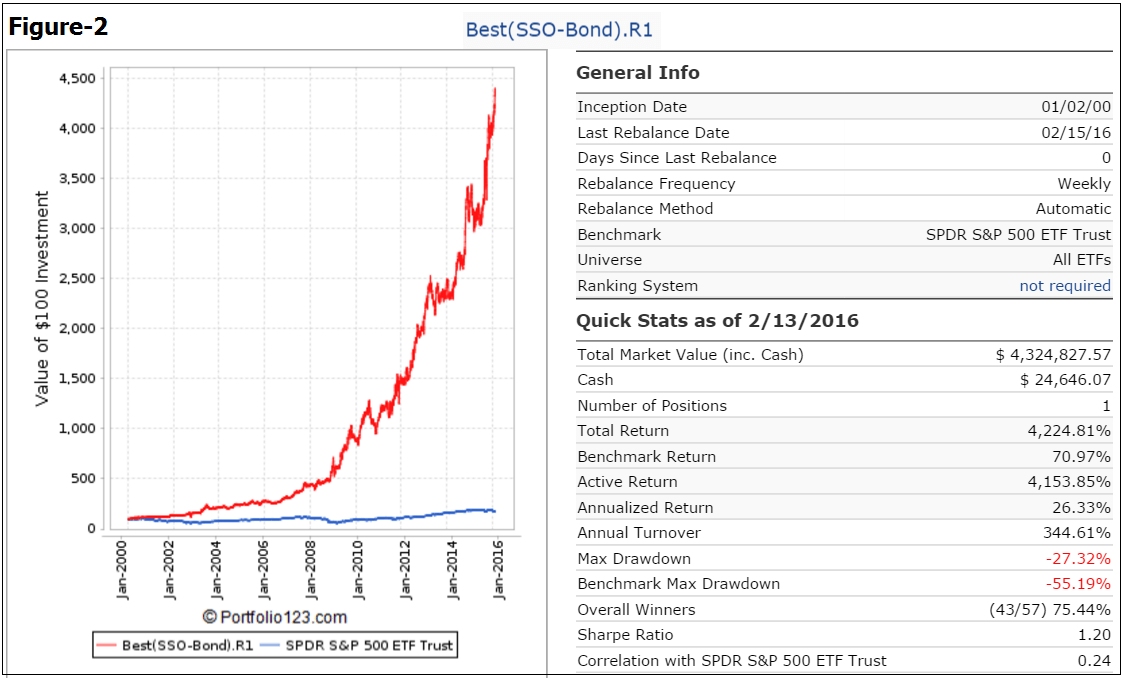
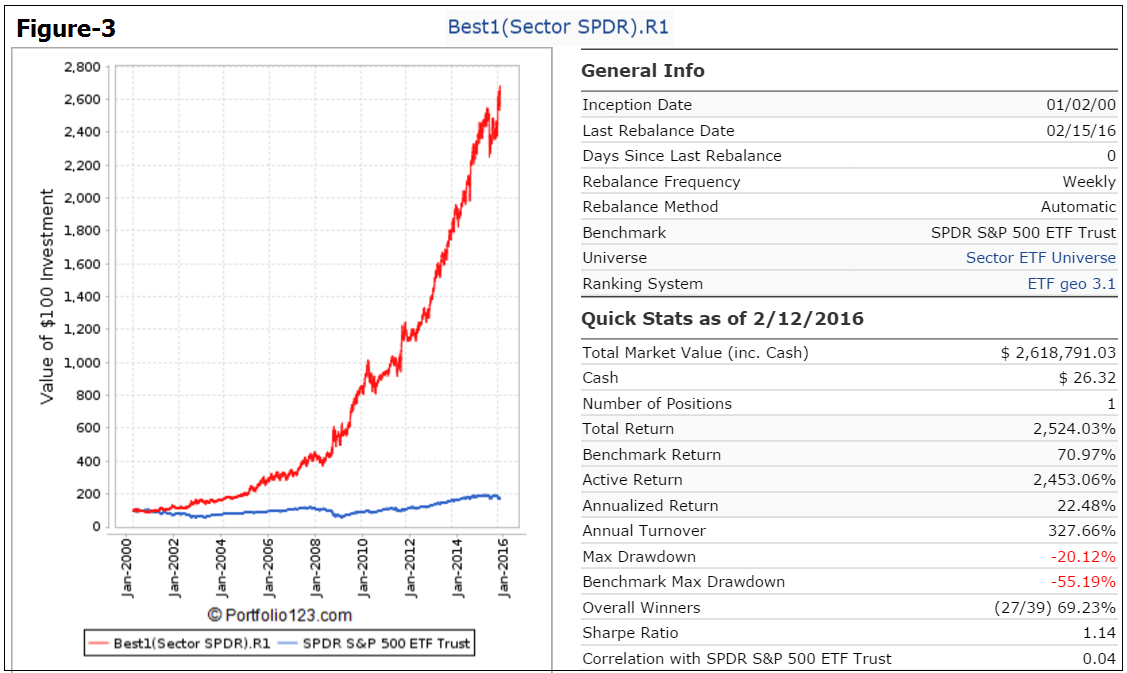
- Three of which are also represented in Combo3.R1: Best(SPY-SH).R1, Best(SSO-Bond).R1, and the Best1(Select SPDR).R1.
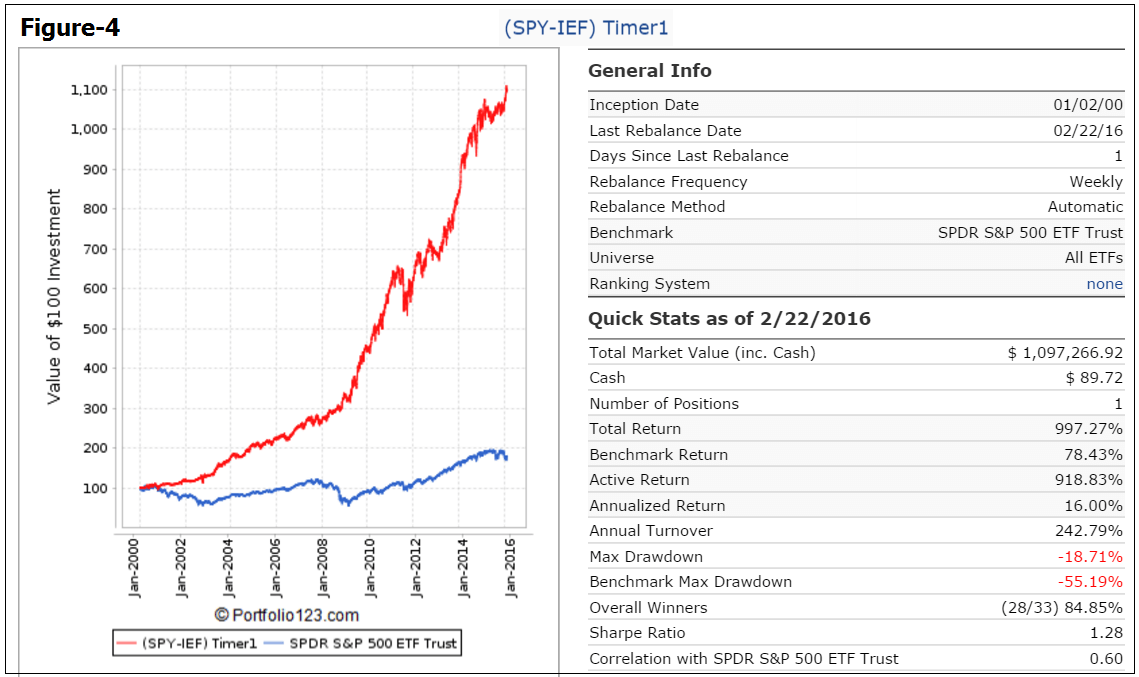
- The two additional component models in Combo5 are: (SPY-IEF) Timer1, which switches between SPY and IEF; and (QLD-IEF) Timer, which switches between QLD and IEF.
Simulated performance of component models
The performance curves of the five equal weight component models of Combo5 are shown below.
(Figure-1) Best(SPY-SH).R1 ,
(Figure-2) Best(SSO-Bond).R1,
(Figure-3) Best1(Select SPDR).R1 ,
(Figure-4) (SPY-IEF) Timer1, which switches between SPY and IEF, and
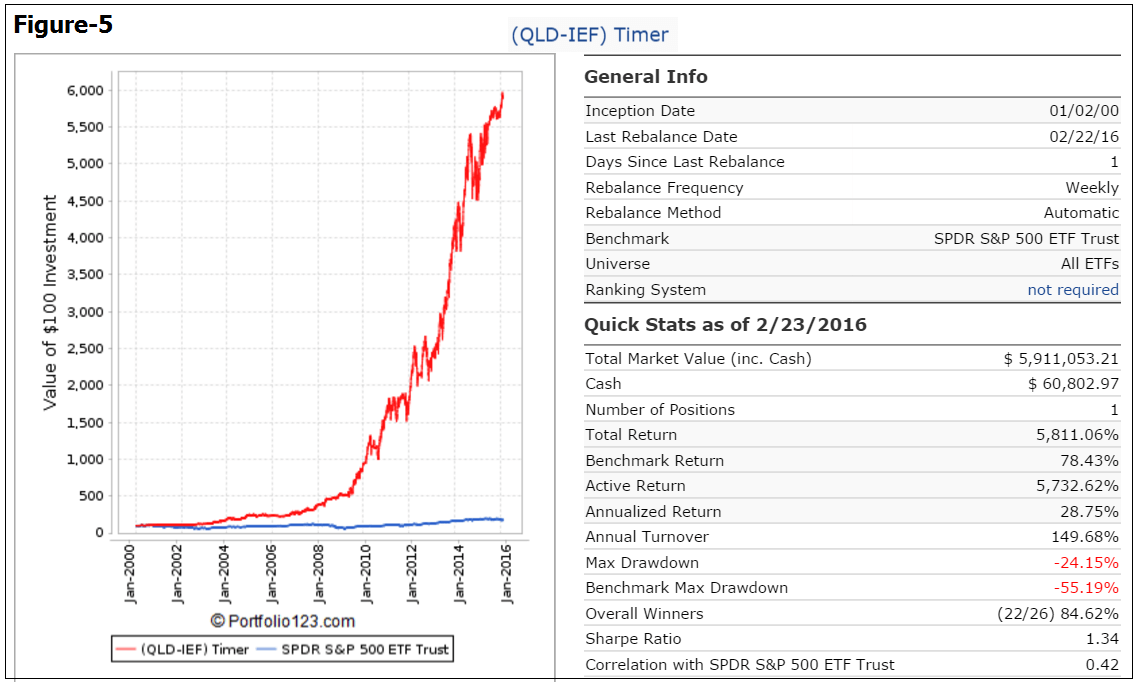
(Figure-5) (QLD-IEF) Timer, which switches between QLD and IEF.
Simulated Performance of Combo5
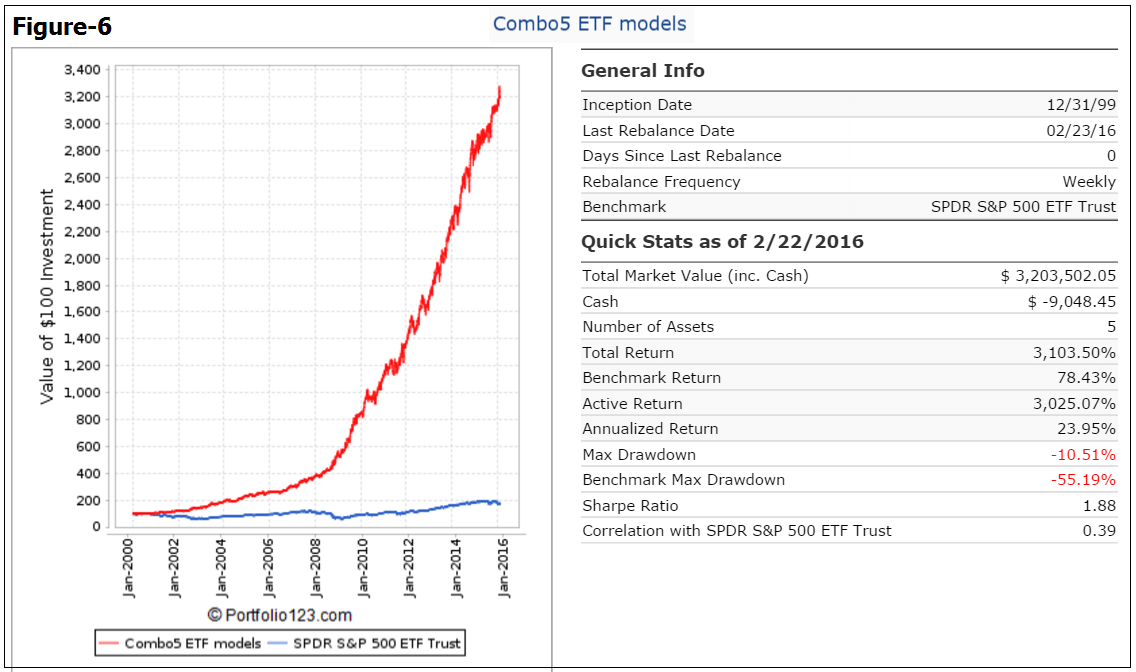
The simulated trading performance of the system from Jan-2000 to Feb-2016 is shown in Figure-6 below. The annualized return would have been 24.0% with maximum drawdown of -10.5%. All values are with dividends reinvested.
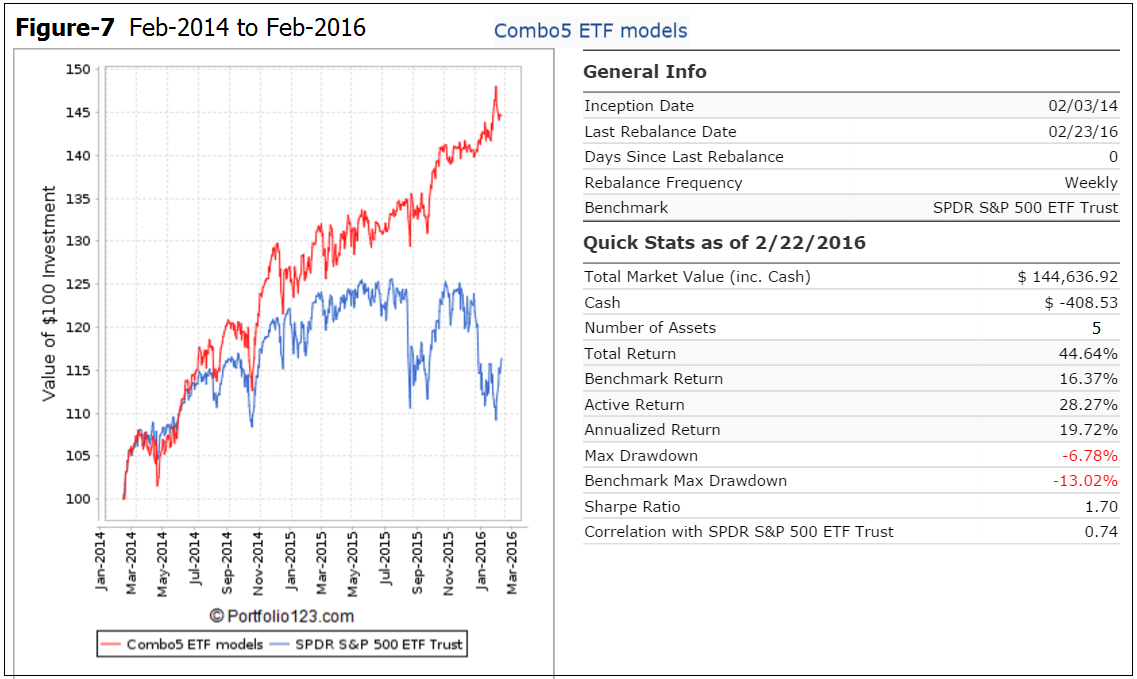
The simulated trading performance of the system from Feb-2014 to Feb-2016 is shown in Figure-7 below. The total return would have been 44.6% with maximum drawdown of -6.8%. Combo5 avoided the recent market correction and continued to produce positive returns while the stock market lost about 12%.
Performance statistics for other periods of interest are shown in the Appendix.
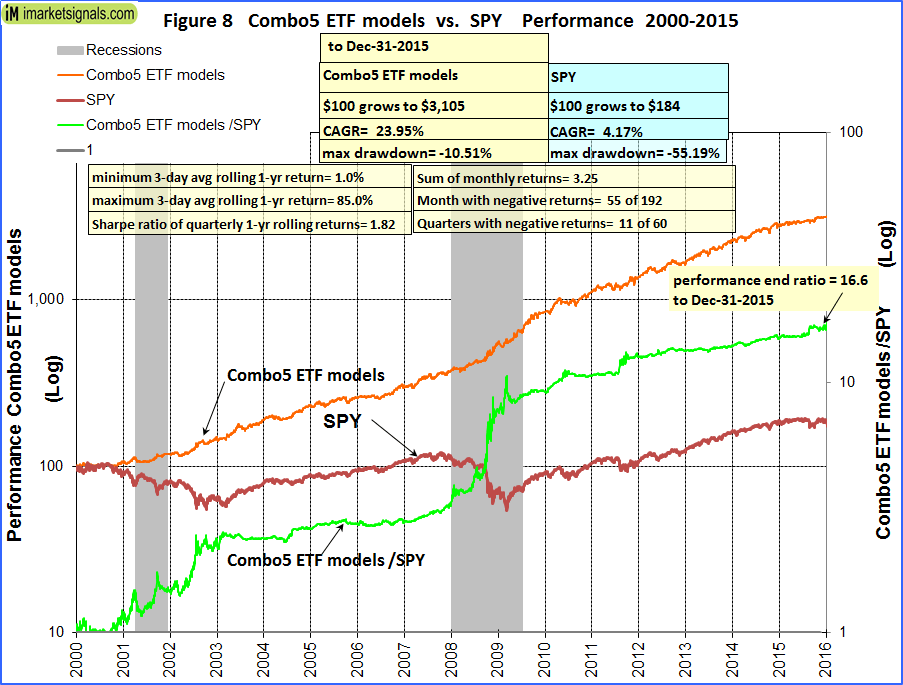
Figure-8 shows performance from Jan-2000 to Dec-2015. The green graph is the performance ratio of the Combo5 to SPY. A rising slope of this graph indicates when Combo5 outperformed SPY; Combo5 produced about 17 times the value to December 2015 which one would have had from a buy-and-hold investment in SPY over the same period.
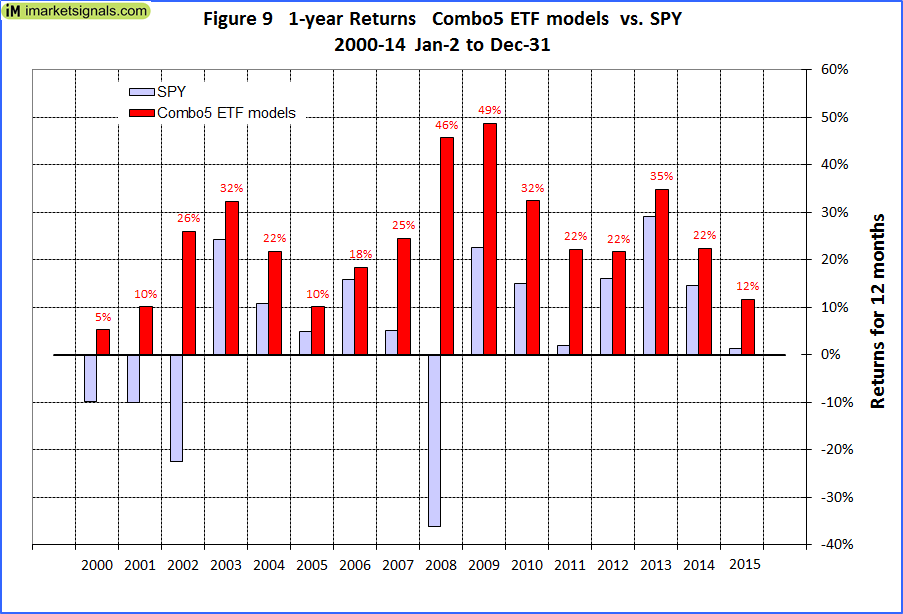
Annual Returns
Calendar year performance ranged from a maximum of 49% for 2009 to a minimum of 5% for 2000. There would never have been a loss over any calendar year.
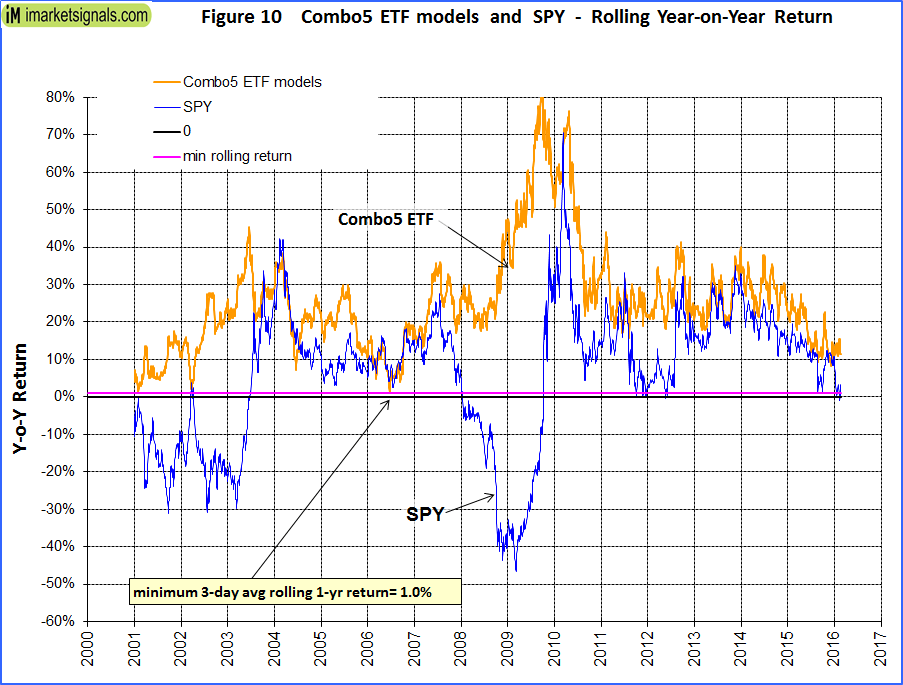
Rolling 1-year returns
Figure-10 shows the rolling 1-year returns starting each trading day from 2000 to 2015. The minimum return over 12 months was 1% and the maximum was about 80%.
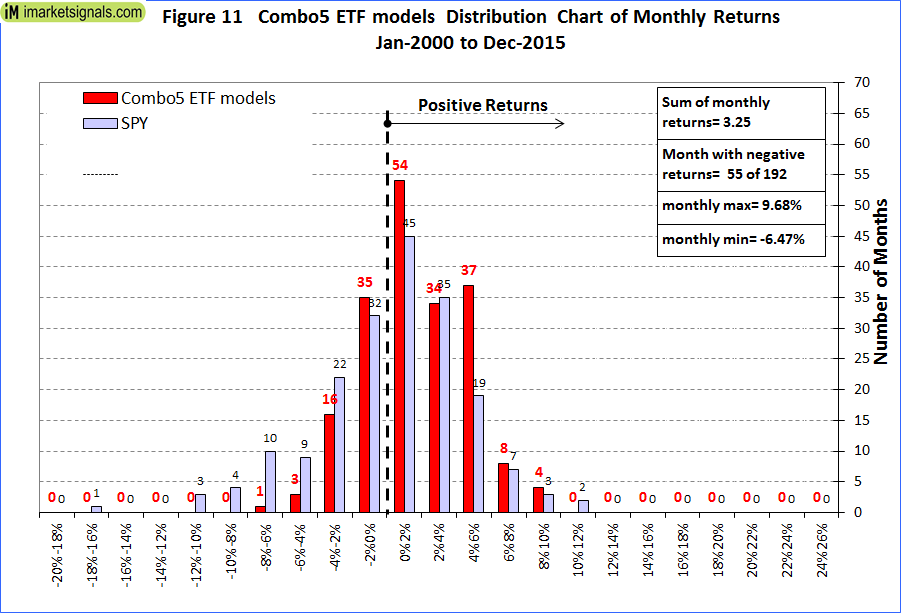
Distribution of Monthly Returns
Figure-11 shows the distribution of monthly returns. There were a total of 192 months in the period under consideration. Combo5 produced positive returns during 137 months and only 55 months had negative returns. SPY had 81 months of negative returns.
Correlation between component models
The correlation between the component models is fairly low, with 1.0 signifying 100% correlation.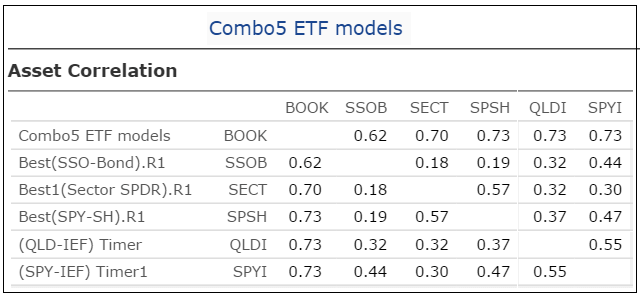
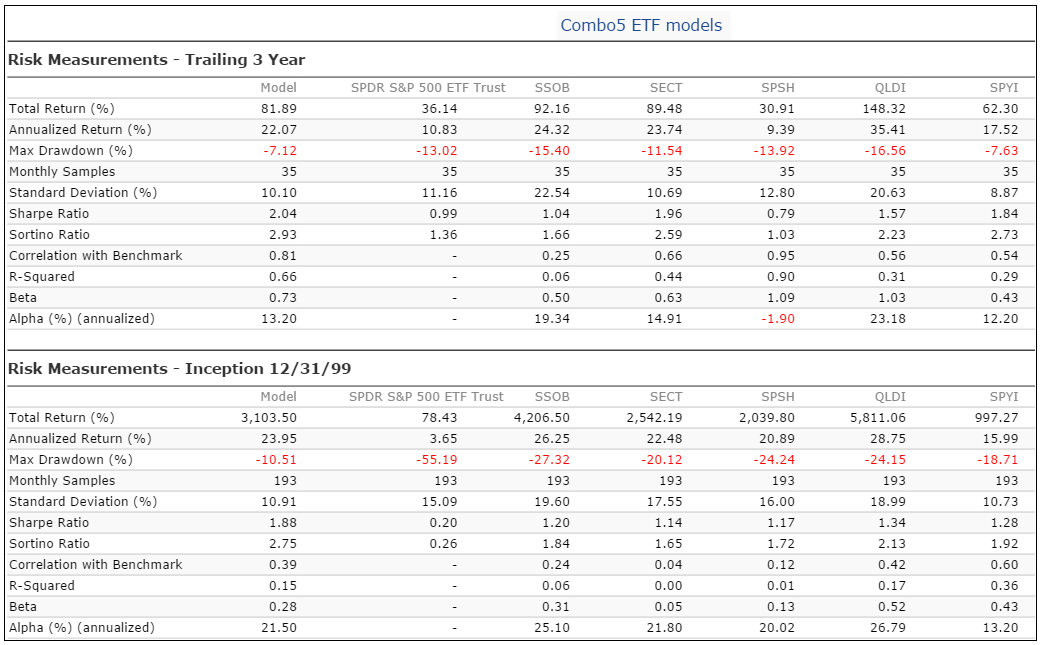
Risk Measurements
The below table highlights the advantage of combining models. For example, the maximum drawdowns from inception range from -18.7% to -27.3% for the five component models. But when combined, the drawdown becomes an acceptable -10.5%.
Following the Model
This model can be followed live at iMarketSignals (requires Gold subscription), where it will be updated weekly together with our other trading- and macro models.
As of 2/16/16 the holdings for Combo5 are 40% IEF, and 20% each SH, TLT and XLV.
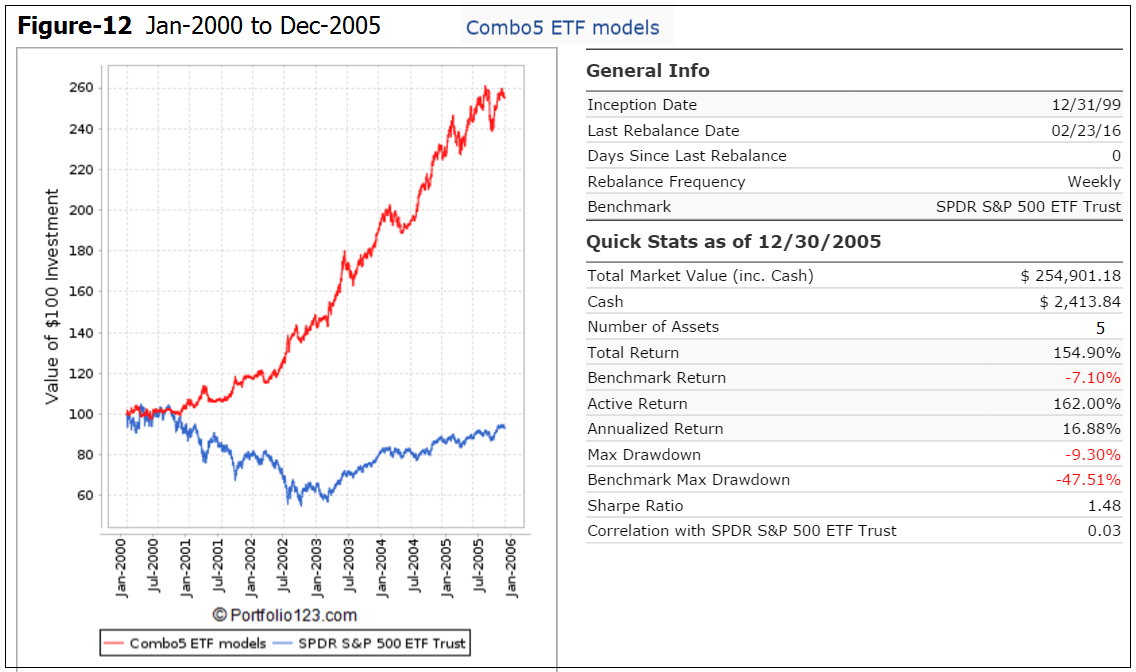
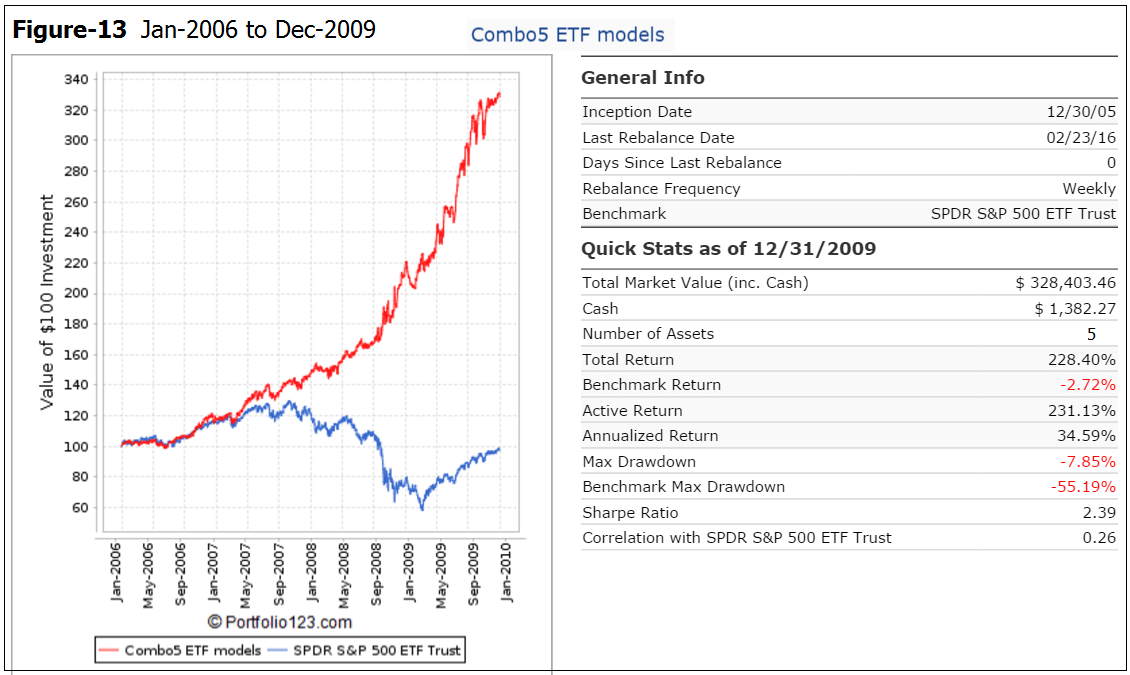
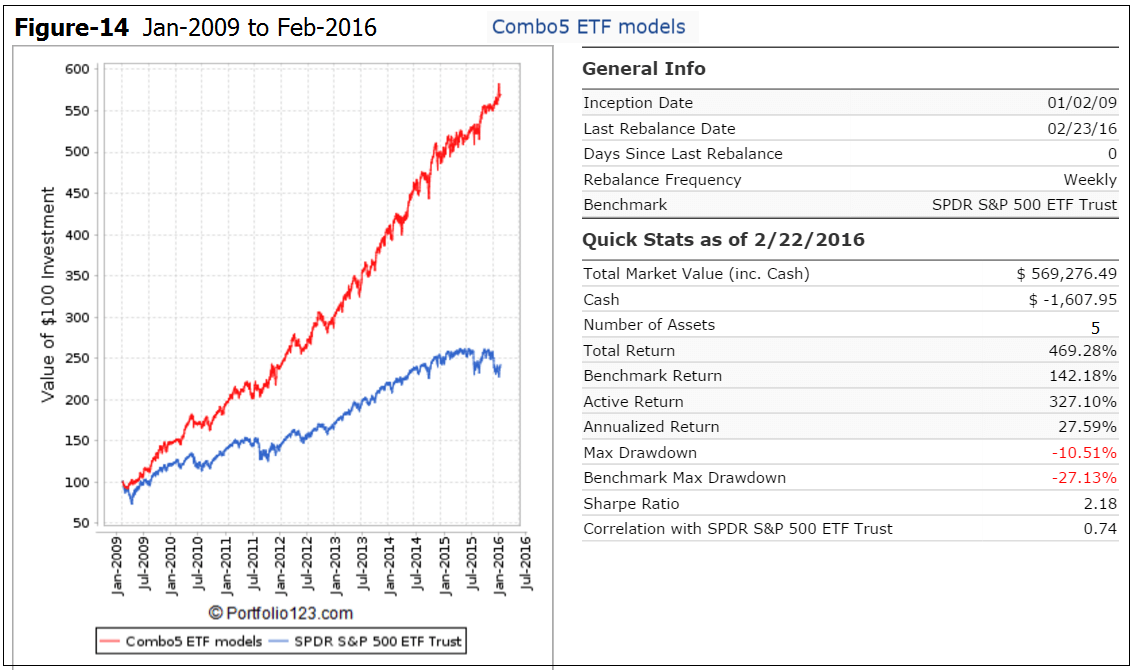
Appendix
The simulated trading performance of the system for other periods of interest are shown Figures-12, -13 and -14
Disclaimer
One should be aware that all results for the Combo5 system are from a simulation and not from actual trading.
All results are presented for informational and educational purposes only and shall not be construed as advice to invest in any assets. Out-of-sample performance may be much different. Backtesting results should be interpreted in light of differences between simulated performance and actual trading, and an understanding that past performance is no guarantee of future results. We can make no claims about future performance of this combination model, which may include significant potential for losses. All investors should make investment choices based upon their own analysis of the asset, its expected returns and risks, or consult a financial adviser. The designer of this model is not a registered investment adviser.
can you tell me what the annual returns would have been if you substituted SSO & SDS for SH & SPY…I like the limited downside of 10.5% and the obvious diversification of this model !
well done !!
Annual returns would be higher and max D/D also higher if one substituted SSO & SDS for SPY & SH, respectively.
This model aims to provide reasonable returns with low D/D during all market conditions. Our aim was not to maximize returns, but to provide a good combination model with low D/D.
1)Is the iM-Best(SPY-IEF) market timer model with cagr 16.86 and max drawdown -10.67 the same one used in Combo5 (SPY-IEF) Timer1 which has a cagr 16.00 and max drawdown -18.71? If so, why the difference in drawdown?
2)How many trades generated in:
iM-Combo5
Combo3.R1
Combo4b.R1
Thanks
1)The (SPY-IEF) Timer1 is a model on its own – a completely different model than the iM-Best(SPY-IEF) market timer model, which has 3 component models in combination.
2)Please refer to Figures 1 to 5. Number of trades are listed in third line from bottom: Overall Winners.
Are the SPY-IEF and the QLD-IEF essentially the same model? What are they based on? Earnings & MA?
Really nice combo. Looking forward to 6 and 7.
SPY-IEF and the QLD-IEF are not essentially the same model. Refer to the correlation table: their correlation coefficient is 0.55.
Very nice model. Can you please tell us what the following information would be if BESTOGA3 were added to Combo5. That would be 16.66% each of the 6 positions of Combo5 plus BESTOGA3.
from 2000-2016:
Annualized Return
Max Drawdown
Sharpe Ratio
Min 1 yr Return
from Feb-2014 to Feb-2016:
Annualized Return
Max Drawdown
Sharpe Ratio
Min 1 yr Return
This will be the Combo6 model which we will publish soon with full description. Bestoga3 is an excellent addition to Combo5.
We will shortly publish our new short model: “Best6 Shorts of the Russell3000 with timed Hedge”. This short model will be added to Combo6 to form the seven component model: Combo7.
Your models are stellar for reacting to the recession/bears of 2001, 2002, 2003 and 2008. If you exclude those years, what is the average return versus the benchmark? I can kind of get if from the yearly return bar chart and it our course looks very good. It would give me a sense of the models potential in “normal” times. Thanks.
Please refer to Figure-10, Rolling Year-on-Year Return. This chart can be used to figure average return over any time period. For example, from 2011 to 2015 the average return was about 25%.
Perhaps you can just give me each of the annual return numbers for the model and SPY.
Figure-9 shows the annual return for each calendar year for Combo5 and SPY.
Can you include the YTD 2016 relative performance?
From Date 1/2/16:
Total Return 3.56%
Benchmark Return -4.09%
Active Return 7.65%
Max Drawdown -2.63%
Benchmark SPY Max Drawdown -10.31%
On Figure 11, in the months when SPY was negative, how many were there (if any) where the model was more negative?
Overall, how many months were there where the model’s return was less than SPY?
We did not extract those details.
Monthly Performance (Last 12 Months)
Return (%) 3/2015 4/2015 5/2015 6/2015 7/2015 8/2015 9/2015 10/2015 11/2015 12/2015 1/2016 2/2016
Model -2.41 1.14 2.40 -1.15 2.66 -0.29 -0.91 5.71 0.26 -0.48 1.38 2.19
Benchmark -1.57 0.98 1.29 -2.03 2.26 -6.10 -2.55 8.51 0.37 -1.73 -4.98 0.94
Excess -0.84 0.15 1.11 0.88 0.40 5.80 1.64 -2.80 -0.11 1.25 6.36 1.25
Is there any way I can download the monthly or annual returns and the drawdowns of this new model in a spreadsheet format?
Thanks for your help.
Very nice. Are other ETFs considered like SDIV?
The inception date of the Global X SuperDividend ETF was 6/8/2011. This is too recent for a backtest. Can you suggest another dividend ETF we can use prior to this date?
Thanks for all the answers.
One more question. Can you run it with SHY always as the bond default in the three component models that invest in bonds? Just the overall annualized return is fine.
Georg,
Are the various algorithm parameters the same for SPY-IEF and QLD-IEF? If so would it make sense to use VTI-IEF instead and split the portfolio allocations into quarters?
Thanks,
Jon
The algorithm parameters for the SPY-IEF and QLD-IEF component models are different. The correlation coefficient between those two models is 0.55.
Georg, a very nice logical model. Well done. We’ve been in a declining/low interest rate environment for awhile. Is there a way to backtest to show what the result would be if cash were used in instead of TLT, IEF or SHY in a rising rate environment?
Yes, that is what I was driving at above with the suggested use of SHY. But cash might be a better way to frame it.
For the three component models instead of switching to treasury ETFs now using BIL (1-3 Month T-Bill ETF) :
Combo5 performance:
AR= 20.48%
max D/D= -13.42%
Sharpe= 1.61
This is an excellent model. Once again shows your creativity and expertise.
Is the data on monthly or annual returns and drawdown available for this new model from 2000-2016 for download in a spreadsheet format?
Thanks.
Georg, thanks for this.
Just to clarify, SPY-IEF Timer1 is not the same as the 50/220 MA model, you use in your current SPY-IEF, is that right?
Tom C
Correct, it is totally different.
Thank you for this interesting addition to your growing work! I am wondering about performance of Combo5 without the (SPY-IEF) timer 1 (a “Combo 4”) or substituting Bestoga for (SPY-IEF) timer 1. Superficially, (SPY-IEF) timer 1 looks like the weakest player. Obviously, lots of permutations to look at. Thanks!
Excluding (SPY-IEF)Timer1 does not improve performance. Combining models with low correlations to each other produces the best results.
From the Risk Measurements one sees the Timer1 has the lowest drawdown and also the lowest return. But it does benefit the combination model.
Bestoga3 can be added equal weight to Combo5 (Combo6) for even better returns and lower risk. The simulation produces:
Annualized Return= 24.4%
max D/D= 9.0%
Sharpe= 2.02
Georg – When you say Bestoga3 can be added equal weight to Combo5 to create Combo6, do you mean there are now 6 equal weights with each representing 16.67%?
Combo6 holds 6 equal weight component models with each having a nominal weight of 16.67%.
Georg & Anton – Can you please guide me where to find data on annual returns & max. drawdowns for the models? I am a new user that signed up for the Gold membership a few months ago. Thanks.
You can see returns for all the models in the first two tables heading the Model Performance Tables. Click on Model Performance Tables in the top right hand corner of the Home page and it will take you there.
Georg & Anton – What is the number and percentage of the overall winners for the new Combo5 Model? Thanks
You have to get this number from the five component models, Figures 1 to 5, third line from the bottom.
Georg – How can you get the overall or aggregate winners from the five component models? Just the third line from the bottom info in Figures 1 to 5 would not provide you with enough information.
You have the aggregate info in your master spreadsheet. For example, if 2 component models had a negative return in a period, and 3 had positive returns, and still because of the percentage allocated towards each component model and the loss in each component model, the result overall maybe negative, etc.
Unless I am missing something here. If you are able to provide this info, that would be great. Thanks for your help.
I will likely change the piece of my portfolio that is using Combo4, to Combo6.
I also allocate a piece to the original SPY-IEF. When that model is in 0% in SPY, would it make sense to follow Combo 6 instead of buying IEF?
I could figure that myself if you could provide a download of the returns for Combo6 (or Combo5 if that is more convenient).
Thanks.
We can’t give investment advice. We will provide a performance analysis of Combo6 soon.
Since Gold could possibly have a low correlation to some of the models in Combo6 above, would it be possible to add a GLD-Bond to make 7 equal parts (14.28% each) using the Gold Coppock model. Or if gold miners work better, GDX-Bond. The bond could be according to the BVR or use IEF whichever makes more sense.
And if Silver works better than Gold use SLV-Bond or for silver miners SIL-Bond?
Would any of those additions improve the return, drawdown and Sharp compared to Combo6?
We have a Gold model which we will publish soon. Adding it to Combo6 does not provide better returns, although its correlation to the other component models is nearly zero. Annualized return for the Gold model is about 12% from 2000 to 2016. It is currently in Gold.
Are all models in the Combo5 and Combo6 rebalanced weekly?
Have you tried monthly rebalancing for these models? Does it improve risk-adjusted returns or makes them worse? If so by how much?
From my past experience with tactical allocation models, implementation of monthly and quarterly rebalancing strategies is more practical. Weekly and bi-weekly get more overwhelming.
Rebalancing the model every 4 weeks does not improve returns. There are so few signals being generated that this should not be to difficult to follow.
Thanks Georg. Just to clarify – Did you mean there are so few signals being generated by weekly rebalancing that following the Combo5 should not be difficult?
George,
Can you post a performance comparison of the 2 possible combo 7 models that can be created using the 5 slot or 10 slot short portfolio options?
Thanks,
Jon
Hi Georg,
I really like this model because of the low Max DD. Could you please post the yearly Max DD for Combo5?
Thank you!
Note: this is from a simulation not from actual trading.
yr Combo5
max D/D
2000 -6.31%
2001 -7.02%
2002 -5.99%
2003 -9.30%
2004 -6.82%
2005 -8.47%
2006 -5.41%
2007 -7.25%
2008 -6.97%
2009 -7.85%
2010 -10.51%
2011 -10.23%
2012 -8.52%
2013 -7.12%
2014 -6.78%
2015 -4.82%
Georg –
Thanks for posting the max. drawdown information for Combo5 by year. I had also requested this info.
Follow-up request: Would it be possible for you to provide the time period (i.e., months of January & February, etc.) that this Max. drawdown occurred in each year. Would be much appreciated if you can provide this info at your convenience.
Great work Anton & Georg. Look forward to Combo6 & 7 as well.
Georg and Anton,
Have you guys given any consideration to adding software that would allow your subscribers to combine the proprietary models you have built into a book? When you first started I was able to do this @P123 but now the majority of your work is not available on their site. One of the things I’m most interested in, and I’m sure others are as well, is what type of book can be created using Combo 5 as the basis and then adding one or more of the following in various combinations:
iM-BESTOGA-3
iM-Best(Short) 5 slot
iM-Best10 shorts from the Russell 3000
iM-Gold Timer
Since a user interface, if even possible, would constitute a major investment of time and energy on your part could you add the iM-Gold Timer to your upcoming report on Combo 7 in an appendix?
Thanks,
Jon
Will you use the BVR model to determine which bond (TLT, IEF, SHY) for the SPY-IEF and QLD-IEF portions of this model?
Hi Georg and Anton:
I like this model a lot…….Scratching my head a bit regarding the most recent Model Performance Tables; Out of Sampling Performance Summary for the Combo5:
https://imarketsignals.com/wp-content/uploads/2016/03/Performance-mth-3-8-2016.png
It notes that the YTD performance for the Combo5 is +2.21%. However, the performance of the Combo3.R1 (60% of Combo5) is -7.33%. Assuming the other 2 strategies in the Combo5 (40% of Combo5), (SPY-IEF)Timer 1 and (QLD-IEF)Timer, have been in IEF since 1/1; IEF’s performance this YTD is +3.1%. Seems the overall YTD performance for the Combo5 is around -3.28%…..or am I wrong.
Hey, it seems to me that the overall performance/risk profile for Combo5 would be improved, maybe significantly, if Combo3.R1 was replaced with Combo3B.R1. Would you be kind enough to conduct a quick analysis.
Many thanks. Have been profiting from your site……..
Vman
We revised Combo3 to Combo3.R1 middle of February. Thus Combo3.R1 is performance for Combo3 to the change date and from then on the performance of Combo3.R1.
If Combo3.R1 would have existed from the beginning of the year it would have made a 1.9% return to end of Feb.
We will soon post Combo6 = Combo5 + Bestoga3, which is close to what you suggest.
Georg:
Understood. Thanks.
Vman
Georg –
For the Combo5 model, I am counting a total of 210 trades over 16 years (2000-2015). Is this correct?
How many trades out of the 210 were winners?
Appreciate if you can provide this data. Thanks.
The backtest shows an average win rate of about 77%.
Excellent. Thanks Georg.
Are there about 210 trades (I just added all trades in all 5 components) over 16 years i.e, about once a month?
In Combo7 Figure 4 has the annual return on top of each bar, which is nice to see each year’s returns.
Can you please provide annual returns for each year in Figure 9 for Combo5?
Thanks.
Figure 9 is now updated with annual returns.
Thanks Anton
can you clarify the current holdings please. The table still shows TLT but I believe the update indicated TLT was to be sold and replaced with SSO?
Georg,
Would it be possible to show the positioning of the QLD-IEF timer separately, in the same manner as you already show the positioning of the SPY-IEF Timer in your home page and in the Sunday notification? Because it is one of the components of Combo 5, 6 and 7, it is important for those following these models know each component separately.
The synthesis of the components that you reveal under Combo5 can be prone to error. Correct me if I am wrong, but shouldn’t the change of 3/13 in the SPY-IEF timer to 50/50 have changed the components of Combo5 to 1.5XIEF, .5XSPY,1XSH,1XSSO,1X XLV? If so, the Sunday notification of Combo 5 has the same error as the home page
Thanks!
Hi macor8,
I noticed the same error. Did you get a response from Anton or Georg? If so, can you please help clarify the math for me.
Thanks.
It is not an error.
The components of Combo5 are listed in the model description. Please note that the (SPY-IEF)Timer1 of Combo5 is a single model, and is not the same as the iM-Best(SPY-IEF)Market Timer which is a combo of three market timing models.
Sorry for the confusion
Georg –
YTD Combo5 would not have positive returns unless it was for the 4th (SPY-IEF) and 5th (QLD-IEF) components.
Can you please start publishing the results of these 2 components separately. After all Gold subscribers are getting access to all components, right? Is there a reason NOT to publish the results of 4th & 5th components separately? Is this a packaging or marketing issue?
Thanks guys.
Sorry, we will not be publishing performance reports for the (SPY-IEF)Timer1 and the (QLD-IEF). You can see their holdings in the Combo5 Position Table, which is updated weekly.
I respect your decision. I am sure you have your reasons NOT to publish all the components.
Georg –
Which of the 5 components of the Combo5 in live trading (i.e., out of sample) has already encountered a drawdown that is bigger than the max. drawdown you folks observed in back-testing (in sample)?
Thanks.
Raj, Combo5 is life for less than a month and you expect in these 4 weeks max drawdowns?
Anton,
I was asking about each of the 5 components of Combo5, NOT the Combo5.
For example, when I see Combo3.R1 is down 7.7% YTD as of March 21st, makes me wonder if any of the individual 5 components has already exceeded the drawdown seen during the back-test. No reflection on you guys. The equity markets were brutal from Dec-2015 to mid-Feb, 2016. That is why the question.
Raj
Please see our reply to your similar comment above.
I get it. You want to keep Combo5 in a box and not share the results of each component strategy. Fair enough.
Georg –
Someone was telling me that for a weekly rebalanced strategy one has to make trades every week just to keep the percentage balance between component strategies.
Can you please confirm that you have to make 5 trades every week for Combo5 and 6 trades every week for Combo6 on Monday to keep the holdings from each signal at 20% each or 16.66% each, even if there is no new signal? In other words, do your CAGR & max. drawdown numbers assume you will make these 5 or 6 trades every week?
On a $100,000 account, this is roughly 2.5% to 3% per year. I am assuming that your CAGR results are after these charges are paid, right?
By the way, are you implementing any of the strategies in your own accounts? If you can share your experience, it would be much appreciated as I start on my journey.
Thanks.
I guess the bigger question (even more than the trading costs for weekly rebalancing) is if one only rebalances, when there is a new signal and does not rebalance weekly, does this cut the return in half and creates a huge max. drawdown OR is there only a marginal slippage in returns & increase in drawdowns from your experience & modeling.
Appreciate any guidance you can provide.
Thanks again.
Raj, Like all our other models rebalancing is done when a component is 5% off its allocated weight. For a $100K five-component portfolio, that is $20K for each component, rebalancing would require a transaction greater than 5% of $20K, or $1000.
Excellent. Thanks Anton. That is the answer I was hoping to get. 5% band makes sense. This will cut down on the number of trades and still provide the returns.
Can you point me to where this 5% rule is documented. I am sure there are other rules there that I can read up on and keep improving my understanding. In other words, do you have a manual of sorts for beginners?
3-27-2016 update-How can XLV still be a position ? XLV was sold to cash ?
Combo5 does not hold XLV per update 3-27-2016.
3/27/2016 iM-Combo5. Trades 1 assets
(As SH and SSO are opposing positions, the model effectively holds 20% each IEF, SPY , XLV, QLD, and Cash )
update is incorrect then !
Please note the trades in the main table are correct. Unfortunately the updating of the remark was overseen. To reduce future confusion, remarks will be kept as simple as possible and in this case was changed to “(As SH and SSO are opposing positions, these two positions are effectively the same as SPY and Cash), thereby commenting only the two positions and not the model as a whole.
Is the max. drawdown on your strategies a daily max. drawdown or is it a monthly max. drawdown i.e., the daily max. drawdown is actually bigger than the reported drawdown?
Drawdown is based on daily values.
For the backtested period from 2000 to present, do you have and/or can you provide the dates of the signal switching for the (SPY-IEF) Timer1 and (QLD-IEF) Timer models?
(SPY-IEF) Timer1
: Symbol : Open – Close , Days , Pct Return
32 : SPY : 11/16/2015 – 12/7/2015 , 21 , 1.13%
31 : IEF : 3/23/2015 – 11/16/2015 , 238 , -2.50%
30 : SPY : 3/2/2015 – 3/23/2015 , 21 , -1.14%
29 : IEF : 2/17/2015 – 3/2/2015 , 13 , 0.03%
28 : SPY : 2/3/2014 – 2/17/2015 , 379 , 20.39%
27 : IEF : 12/30/2013 – 2/3/2014 , 35 , 2.77%
26 : SPY : 2/11/2013 – 12/30/2013 , 322 , 20.88%
25 : IEF : 12/3/2012 – 2/11/2013 , 70 , -2.45%
24 : SPY : 6/28/2010 – 12/3/2012 , 889 , 31.28%
23 : IEF : 5/10/2010 – 6/28/2010 , 49 , 4.06%
22 : SPY : 5/3/2010 – 5/10/2010 , 7 , -3.67%
21 : IEF : 4/26/2010 – 5/3/2010 , 7 , 0.43%
20 : SPY : 4/19/2010 – 4/26/2010 , 7 , 1.08%
19 : IEF : 4/5/2010 – 4/19/2010 , 14 , 1.44%
18 : SPY : 2/1/2010 – 4/5/2010 , 63 , 8.68%
17 : IEF : 12/7/2009 – 2/1/2010 , 56 , -1.51%
16 : SPY : 11/30/2009 – 12/7/2009 , 7 , 0.62%
15 : IEF : 11/16/2009 – 11/30/2009 , 14 , 1.20%
14 : SPY : 3/23/2009 – 11/16/2009 , 238 , 34.99%
13 : IEF : 4/28/2008 – 3/23/2009 , 329 , 8.26%
12 : SPY : 3/3/2008 – 4/28/2008 , 56 , 4.38%
11 : IEF : 12/3/2007 – 3/3/2008 , 91 , 2.78%
10 : SPY : 8/9/2004 – 12/3/2007 , 1211 , 35.48%
9 : IEF : 5/3/2004 – 8/9/2004 , 98 , 1.79%
8 : SPY : 3/31/2003 – 5/3/2004 , 399 , 32.08%
7 : IEF : 11/18/2002 – 3/31/2003 , 133 , 1.19%
6 : SPY : 9/3/2002 – 11/18/2002 , 76 , 2.29%
5 : IEF : 1/28/2002 – 9/3/2002 , 218 , 7.78%
4 : SPY : 10/22/2001 – 1/28/2002 , 98 , 3.80%
3 : IEF : 11/6/2000 – 10/22/2001 , 350 , 8.32%
2 : SPY : 4/17/2000 – 11/6/2000 , 203 , 1.95%
1 : IEF : 1/3/2000 – 4/17/2000 , 105 , 1.48%
Is the Combo5 performance YTD 2016 positive?
Exiting QLD this week was odd.
Combo5 performance YTD 2016 is positive. Please see Model Performance Tables.
On a 13 week basis none of the iM models including Combo5 are beating the S&P 500 total return. Am I reading this correctly?
In general, are out of sample results of iM models similar to back-tested? If there was only a small variation with back-tests it would be one thing, but no correlation to backtests is concerning, specially if it is the case with all the iM models.
Actually the Bestoga-3 and two of the USMV-Investor models produced higher returns over 13 weeks than SPY to 5-24-2016.
From Jan-2000 to May-2016 there were 65 periods of 13 weeks. The backtest of Combo-5 shows 13-wk negative active returns for 17 to 22 13-wk periods, depending from which date one starts. So one can expect about a quarter to a third of the 13-wk periods to show a negative active return.
For Combo-5 the historic maximum 13-wk negative active returns ranged from -5.43% to -21.82%. Thus the current 13-wk active return of this model is at the lower end of the historic active 13-wk negative returns.
Out-of-sample returns are usually lower than those shown from backtests. One has to also measure out-of-sample performance for a much longer period than 13 weeks to make a determination whether the o-o-s returns are correlated to the backtest returns, or not.
Thanks for clarifying Georg. I was also thinking that we need to be patient and see the out of sample returns over longer periods. I am confident that given the quality of your work and the inputs to the models that things will be fine moving forward.
By the way, I do have one observation that I made and wanted to get your take on this to see what you observed: Last week was the best week for the equity indices in all of 2016. All your indicators including on the market grader were saying we should be long equities, yet Combo5 had 0 (zero) exposure to equities. Can you please explain?
George, Why is QLD/IEF in cash instead of IEF?
can you give monthly returns on this portfolio going back to 12/31/07
Combo5 ETF models
Performance by Month
Start Date …. Model …. SPY …. Excess Return
01/01/2008 …. 0.021 …. -0.060 …. 8.153
02/01/2008 …. 0.001 …. -0.026 …. 2.703
03/03/2008 …. -0.010 …. -0.009 …. -0.083
04/01/2008 …. 0.039 …. 0.048 …. -0.817
05/01/2008 …. 0.023 …. 0.015 …. 0.838
06/02/2008 …. 0.041 …. -0.084 …. 12.409
07/01/2008 …. 0.004 …. -0.009 …. 1.304
08/01/2008 …. 0.005 …. 0.015 …. -1.010
09/02/2008 …. 0.032 …. -0.094 …. 12.641
10/01/2008 …. 0.057 …. -0.165 …. 22.180
11/03/2008 …. 0.055 …. -0.070 …. 12.473
12/01/2008 …. 0.132 …. 0.010 …. 12.252
01/02/2009 …. -0.057 …. -0.082 …. 2.506
02/02/2009 …. 0.057 …. -0.107 …. 16.431
03/02/2009 …. 0.007 …. 0.083 …. -7.657
04/01/2009 …. 0.068 …. 0.099 …. -3.128
05/01/2009 …. 0.055 …. 0.058 …. -0.343
06/01/2009 …. 0.034 …. -0.001 …. 3.427
07/01/2009 …. 0.096 …. 0.075 …. 2.107
08/03/2009 …. 0.044 …. 0.037 …. 0.688
09/01/2009 …. 0.060 …. 0.035 …. 2.455
10/01/2009 …. -0.033 …. -0.019 …. -1.333
11/02/2009 …. 0.074 …. 0.062 …. 1.233
12/01/2009 …. 0.019 …. 0.019 …. 0.036
01/04/2010 …. -0.006 …. -0.036 …. 2.986
02/01/2010 …. 0.051 …. 0.031 …. 1.975
03/01/2010 …. 0.096 …. 0.061 …. 3.481
04/01/2010 …. 0.041 …. 0.015 …. 2.547
05/03/2010 …. -0.031 …. -0.079 …. 4.831
06/01/2010 …. -0.024 …. -0.052 …. 2.787
07/01/2010 …. 0.048 …. 0.068 …. -2.056
08/02/2010 …. -0.062 …. -0.045 …. -1.726
09/01/2010 …. 0.093 …. 0.090 …. 0.352
10/01/2010 …. 0.043 …. 0.038 …. 0.511
11/01/2010 …. -0.022 …. 0.000 …. -2.168
12/01/2010 …. 0.079 …. 0.067 …. 1.266
01/03/2011 …. 0.028 …. 0.023 …. 0.511
02/01/2011 …. 0.046 …. 0.035 …. 1.104
03/01/2011 …. -0.002 …. 0.000 …. -0.245
04/01/2011 …. 0.040 …. 0.029 …. 1.082
05/02/2011 …. -0.003 …. -0.011 …. 0.848
06/01/2011 …. -0.030 …. -0.017 …. -1.342
07/01/2011 …. 0.001 …. -0.020 …. 2.125
08/01/2011 …. 0.002 …. -0.055 …. 5.738
09/01/2011 …. 0.015 …. -0.069 …. 8.475
10/03/2011 …. 0.087 …. 0.109 …. -2.217
11/01/2011 …. 0.014 …. -0.004 …. 1.803
12/01/2011 …. 0.006 …. 0.010 …. -0.453
01/03/2012 …. 0.046 …. 0.046 …. -0.056
02/01/2012 …. 0.046 …. 0.043 …. 0.245
03/01/2012 …. 0.057 …. 0.032 …. 2.478
04/02/2012 …. -0.017 …. -0.007 …. -1.004
05/01/2012 …. -0.035 …. -0.060 …. 2.498
06/01/2012 …. 0.039 …. 0.041 …. -0.142
07/02/2012 …. 0.026 …. 0.012 …. 1.456
08/01/2012 …. 0.041 …. 0.025 …. 1.622
09/04/2012 …. 0.028 …. 0.025 …. 0.220
10/01/2012 …. -0.025 …. -0.018 …. -0.665
11/01/2012 …. 0.011 …. 0.006 …. 0.488
12/03/2012 …. -0.004 …. 0.009 …. -1.327
01/02/2013 …. 0.058 …. 0.051 …. 0.664
02/01/2013 …. 0.010 …. 0.013 …. -0.258
03/01/2013 …. 0.053 …. 0.038 …. 1.482
04/01/2013 …. 0.022 …. 0.019 …. 0.320
05/01/2013 …. 0.013 …. 0.024 …. -1.076
06/03/2013 …. -0.026 …. -0.013 …. -1.309
07/01/2013 …. 0.082 …. 0.052 …. 3.036
08/01/2013 …. -0.025 …. -0.030 …. 0.479
09/03/2013 …. 0.039 …. 0.032 …. 0.710
10/01/2013 …. 0.054 …. 0.046 …. 0.734
11/01/2013 …. 0.036 …. 0.030 …. 0.679
12/02/2013 …. 0.029 …. 0.026 …. 0.306
01/02/2014 …. -0.018 …. -0.035 …. 1.722
02/03/2014 …. 0.058 …. 0.046 …. 1.203
03/03/2014 …. -0.011 …. 0.008 …. -1.960
04/01/2014 …. 0.009 …. 0.007 …. 0.232
05/01/2014 …. 0.041 …. 0.023 …. 1.789
06/02/2014 …. 0.031 …. 0.021 …. 0.991
07/01/2014 …. -0.004 …. -0.013 …. 0.956
08/01/2014 …. 0.056 …. 0.039 …. 1.616
09/02/2014 …. -0.014 …. -0.014 …. -0.020
10/01/2014 …. 0.036 …. 0.024 …. 1.210
11/03/2014 …. 0.044 …. 0.027 …. 1.676
12/01/2014 …. -0.032 …. -0.003 …. -2.979
01/02/2015 …. 0.006 …. -0.030 …. 3.528
02/02/2015 …. 0.039 …. 0.056 …. -1.724
03/02/2015 …. -0.024 …. -0.016 …. -0.864
04/01/2015 …. 0.011 …. 0.010 …. 0.162
05/01/2015 …. 0.024 …. 0.013 …. 1.139
06/01/2015 …. -0.011 …. -0.020 …. 0.927
07/01/2015 …. 0.027 …. 0.023 …. 0.421
08/03/2015 …. -0.002 …. -0.061 …. 5.889
09/01/2015 …. -0.010 …. -0.026 …. 1.531
10/01/2015 …. 0.058 …. 0.085 …. -2.715
11/02/2015 …. 0.003 …. 0.004 …. -0.108
12/01/2015 …. -0.005 …. -0.017 …. 1.216
01/04/2016 …. 0.013 …. -0.050 …. 6.268
02/01/2016 …. 0.018 …. -0.001 …. 1.933
03/01/2016 …. -0.002 …. 0.067 …. -6.963
04/01/2016 …. -0.013 …. 0.004 …. -1.714
05/02/2016 …. -0.003 …. 0.017 …. -1.989
06/01/2016 …. 0.012 …. 0.003 …. 0.815
07/01/2016 …. 0.001 …. 0.036 …. -3.579
08/01/2016 …. -0.004 …. 0.001 …. -0.541
09/01/2016 …. 0.000 …. 0.000 …. -0.052
10/03/2016 …. -0.010 …. -0.017 …. 0.750
11/01/2016 …. -0.010 …. 0.037 …. -4.715
12/01/2016 …. 0.016 …. 0.020 …. -0.452
01/03/2017 …. 0.016 …. 0.018 …. -0.204
02/01/2017 …. 0.038 …. 0.039 …. -0.121
03/01/2017 …. 0.005 …. 0.001 …. 0.372
04/03/2017 …. 0.024 …. 0.010 …. 1.408
05/01/2017 …. 0.031 …. 0.014 …. 1.692
06/01/2017 …. -0.017 …. 0.006 …. -2.365
07/03/2017 0.036 0.021 1.501
08/01/2017 0.015 0.003 1.254
09/01/2017 0.013 0.020 -0.678
10/02/2017 0.053 0.024 2.946
11/01/2017 0.034 0.031 0.339
12/01/2017 0.010 0.012 -0.193
01/02/2018 0.096 0.062 3.486
Would adding ETFs like EEM, EFA, Short Interest or country ETF’s improve the results?
Just to be clear Combo 3.r1 switches to SSO 9/4. Combo 5 remains in IEF?
Thanks
Combo5 also switches from IEF to SSO, all as per today’s email.
Hi.. can you please update the sector portion of this model to include the new Communication Services sector (XLC)? it’s a pretty big change. thanks
ETF (XLC) has now been included in the Best1(Sector SPDR).R1 model.
Thank you for reporting.
As of this week, Vanguard no longer will allow levered or inverse ETFs. Could you please provide results of this model with SPY (replacing SSO) and IEF (replacing SH)?
Combo5 with your suggested ETF replacement:
Number of Assets 5
Period 12/31/99 – 01/18/19
Last Rebalanced (Every Week) 01/14/19
Benchmark S&P 500 (SPY)
Quick Stats as of 1/18/2019
Total Return 1,346.95%
Benchmark Return 159.01%
Active Return 1,187.93%
Annualized Return 15.05%
Max Drawdown -13.19%
Benchmark Max Drawdown -55.19%
Sharpe Ratio 1.56
Correlation with S&P 500 (SPY) 0.55
For comparison with the performance shown for the period in the model description above:
Quick Stats as of 2/22/2016
Total Return 1,073.43%
Benchmark Return 78.43%
Active Return 995.00%
Annualized Return 16.46%
Max Drawdown -10.33%
Benchmark Max Drawdown -55.19%
Sharpe Ratio 1.73
Correlation with S&P 500 (SPY) 0.54
very helpful, thank you
Can you please post returns by year for 2016,2017 and 2018.
Hi, does this model sell ief and buy sso on Monday 4/1?
Please check today’s email in this regard.
Can anyone please provide the return for each year 2016,2017 & 2018 please.
model shows following calendar year returns:
2016… 1.57%
2017… 28.88%
2018 …-0.67%
2019YTD… 10.63 to 4/24/19
Hi Georg and Anton
Hey, would adding either the Tax Efficient Capital Strength or 6-Stock Capital Strength as the 6th component to the Combo 5 improve it’s performance and/or Max DD??
Many thanks
Vman
Adding the Tax Efficient Capital Strength as the 6th component to the Combo5
Number of Assets 6
Last Trades (6) 04/01/19
Period 12/31/99 – 05/02/19
Last Rebalanced (Every Week) 04/29/19
Benchmark S&P 500 (SPY)
Quick Stats as of 5/2/2019
Total Return 4,080.00%
Benchmark Return 184.29%
Active Return 3,895.71%
Annualized Return 21.28%
Max Drawdown -16.17%
Benchmark Max Drawdown -55.19%
Sharpe Ratio 1.81
Hi,
Would be possible to have Quick Stats updated for this model in order to make comparison with the above and with other models as well?
Thank you very much.
Hi Georg and Anton Can you updated the sharpe ratio and std dev for this model ? Thanks
Georg, could you give the relevant stats for the following book for the last 3 years and also from inception?
25% Combo5
25% Composite-(Gold-Stock-Bond)
25% 5ETF Trader (leveraged)
25% Ziv
Many thanks!
Georg any sharpe ratio update ?