
- At the end of August 2015 the 50-day moving average of the S&P500 crossed its 200-day moving average to the downside – the 33rd occurrence of a “Death Cross” since 1950.
- The performance of the S&P500 was investigated for periods ranging from one year before to two years after a Death Cross.
- During the last 65 years there were ten recessions. A Death Cross preceded six recessions and occurred early in four recessions.
- After a Death Cross the probability of S&P500 being lower than for any other point in time increases for periods from one- to eighteen months.
It is now about one month after the occurrence of a Death Cross (DC) of the S&P500 and the concurrent sell signal from our MAC-US system. The S&P500 is down by about 4% since then. We checked market performance after such events back to 1950 and found several market patterns of interest.
Analysis and Results
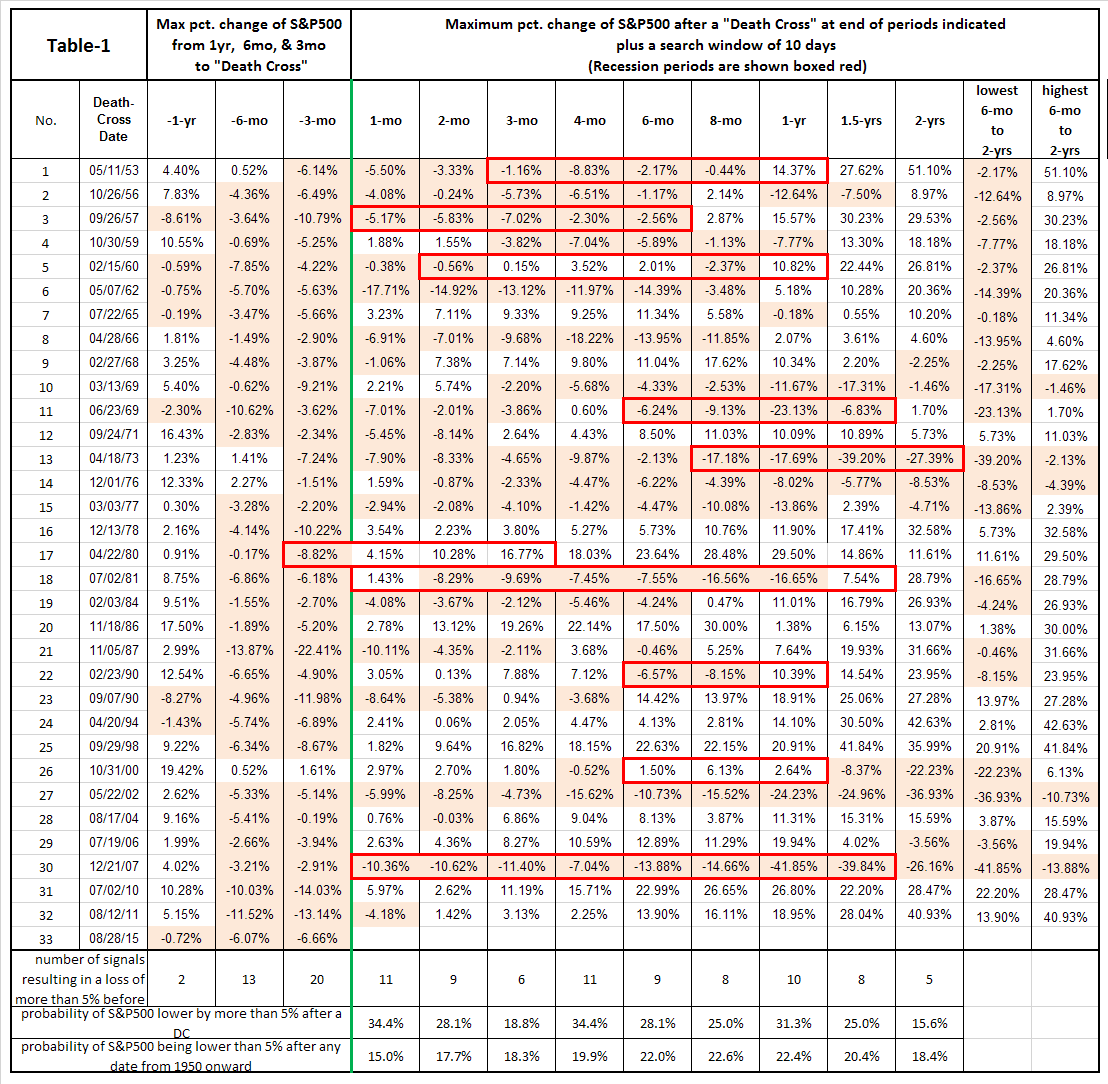
The data analyzed was from Jan-1950 to Sep-2015. After a DC the percentage change of the S&P500 was determined to the minimum value in a 10-day search window for various periods up to 2 years. Also for three periods prior to a DC the percentage change of the S&P500 was determined from the maximum value in a 10-day search window to the date of the DC.
The results of the analysis are shown in Table-1. Recessions periods are indicated with red borders.
Market performance prior to a Death Cross
- For 32 DC events, the S&P500 lost value over a 3-month period to the date of the DC, almost a 100% probability. The historic probability for the S&P500 to be lower after 3 months is only 44%.
- For 20 DC events, the S&P500 lost more than 5% over a 3-month period to the date of the DC, a 60% probability. The historic probability for the S&P500 to be more than 5% lower after 3 months is only 18%.
- For 29 DC events the S&P500 lost value over a 6-month period to the date of the DC, an 88% probability. The historic probability for the S&P500 to be lower after 6 months is only 37%.
- For 13 DC events the S&P500 lost more than 5% over a 6-month period to the date of the DC, a 39% probability. The historic probability for the S&P500 to be more than 5% lower after 6 months is only 22%.
Market losses after a Death Cross
- There were four occurrences when the S&P500 still showed losses of more than 20% two years after a DC. Those were from the DCs of 1973, 2000, 2002, and 2007.
- There were eight occurrences when the S&P500 still showed losses of more than 10% one year after a DC.
- There were twelve DC events when the S&P500 had no losses greater than 5% after any of the periods investigated.
Market gains after a Death Cross
- There were fourteen occurrences when the S&P500 had gains of more than 20% two years after a DC.
- There were three occurrences when the S&P500 had gains of more than 40% two years after a DC.
- If there were no losses 3-month and 4-month after a DC, then it would appear that it is fairly safe to be invested. There were fourteen such occurrences with a maximum loss of no more than 8% in the 6-month to 2-years periods after a DC.
Recessions
- There were ten recessions since 1950. Six recessions were preceded by a DC and for the other four the DC occurred at, or near the beginning of the recessions.
- There was never a recession without an associated DC.
Asset Allocation after a Death Cross
Based on past history of the performance of the S&P500 there is no need to panic. A Death Cross does not always result in major market losses, as can be seen from the analysis. However, it would appear that one should avoid being invested in the stock market during the first two months after a DC, as there were many losses during this period, whereas the historic maximum gain was only about 13% in this period after any of the 32 DCs.
It is prudent for asset allocation to be in accordance with prevailing market climate. More aggressive investments can be used during up-market periods, while more conservative investments are applicable during down-market periods. It would appear that good market timing models, such as our Market Climate Grader could provide guidance after Death Cross events.
Hi Georg
Interesting article and analysis. Thank you.
The Market Climate Grader signaled a rise from zone 3 (neutral/negative) to zone 1 (positive) on September 8th, 2015 – just 6 trading days after the Death Cross occurred on August 28th. Conflicted a bit here on how to use these signals as I’m currently in cash but want to try and optimize timing to get back in market.
Can you suggest how to proceed when these signals are in conflict??
Does the Death Cross always take precedence over any other signals?
Should the Market Climate Grader be made ‘faster’?
Many thanks……..
Vman
If all our timing models would produce the same signals, then there really would only be one model. You are correct, the Grader moved from zone-3 to zone-1 on 9/8/2015 but then moved down to zone-2 on 9/14/2015. This means that for a Stock-Cash model, the Grader indicates holding cash now. Members with a Gold subscription were informed of the zone shift by email when the signal occurred.
Nobody knows the future performance of the S&P500. One should also take note of the current high level of Shiller’s CAPE ratio (which is now at 24.5, way above its historical average of 17) when deciding whether to invest in the stock market or not.
Hi, Georg, the signals I have received for Market Climate Grader show VTI for the past several weeks. Am I missing something?
Marv
Allocation is for zone-2.
Basic & Conservative models hold VTI.
George
Can you comment on the BCI recession indicators over the same period and its timing relative to the DC.
Background: the change from week to week on the MAC-US model was too quick to avoid the majority of the hit from the August correction. Now the trick for everyone to decide is, was it a correction (and therefore an opportunity) or the beginning of something worse. BCI says hang in there.
So does the DC trump even the recession indicators historically?
BCI, COMP, and other recession indicators we follow are not signalling a recession. All previous recession from 1967 on would have been recognized by our indicators, with or without a DC.
The most recent DC is not associated with a recession warning from our indicators. However, one should not forget that the Shiller CAPE ratio does signal an overvalued market now.
Hi Georg,
Can you clarify…
In your response to vman you said, “You are correct, the Grader moved from zone-3 to zone-1 on 9/8/2015 but then moved down to zone-2 on 9/14/2015. This means that for a Stock-Cash model, the Grader indicates holding cash now.”
But when I check the write-up on the Grader, I see that for zone 2 all three models (basic, conservative and aggressive) are in the stock market holding VTI or SPY. Not cash. Did I miss something?
None of our 3 standard models are Stock-Cash models. A Stock-Cash model would have stocks only allocated to Zone-1 (PPP) and Cash in the other three zones.