
  |
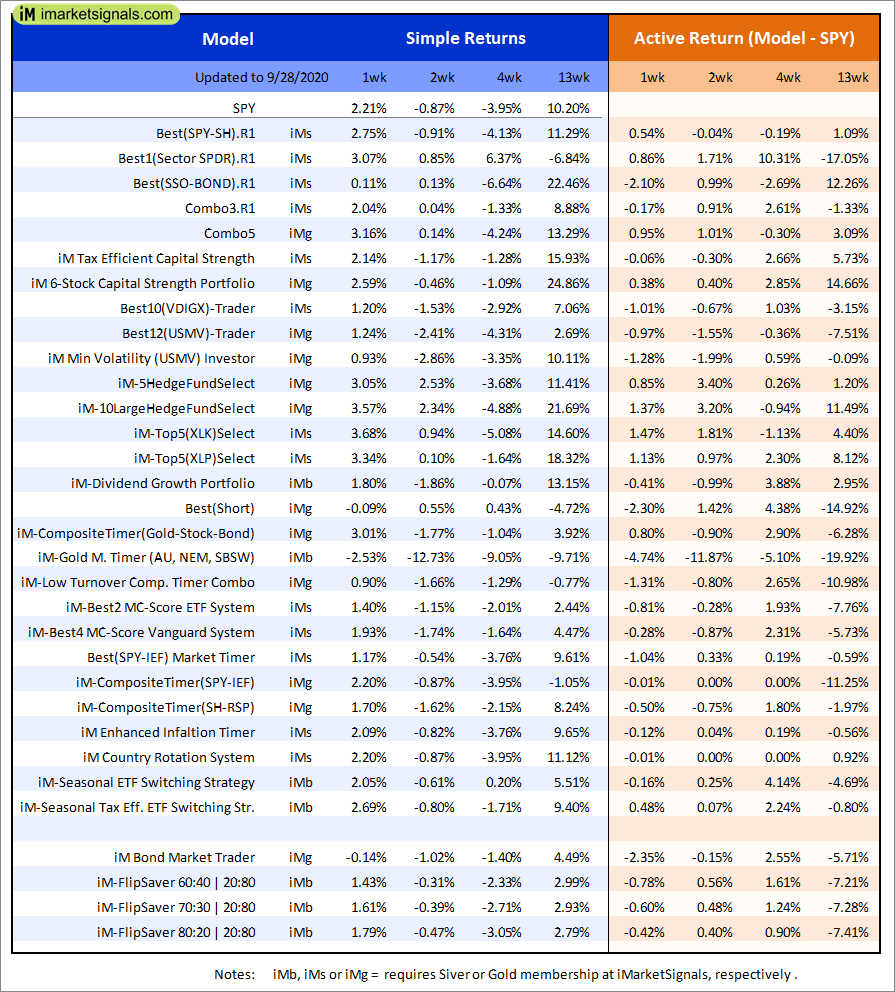
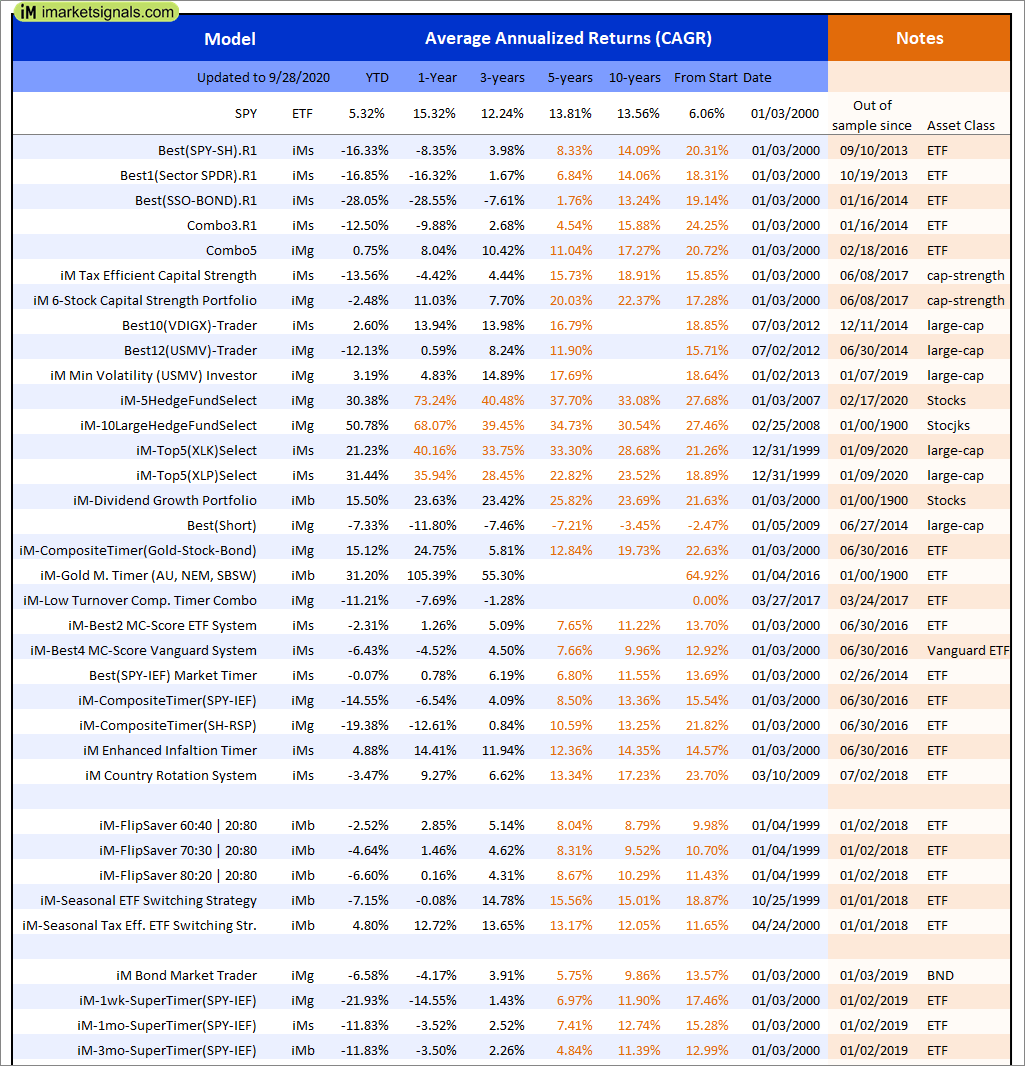
Out of sample performance summary of our models for the past 1, 2, 4 and 13 week periods. The active active return indicates how the models over- or underperformed the benchmark ETF SPY. Also the YTD, and the 1-, 3-, 5- and 10-year annualized returns are shown in the second table |
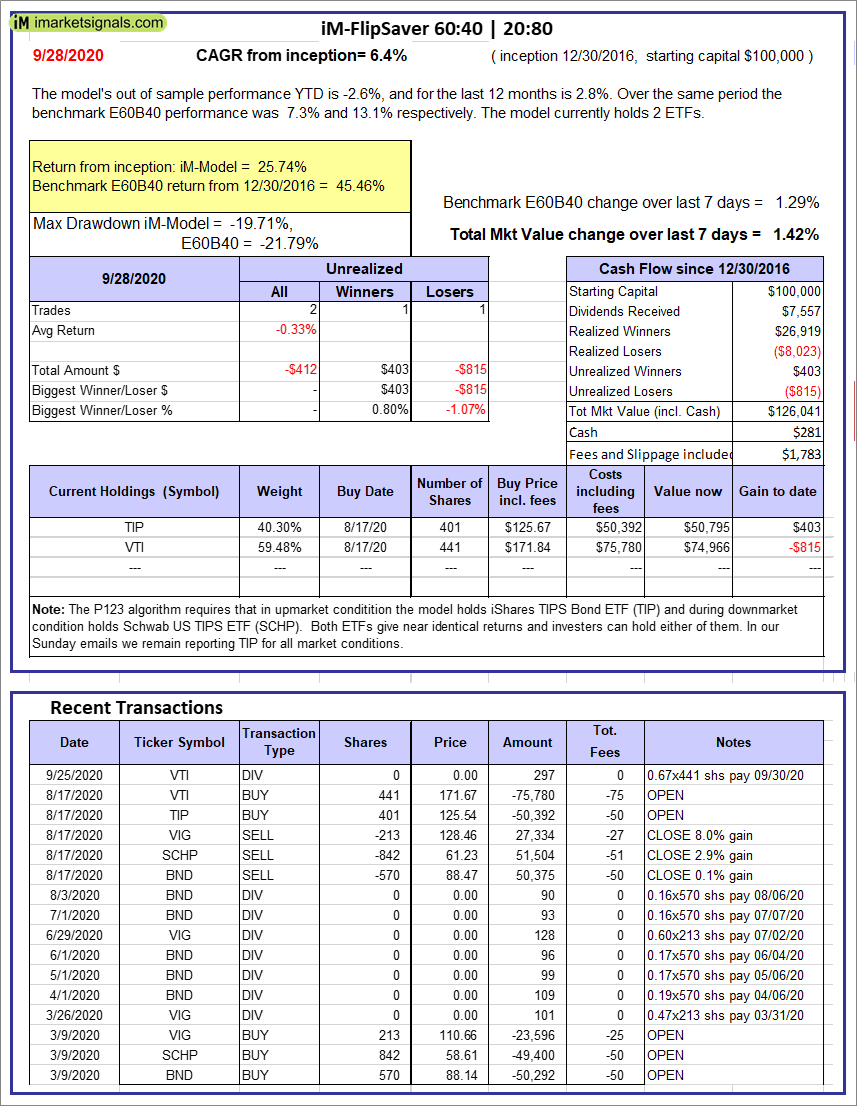 |
iM-FlipSaver 60:40 | 20:80 – 2017: The model’s out of sample performance YTD is -2.6%, and for the last 12 months is 2.8%. Over the same period the benchmark E60B40 performance was 7.3% and 13.1% respectively. Over the previous week the market value of iM-FlipSaver 80:20 | 20:80 gained 1.42% at a time when SPY gained 1.29%. A starting capital of $100,000 at inception on 7/16/2015 would have grown to $126,041 which includes $281 cash and excludes $1,783 spent on fees and slippage. |
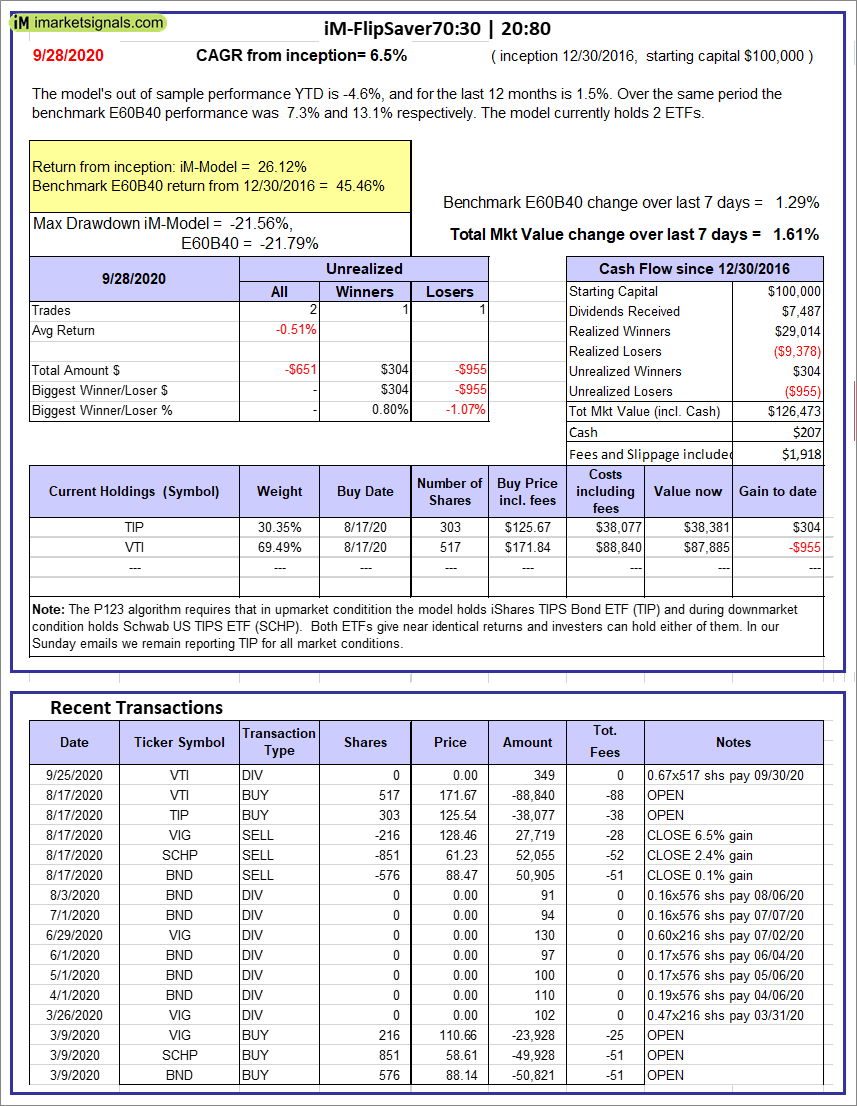 |
iM-FlipSaver 70:30 | 20:80 – 2017: The model’s out of sample performance YTD is -4.6%, and for the last 12 months is 1.5%. Over the same period the benchmark E60B40 performance was 7.3% and 13.1% respectively. Over the previous week the market value of iM-FlipSaver 70:30 | 20:80 gained 1.61% at a time when SPY gained 1.29%. A starting capital of $100,000 at inception on 7/15/2015 would have grown to $126,473 which includes $207 cash and excludes $1,918 spent on fees and slippage. |
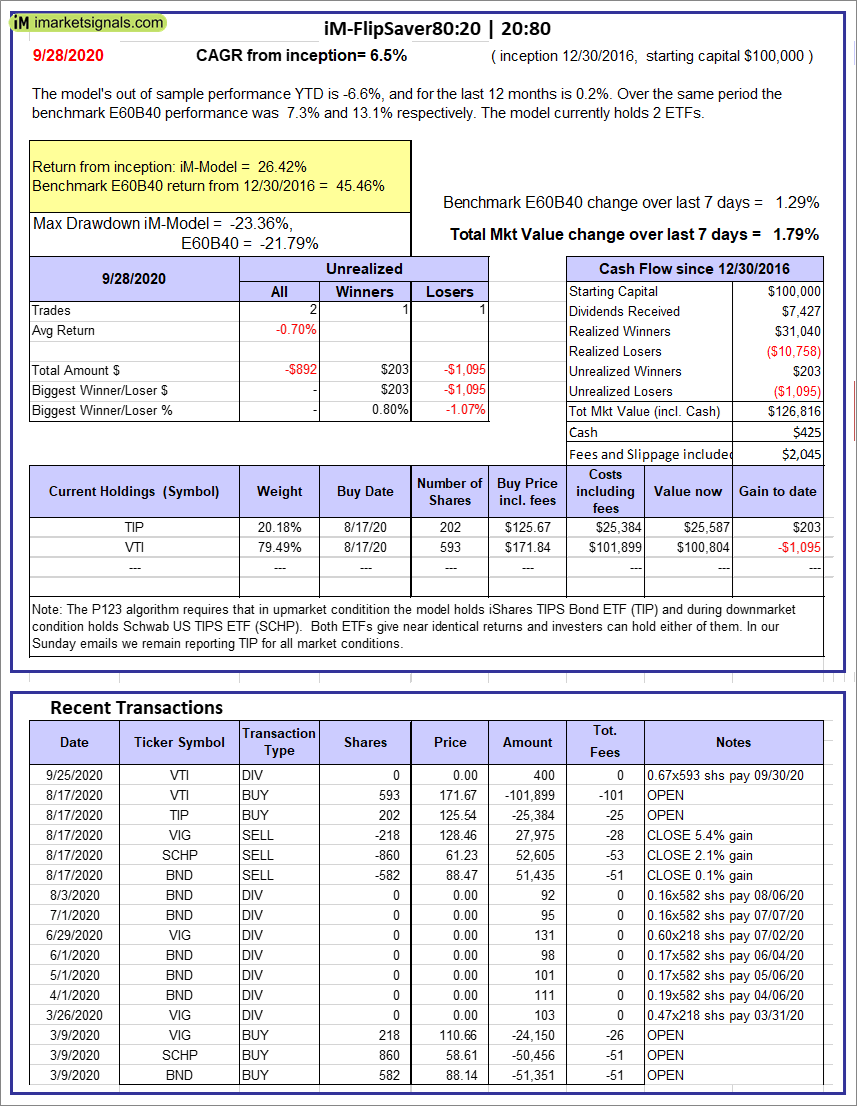 |
iM-FlipSaver 80:20 | 20:80 – 2017: The model’s out of sample performance YTD is -6.6%, and for the last 12 months is 0.2%. Over the same period the benchmark E60B40 performance was 7.3% and 13.1% respectively. Over the previous week the market value of iM-FlipSaver 80:20 | 20:80 gained 1.79% at a time when SPY gained 1.29%. A starting capital of $100,000 at inception on 1/2/2017 would have grown to $126,816 which includes $425 cash and excludes $2,045 spent on fees and slippage. |
  |
iM-5HedgeFundSelect: Since inception, on 1/5/2016, the model gained 338.00% while the benchmark SPY gained 79.78% over the same period. Over the previous week the market value of iM-5HedgeFundSelect gained 3.06% at a time when SPY gained 2.21%. A starting capital of $25,000 at inception on 1/5/2016 would have grown to $109,500 which includes $7,468 cash and excludes $1,082 spent on fees and slippage. |
 |
iM-10LargeHedgeFundSelect: Since inception, on 1/5/2016, the model gained 313.59% while the benchmark SPY gained 79.78% over the same period. Over the previous week the market value of iM-10LargeHedgeFundSelect gained 3.57% at a time when SPY gained 2.21%. A starting capital of $25,000 at inception on 1/5/2016 would have grown to $103,397 which includes $490 cash and excludes $667 spent on fees and slippage. |
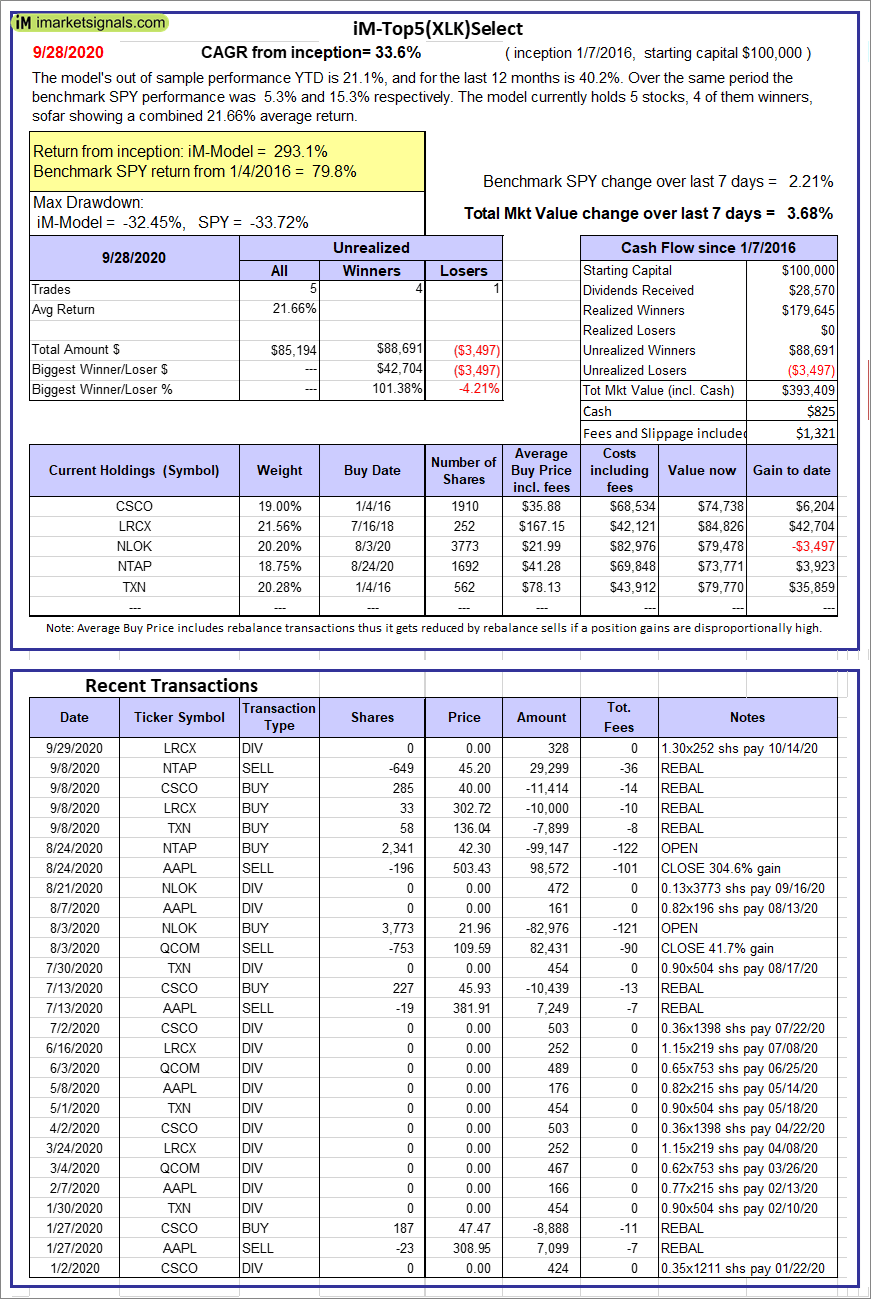 |
iM-Top5(XLK)Select: Since inception, on 1/8/2016, the model gained 293.08% while the benchmark SPY gained 79.78% over the same period. Over the previous week the market value of iM-Top5(XLK)Select gained 3.68% at a time when SPY gained 2.21%. A starting capital of $100,000 at inception on 1/8/2016 would have grown to $393,409 which includes $825 cash and excludes $1,321 spent on fees and slippage. |
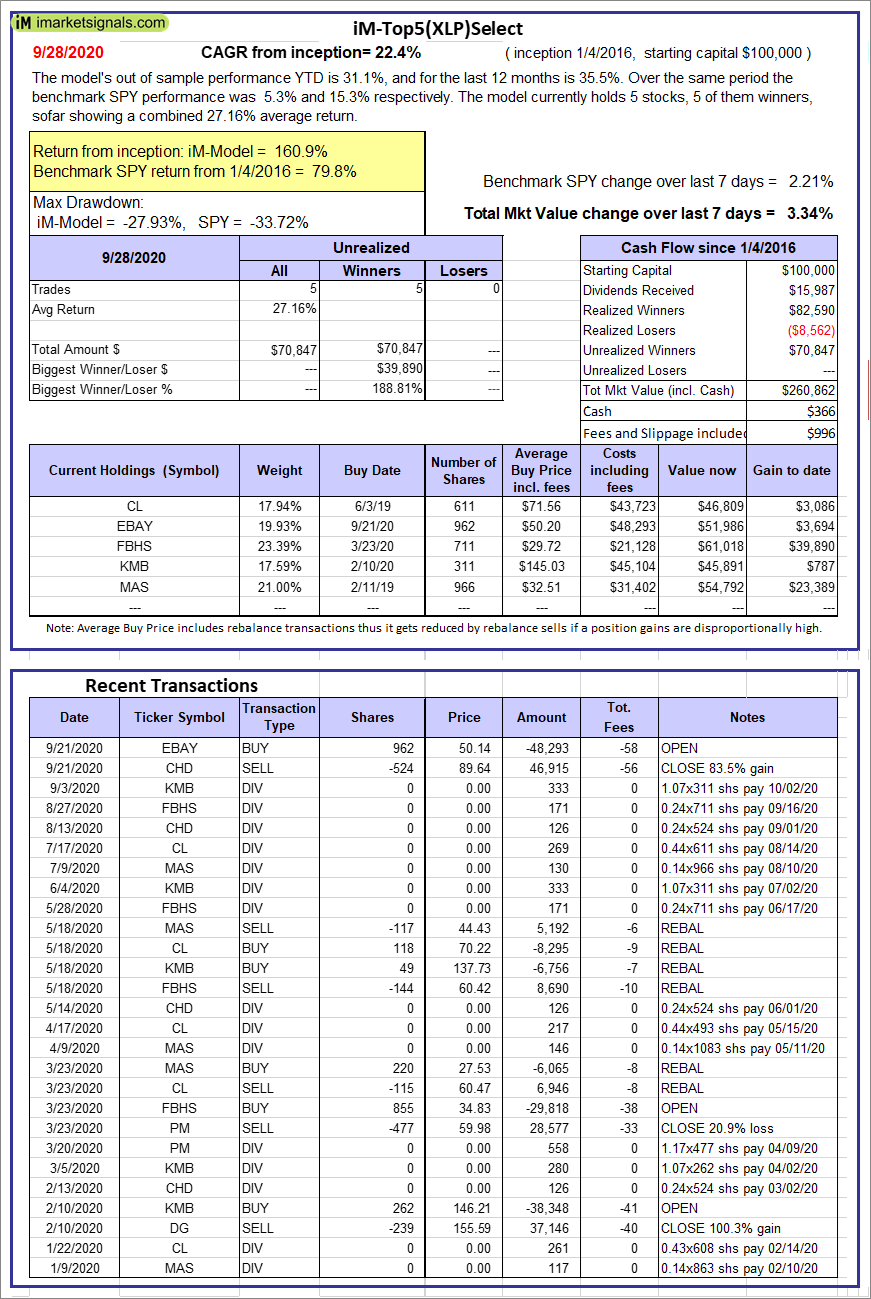 |
iM-Top5(XLP)Select: Since inception, on 1/5/2016, the model gained 160.86% while the benchmark SPY gained 79.78% over the same period. Over the previous week the market value of iM-Top5(XLP)Select gained 3.34% at a time when SPY gained 2.21%. A starting capital of $100,000 at inception on 1/5/2016 would have grown to $260,862 which includes $366 cash and excludes $996 spent on fees and slippage. |
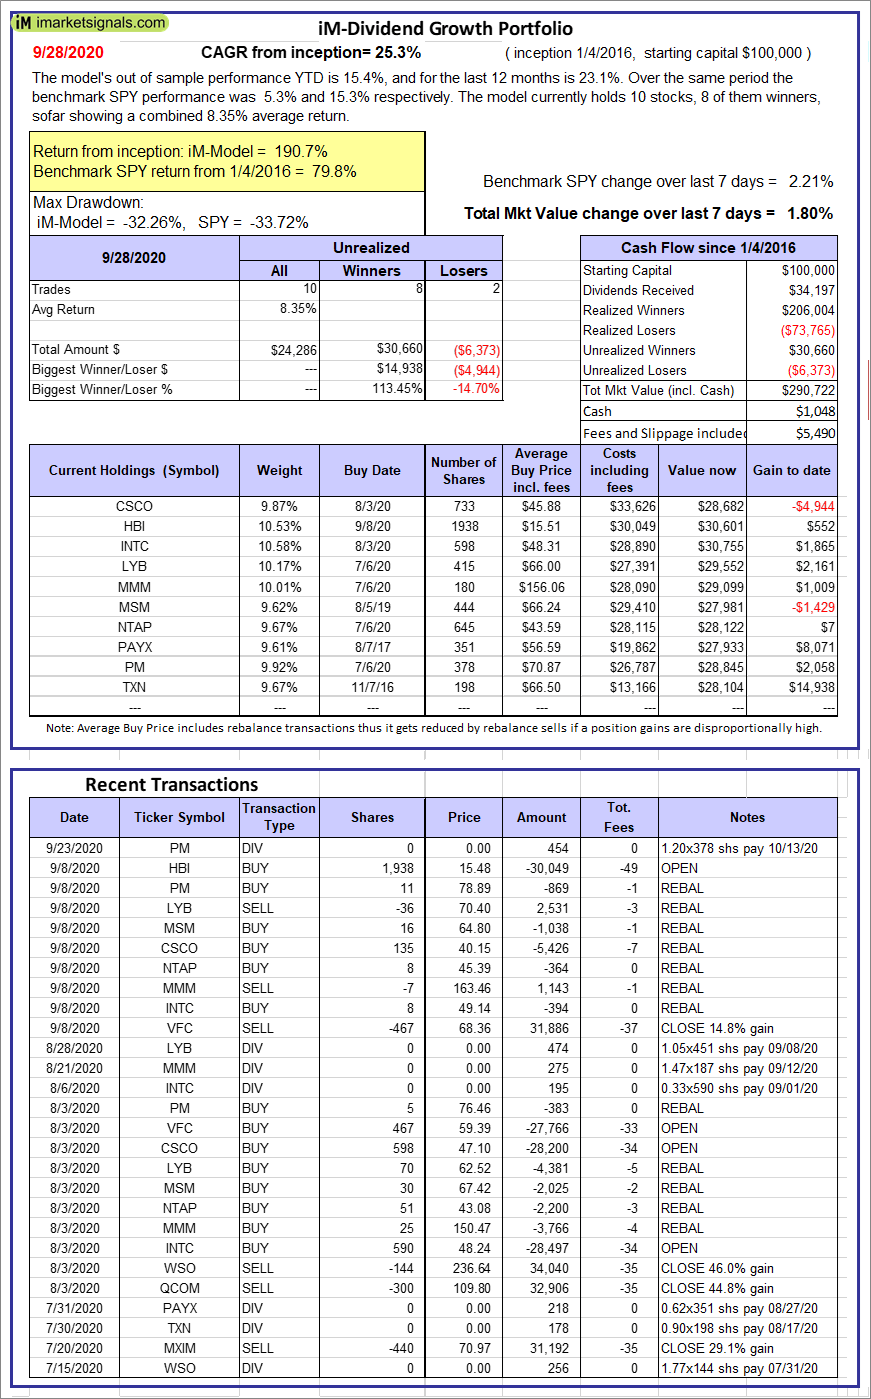 |
iM-Dividend Growth Portfolio: The model’s out of sample performance YTD is 15.4%, and for the last 12 months is 23.1%. Over the same period the benchmark SPY performance was 5.3% and 15.3% respectively. Over the previous week the market value of the iM-Dividend Growth Portfolio gained 1.80% at a time when SPY gained 2.21%. A starting capital of $100,000 at inception on 6/30/2016 would have grown to $290,722 which includes $1,048 cash and excludes $5,490 spent on fees and slippage. |
 |
iM-Gold Momentum Timer (AU, NEM, SBSW): The model’s out of sample performance YTD is 31.2%, and for the last 12 months is 105.4%. Over the same period the benchmark SPY performance was 5.3% and 15.3% respectively. Over the previous week the market value of iM-Gold Momentum Timer (AU, NEM, SBSW) gained -2.53% at a time when SPY gained 2.21%. A starting capital of $100,000 at inception on 6/30/2016 would have grown to -$51,349 which includes $62,725 cash and excludes Gain to date spent on fees and slippage. |
 |
iM-Best(SPY-SH).R1: The model’s out of sample performance YTD is -16.7%, and for the last 12 months is -8.8%. Over the same period the benchmark SPY performance was 5.3% and 15.3% respectively. Over the previous week the market value of Best(SPY-SH) gained 2.31% at a time when SPY gained 2.21%. A starting capital of $100,000 at inception on 1/2/2009 would have grown to $590,122 which includes -$26,793 cash and excludes $25,091 spent on fees and slippage. |
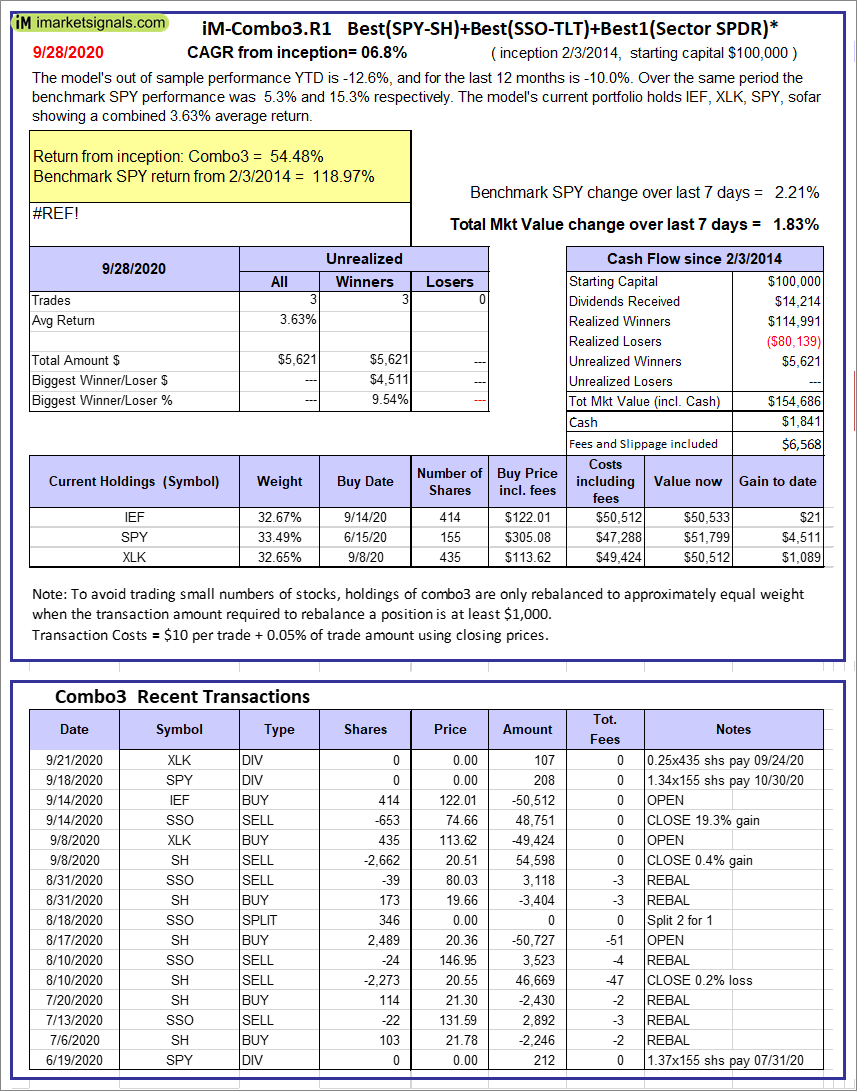 |
iM-Combo3.R1: The model’s out of sample performance YTD is -12.6%, and for the last 12 months is -10.0%. Over the same period the benchmark SPY performance was 5.3% and 15.3% respectively. Over the previous week the market value of iM-Combo3.R1 gained 1.83% at a time when SPY gained 2.21%. A starting capital of $100,000 at inception on 2/3/2014 would have grown to $154,686 which includes $1,841 cash and excludes $6,568 spent on fees and slippage. |
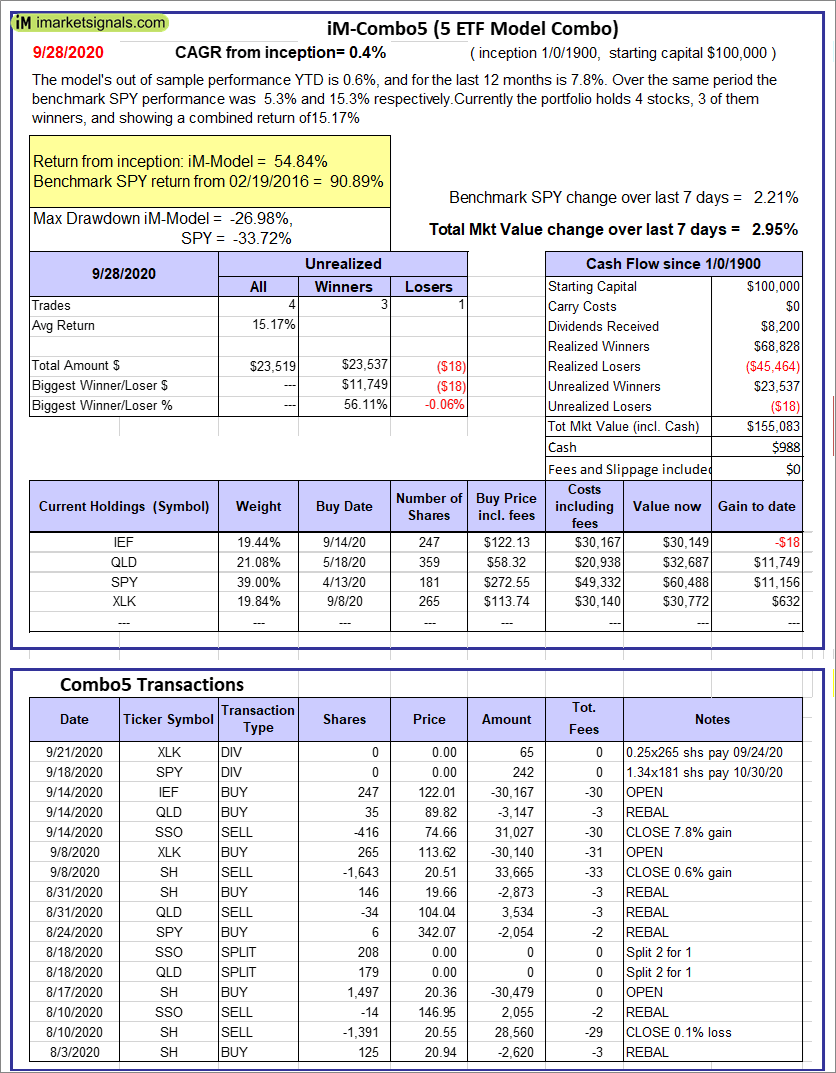 |
iM-Combo5: The model’s out of sample performance YTD is 0.6%, and for the last 12 months is 7.8%. Over the same period the benchmark SPY performance was 5.3% and 15.3% respectively. Over the previous week the market value of iM-Combo5 gained 2.95% at a time when SPY gained 2.21%. A starting capital of $100,000 at inception on 2/22/2016 would have grown to $155,083 which includes $988 cash and excludes $0 spent on fees and slippage. |
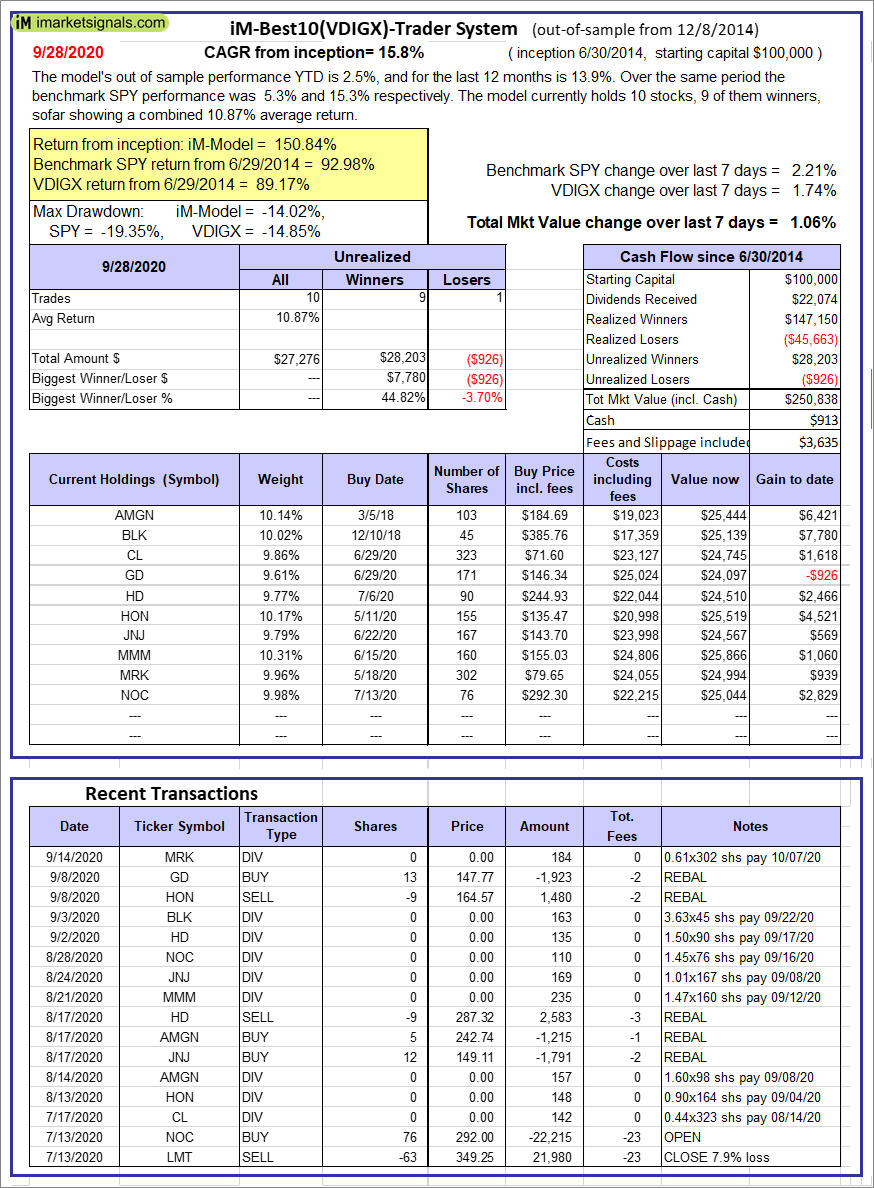 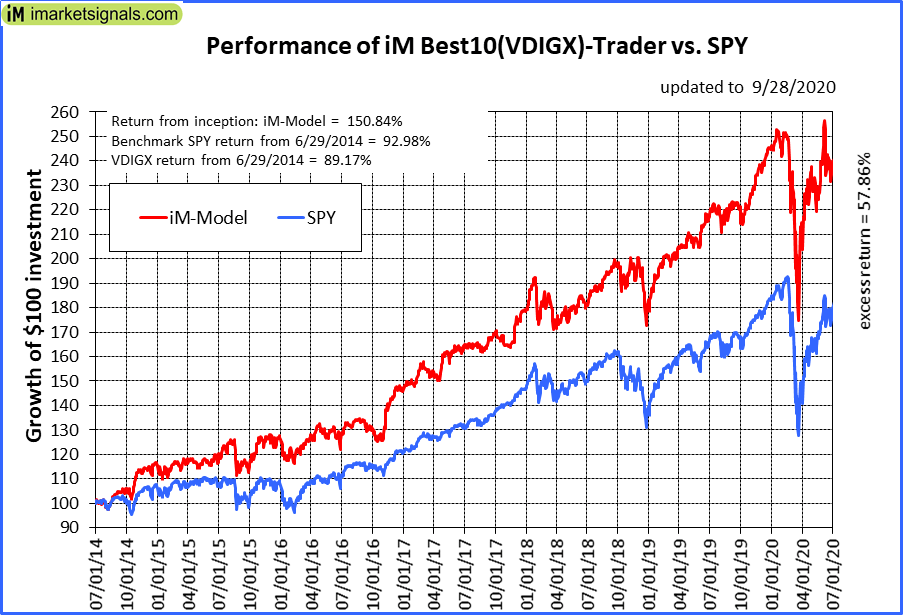 |
iM-Best10(VDIGX)-Trader: The model’s out of sample performance YTD is 2.5%, and for the last 12 months is 13.9%. Over the same period the benchmark SPY performance was 5.3% and 15.3% respectively. Since inception, on 7/1/2014, the model gained 150.84% while the benchmark SPY gained 92.98% and VDIGX gained 89.17% over the same period. Over the previous week the market value of iM-Best10(VDIGX) gained 1.06% at a time when SPY gained 2.21%. A starting capital of $100,000 at inception on 7/1/2014 would have grown to $250,838 which includes $913 cash and excludes $3,635 spent on fees and slippage. |
 |
iM 6-Stock Capital Strength Portfolio: The model’s out of sample performance YTD is -2.7%, and for the last 12 months is 10.7%. Over the same period the benchmark SPY performance was 5.3% and 15.3% respectively. Over the previous week the market value of the iM 6-Stock Capital Strength Portfolio gained 2.13% at a time when SPY gained 2.21%. A starting capital of $100,000 at inception on 10/28/2016 would have grown to $172,788 which includes $1,905 cash and excludes $1,396 spent on fees and slippage. |
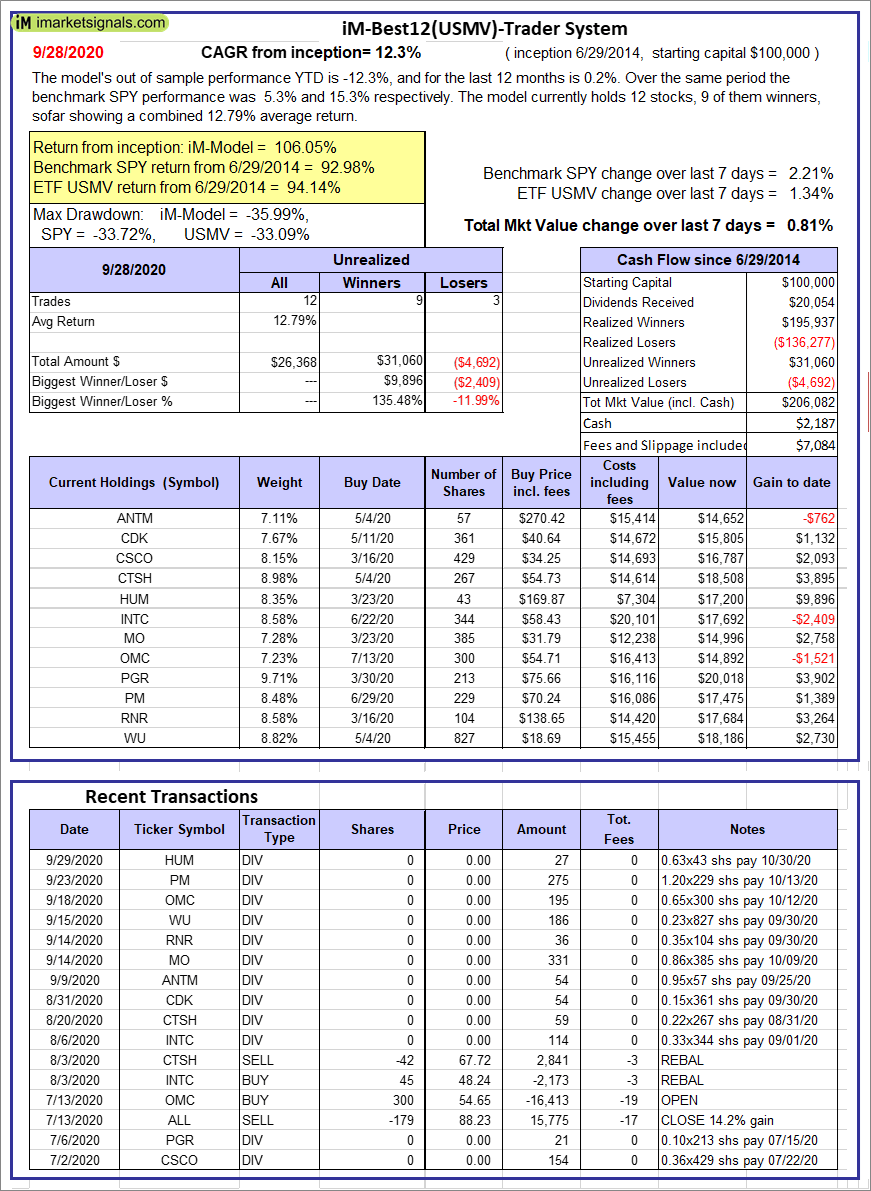 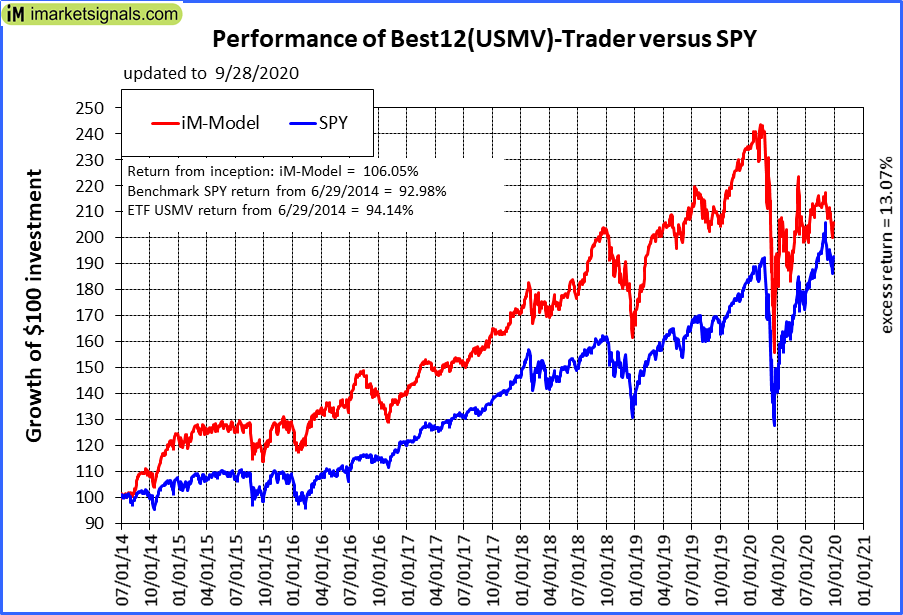 |
iM-Best12(USMV)-Trader: The model’s out of sample performance YTD is -12.3%, and for the last 12 months is 0.2%. Over the same period the benchmark SPY performance was 5.3% and 15.3% respectively. Since inception, on 6/30/2014, the model gained 106.05% while the benchmark SPY gained 92.98% and the ETF USMV gained 94.14% over the same period. Over the previous week the market value of iM-Best12(USMV)-Trader gained 0.81% at a time when SPY gained 2.21%. A starting capital of $100,000 at inception on 6/30/2014 would have grown to $206,082 which includes $2,187 cash and excludes $7,084 spent on fees and slippage. |
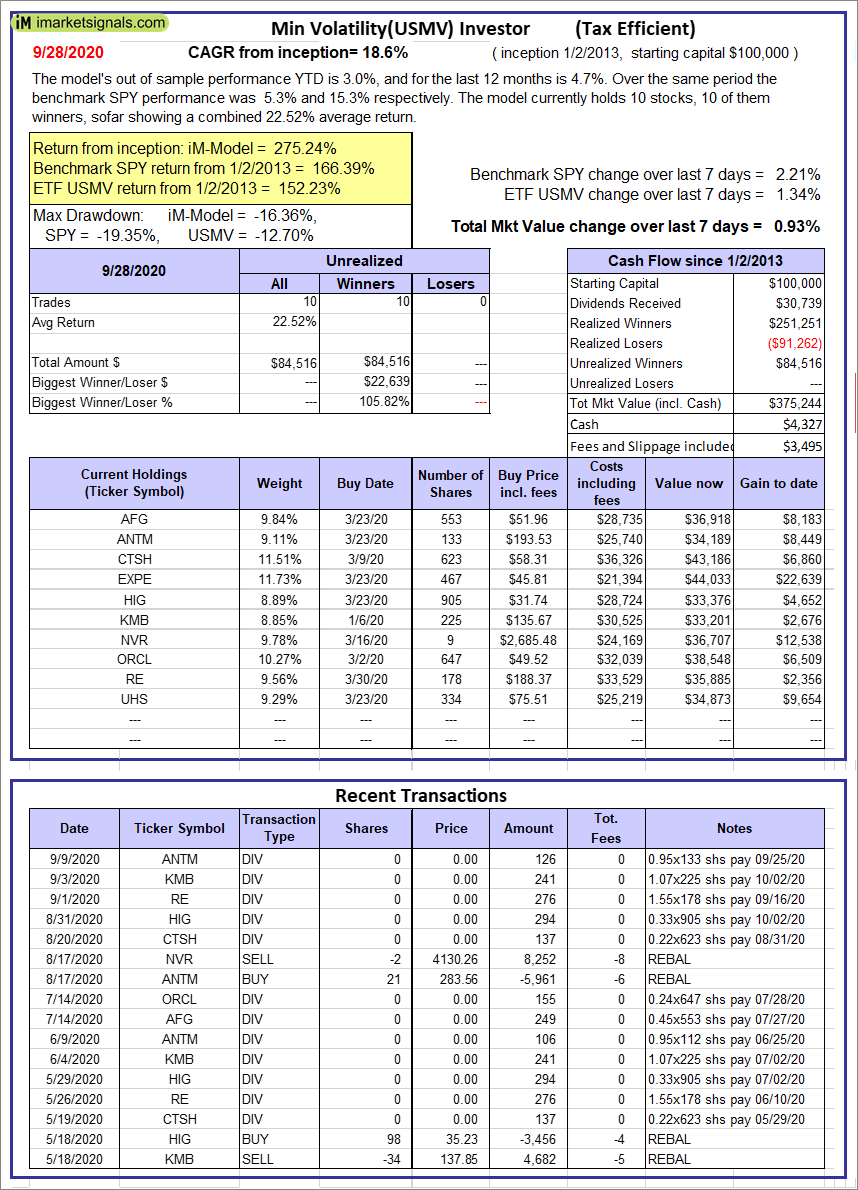 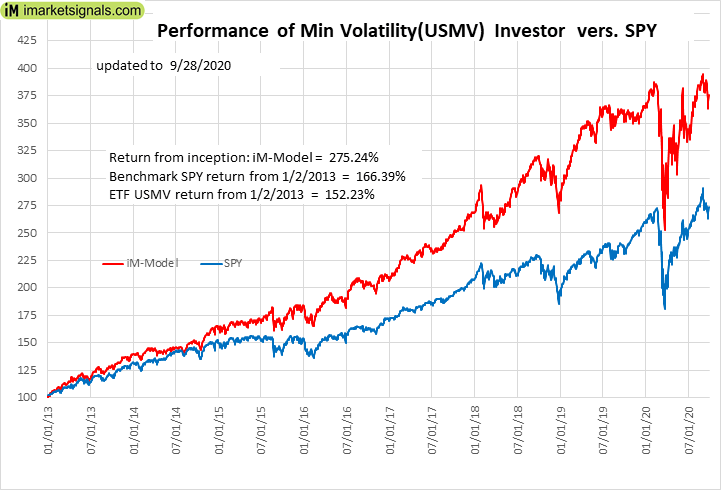 |
iM-Min Volatility(USMV) Investor (Tax Efficient): The model’s out of sample performance YTD is 3.0%, and for the last 12 months is 4.7%. Over the same period the benchmark SPY performance was 5.3% and 15.3% respectively. Since inception, on 1/3/2013, the model gained 275.24% while the benchmark SPY gained 166.39% and the ETF USMV gained 152.23% over the same period. Over the previous week the market value of iM-Best12(USMV)Q1 gained 0.93% at a time when SPY gained 2.21%. A starting capital of $100,000 at inception on 1/3/2013 would have grown to $375,244 which includes $4,327 cash and excludes $3,495 spent on fees and slippage. |
 |
iM-Bond Market Trader (High-Yield Bond or 10-yr Treasury Bond): The model’s out of sample performance YTD is -36.6%, and for the last 12 months is -32.3%. Over the same period the benchmark SPY performance was 3.0% and 11.7% respectively. Over the previous week the market value of the iM-Bond Market Trader (High-Yield Bond or 10-yr Treasury Bond) gained -0.14% at a time when BND gained -0.10%. A starting capital of $100,000 at inception on 10/30/2016 would have grown to $140,055 which includes $1,712 cash and excludes $2,087 spent on fees and slippage. |
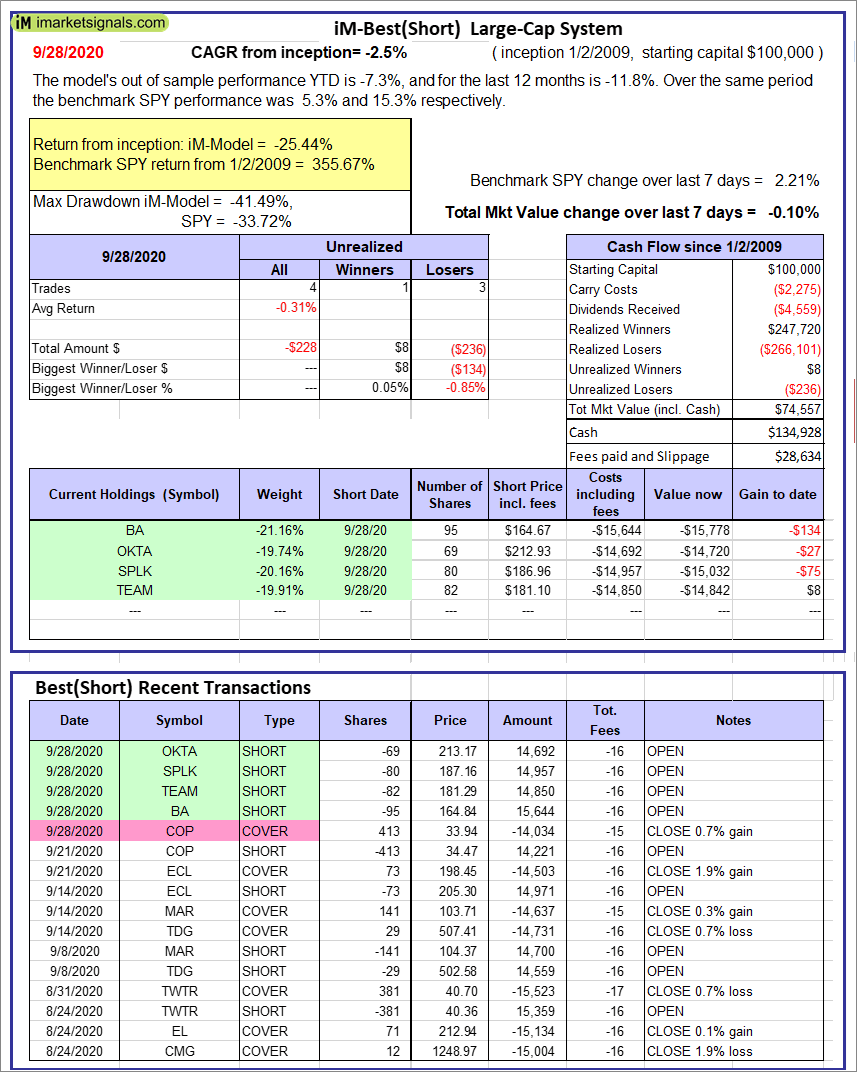 |
iM-Best(Short): The model’s out of sample performance YTD is -7.3%, and for the last 12 months is -11.8%. Over the same period the benchmark SPY performance was 5.3% and 15.3% respectively. Over the previous week the market value of iM-Best(Short) gained -0.10% at a time when SPY gained 2.21%. Over the period 1/2/2009 to 9/28/2020 the starting capital of $100,000 would have grown to $74,557 which includes $134,928 cash and excludes $28,634 spent on fees and slippage. |
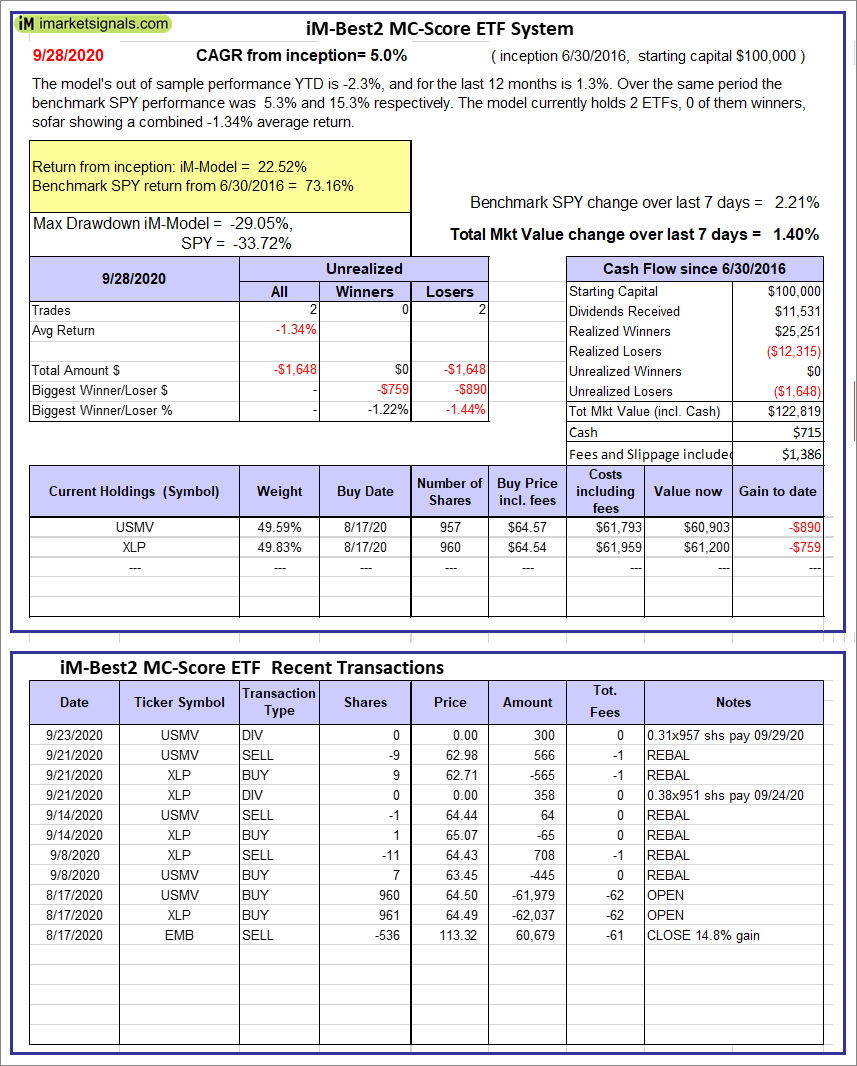 |
iM-Best2 MC-Score ETF System: The model’s out of sample performance YTD is -2.3%, and for the last 12 months is 1.3%. Over the same period the benchmark SPY performance was 5.3% and 15.3% respectively. Over the previous week the market value of the iM-Best2 MC-Score ETF System gained 1.40% at a time when SPY gained 2.21%. A starting capital of $100,000 at inception on 6/30/2016 would have grown to $122,819 which includes $715 cash and excludes $1,386 spent on fees and slippage. |
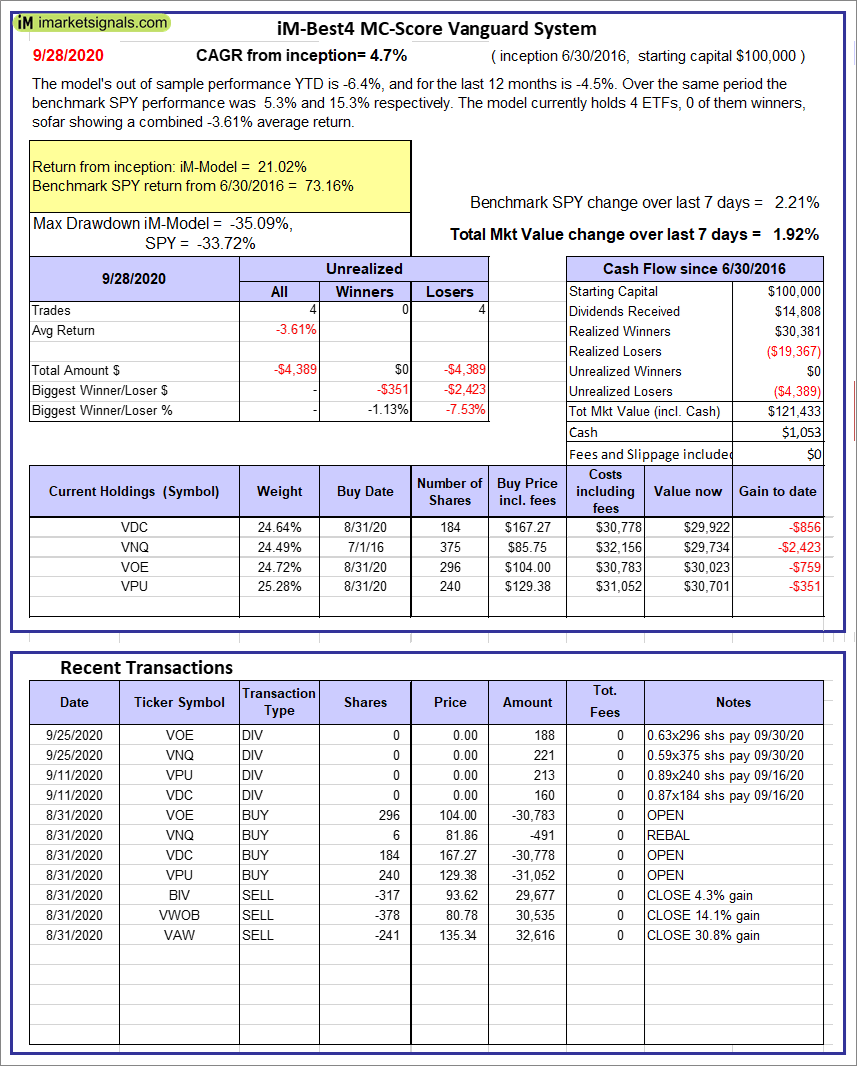 |
iM-Best4 MC-Score Vanguard System: The model’s out of sample performance YTD is -6.4%, and for the last 12 months is -4.5%. Over the same period the benchmark SPY performance was 5.3% and 15.3% respectively. Over the previous week the market value of the iM-Best4 MC-Score Vanguard System gained 1.92% at a time when SPY gained 2.21%. A starting capital of $100,000 at inception on 6/30/2016 would have grown to $121,433 which includes $1,053 cash and excludes $00 spent on fees and slippage. |
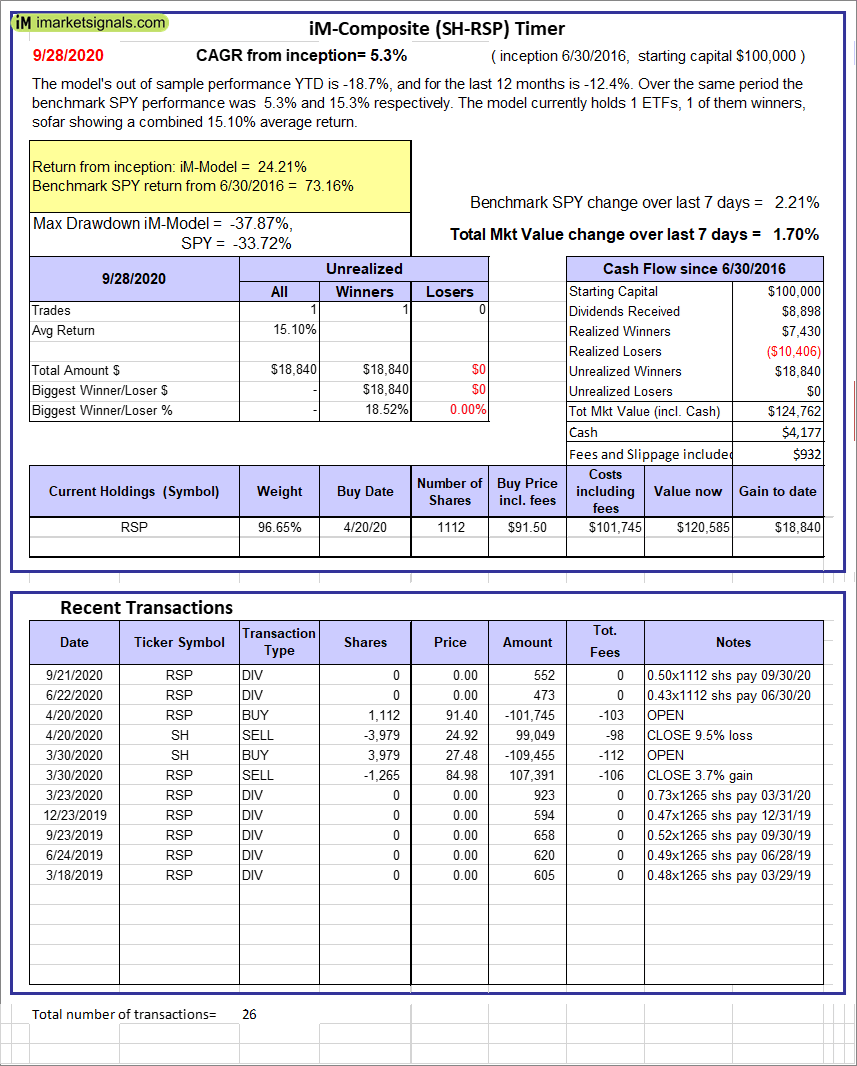 |
iM-Composite (SH-RSP) Timer: The model’s out of sample performance YTD is -18.7%, and for the last 12 months is -12.4%. Over the same period the benchmark SPY performance was 5.3% and 15.3% respectively. Over the previous week the market value of the iM-Composite (SH-RSP) Timer gained 1.70% at a time when SPY gained 2.21%. A starting capital of $100,000 at inception on 6/30/2016 would have grown to $124,762 which includes $4,177 cash and excludes $932 spent on fees and slippage. |
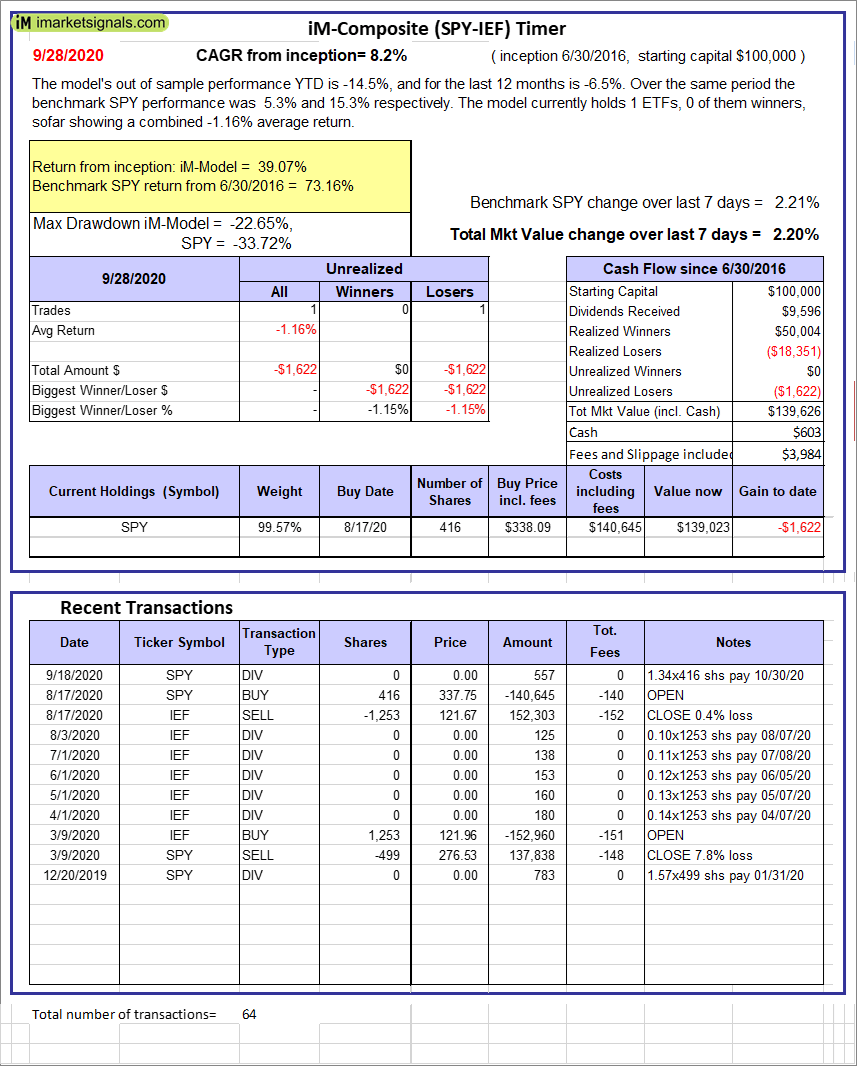 |
iM-Composite (SPY-IEF) Timer: The model’s out of sample performance YTD is -14.5%, and for the last 12 months is -6.5%. Over the same period the benchmark SPY performance was 5.3% and 15.3% respectively. Over the previous week the market value of the iM-Composite (SPY-IEF) Timer gained 2.20% at a time when SPY gained 2.21%. A starting capital of $100,000 at inception on 6/30/2016 would have grown to $139,626 which includes $603 cash and excludes $3,984 spent on fees and slippage. |
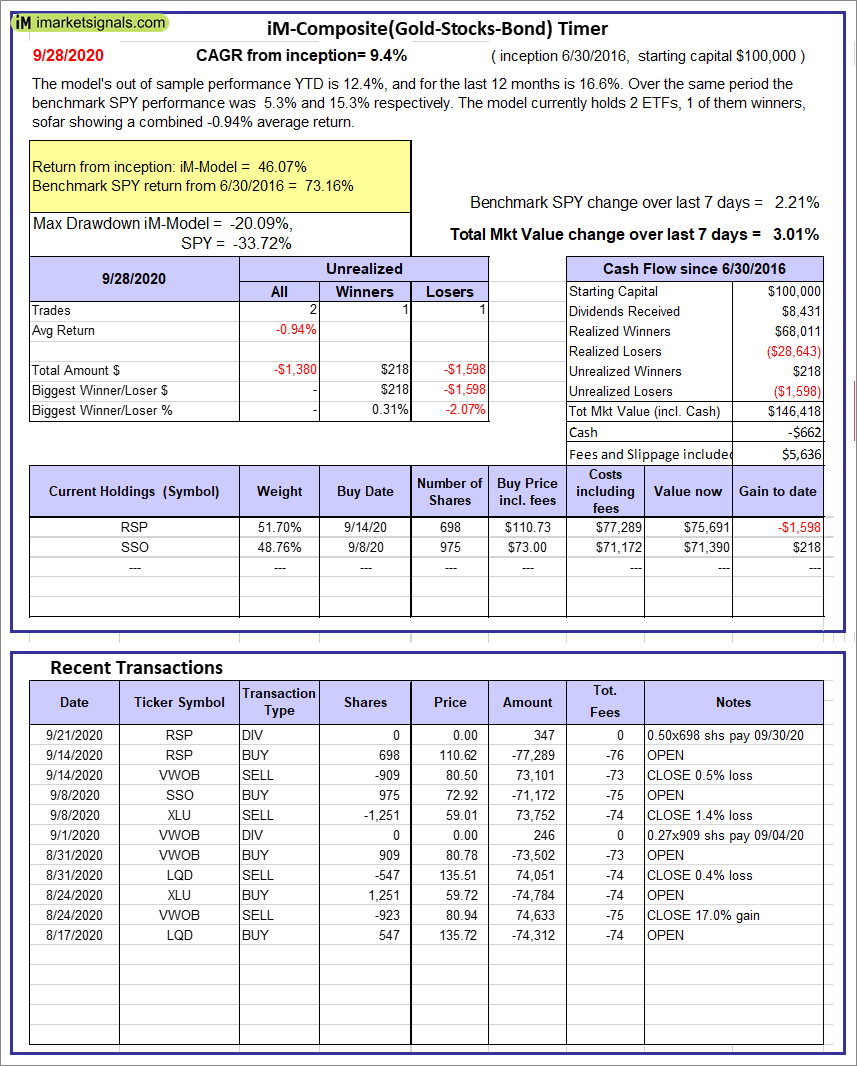 |
iM-Composite(Gold-Stocks-Bond) Timer: The model’s out of sample performance YTD is 12.4%, and for the last 12 months is 16.6%. Over the same period the benchmark SPY performance was 5.3% and 15.3% respectively. Over the previous week the market value of the iM-Composite(Gold-Stocks-Bond) Timer gained 3.01% at a time when SPY gained 2.21%. A starting capital of $100,000 at inception on 6/30/2016 would have grown to $146,418 which includes -$662 cash and excludes $5,636 spent on fees and slippage. |
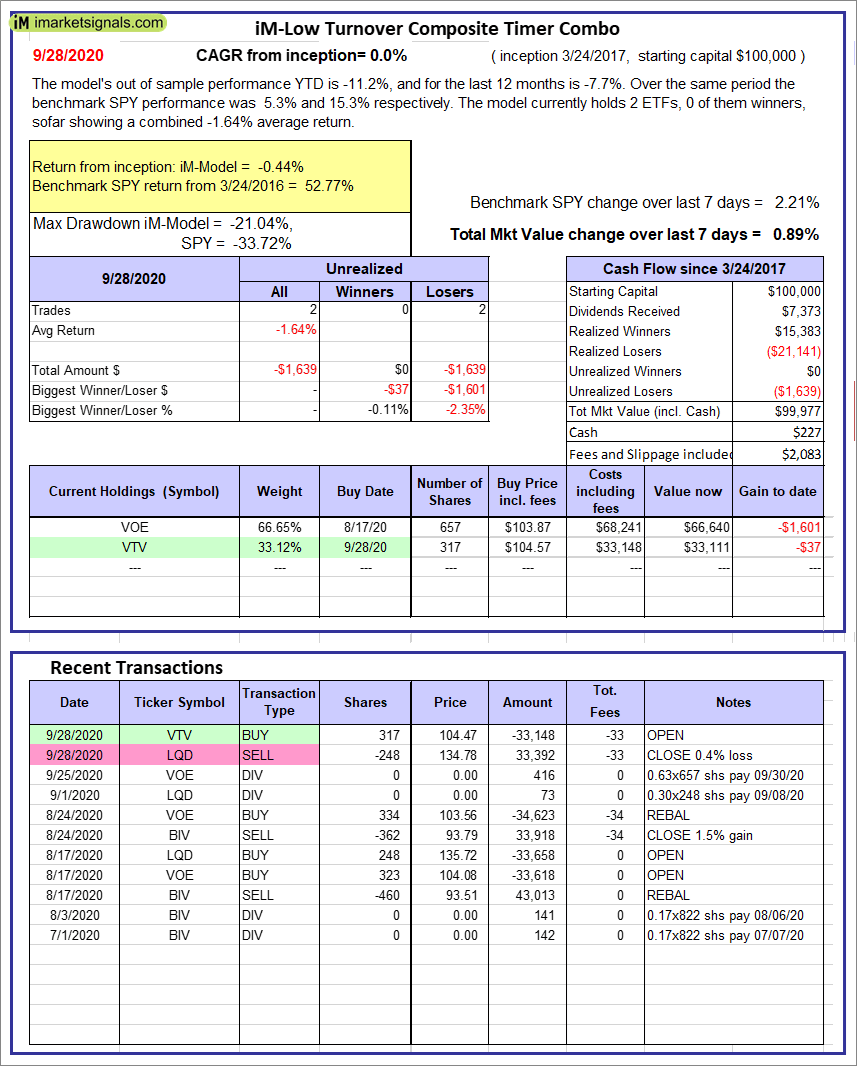 |
iM-Low Turnover Composite Timer Combo: The model’s out of sample performance YTD is -11.2%, and for the last 12 months is -7.7%. Over the same period the benchmark SPY performance was 5.3% and 15.3% respectively. Over the previous week the market value of the iM-Low Turnover Composite Timer Combo gained 0.89% at a time when SPY gained 2.21%. A starting capital of $100,000 at inception on 3/24/2017 would have grown to $99,977 which includes $227 cash and excludes $2,083 spent on fees and slippage. |
iM-Best Reports – 9/28/2020
Posted in pmp SPY-SH
Leave a Reply
You must be logged in to post a comment.