
Unemployment
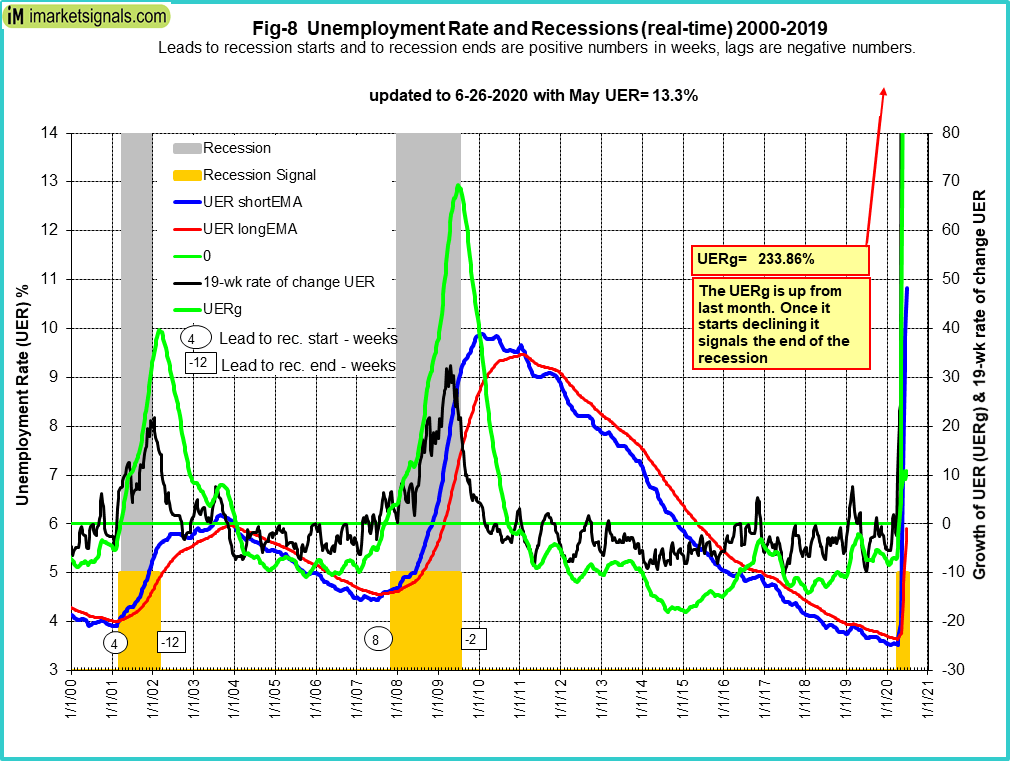 The unemployment rate recession model (article link) This model signals a recession. The end of the recession is signaled when the level of UERg starts to recede.
The 6/5/2020 employment report claims 13.3% UER and a total labor force 158,227,000 for mid May 2020. However the 6/4/2020 unemployment insurance report shows 29,965,415 persons claiming UI benefits week ending May 16. Thus 30/158 = 18.9% UER calculated from the unemployment insurance claims for exactly the same period.
CAPE-Cycle-ID
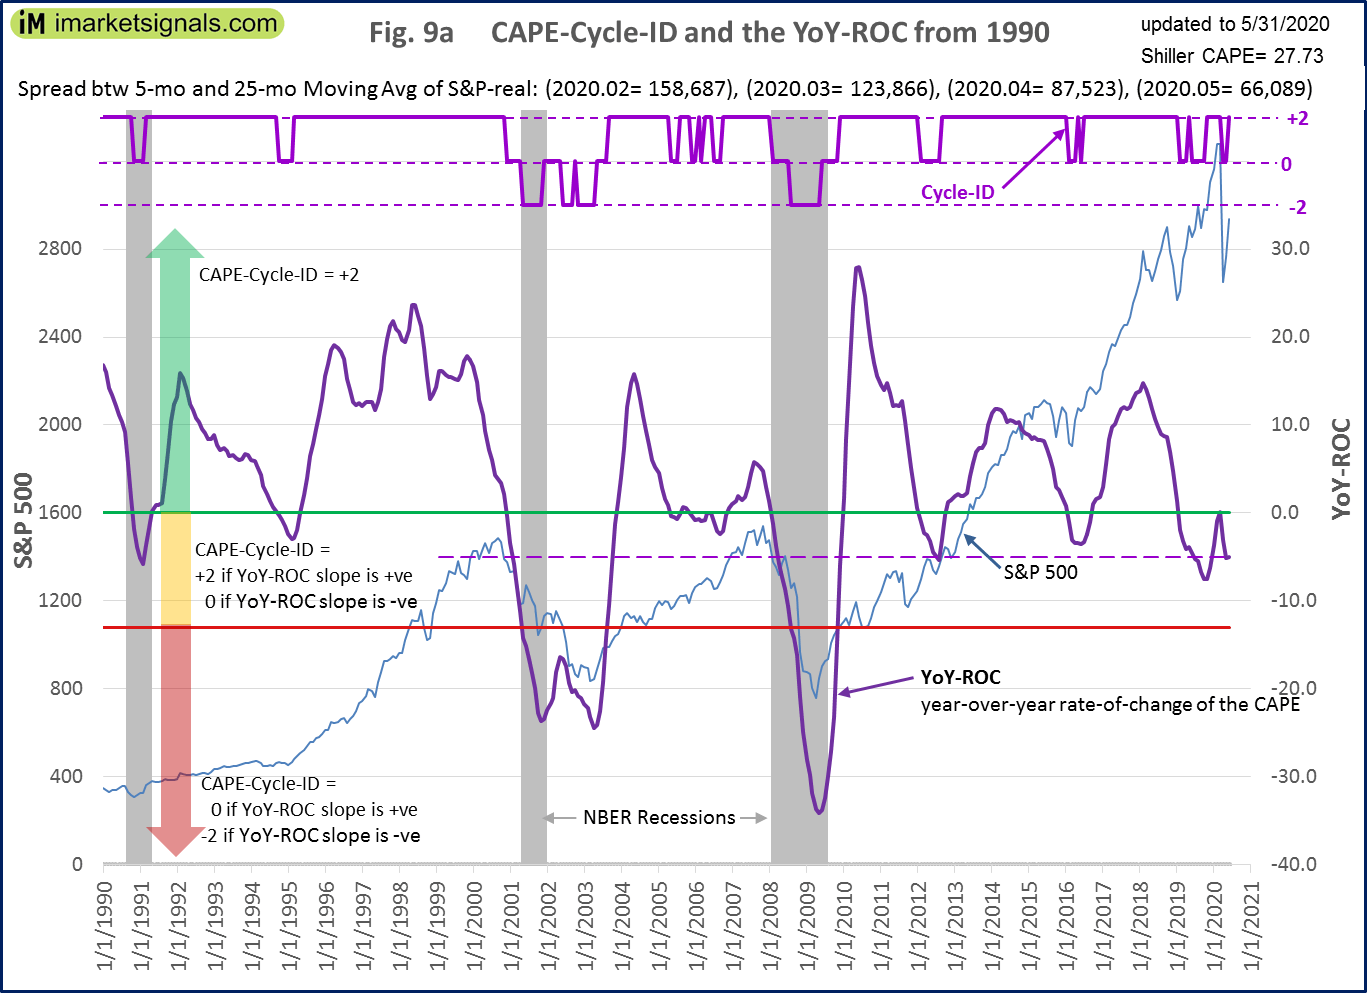 Fig 9a depicts the CAPE-Cycle-ID and the year-on-year rate-of-change of the Shiller CAPE; the level switched from +2 to 0 end of April 2020. This indicator is described here.
To avoid the bear market, exit stocks when the spread between the 5-month and 25-month moving averages of S&P-real becomes negative and simultaneously the CAPE-Cycle-ID score is 0 or -2. (read more)
Estimated Forward 10-Year Returns
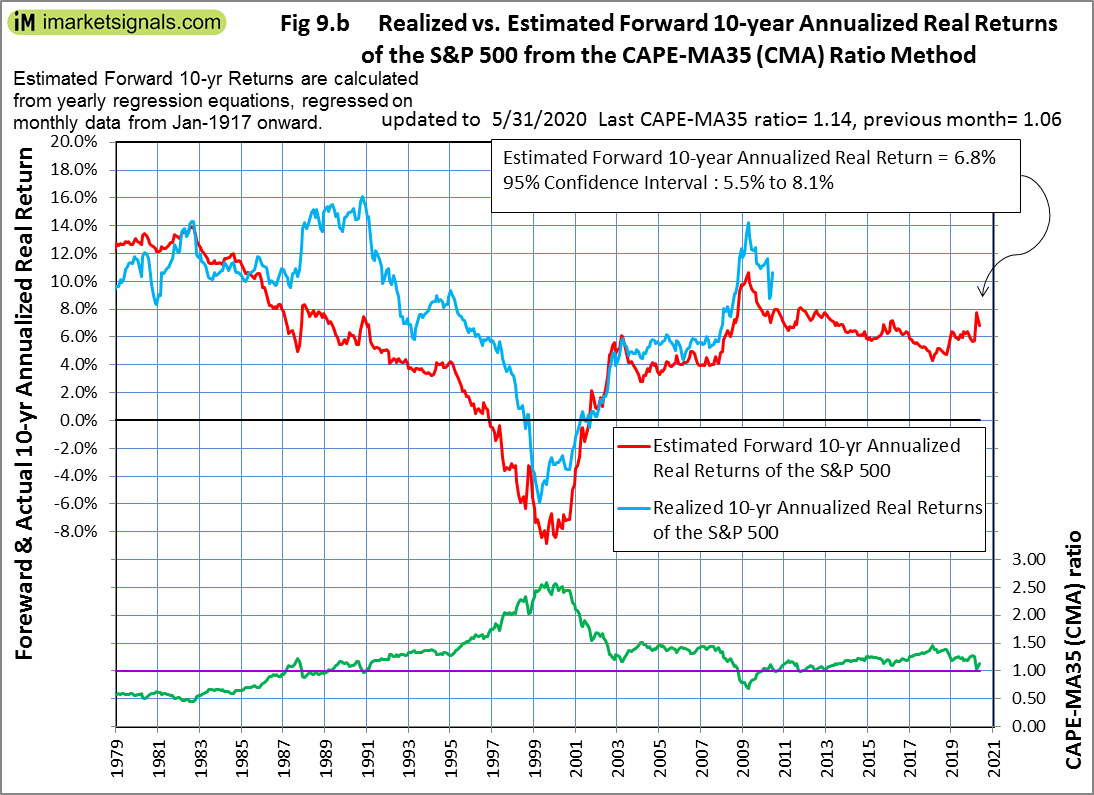 The estimated forward 10‐year annualized real return decreased to 6.8% (previous 7.4) with a 95% confidence interval : 5.5% to 8.1% (previous 6.2% to 8.7%).
iM-GT Timer
 The iM-GT Timer, based on Google Search Trends volume switched out of the markets on 3/5/2020. This indicator is described here.
Trade Weighted USD
 Will be updated later, the weekly FRED data series we used was discontinued and replacement series is daily and runs from 2015. We need to adapt our software and graphics first.
TIAA Real Estate Account
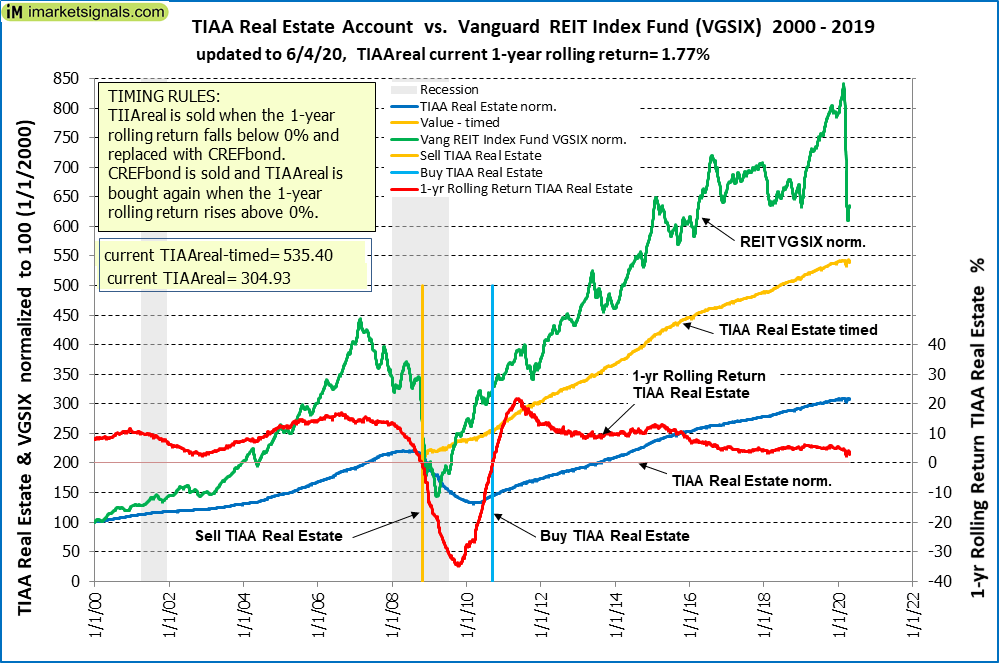 The 1-year rolling return for the end of last month is 1.77%, down from last month’s 2.99%.
Leave a Reply
You must be logged in to post a comment.