
  |
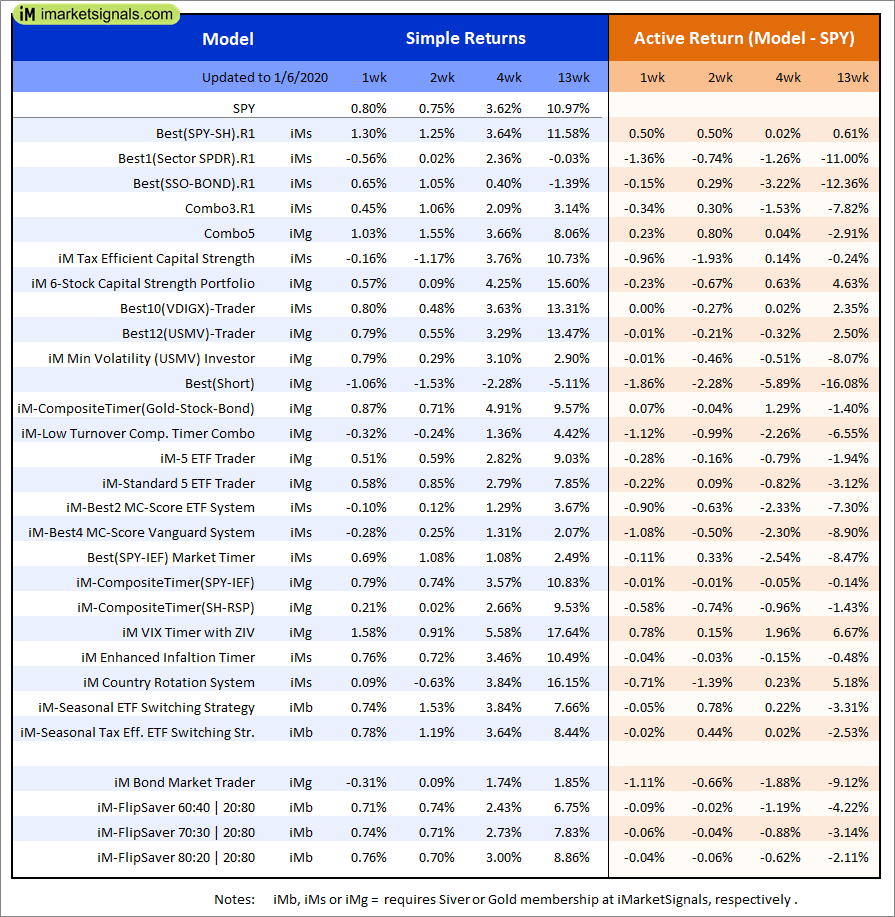
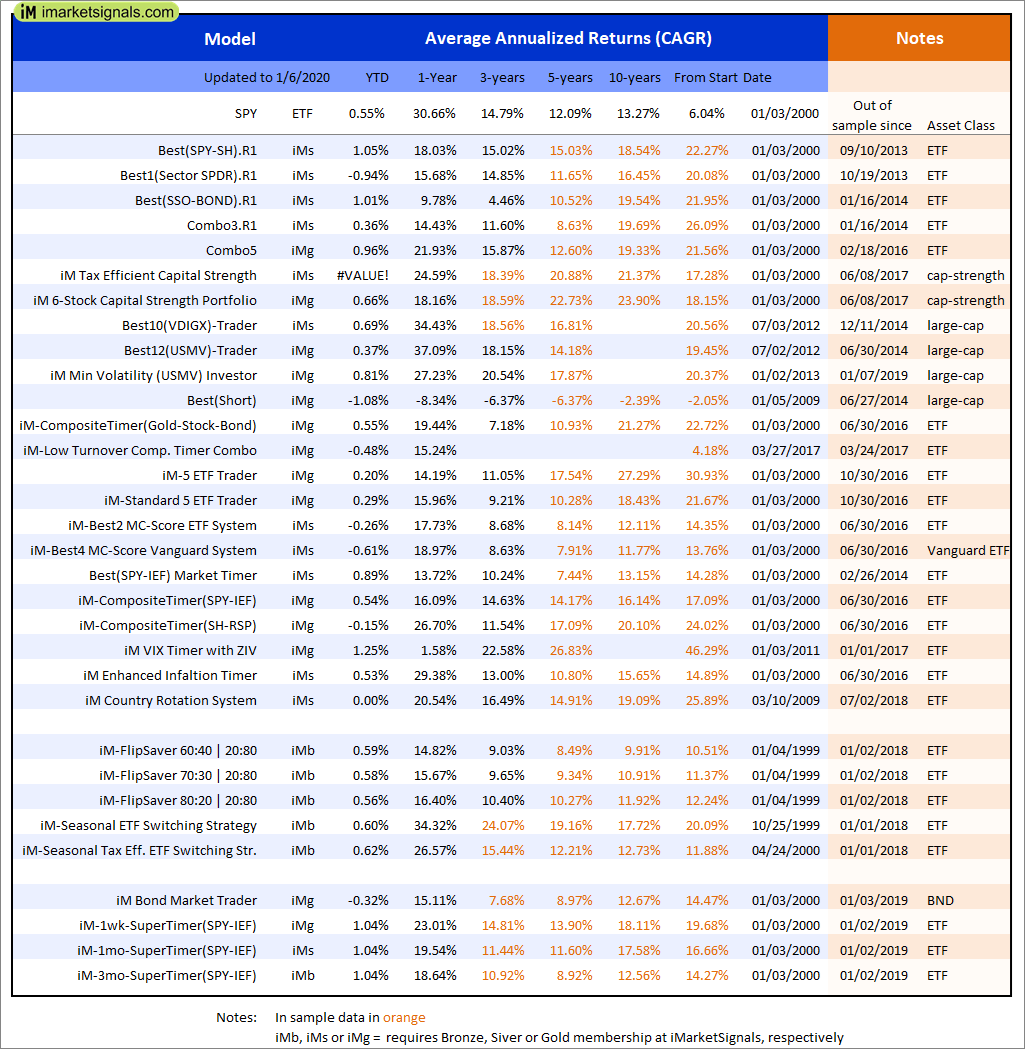
Out of sample performance summary of our models for the past 1, 2, 4 and 13 week periods. The active active return indicates how the models over- or underperformed the benchmark ETF SPY. Also the YTD, and the 1-, 3-, 5- and 10-year annualized returns are shown in the second table |
 |
iM-FlipSaver 60:40 | 20:80 – 2017: The model’s out of sample performance YTD is 0.6%, and for the last 12 months is 16.0%. Over the same period the benchmark E60B40 performance was 0.5% and 21.4% respectively. Over the previous week the market value of iM-FlipSaver 80:20 | 20:80 gained 0.72% at a time when SPY gained 0.59%. A starting capital of $100,000 at inception on 7/16/2015 would have grown to $130,240 which includes $552 cash and excludes $1,278 spent on fees and slippage. |
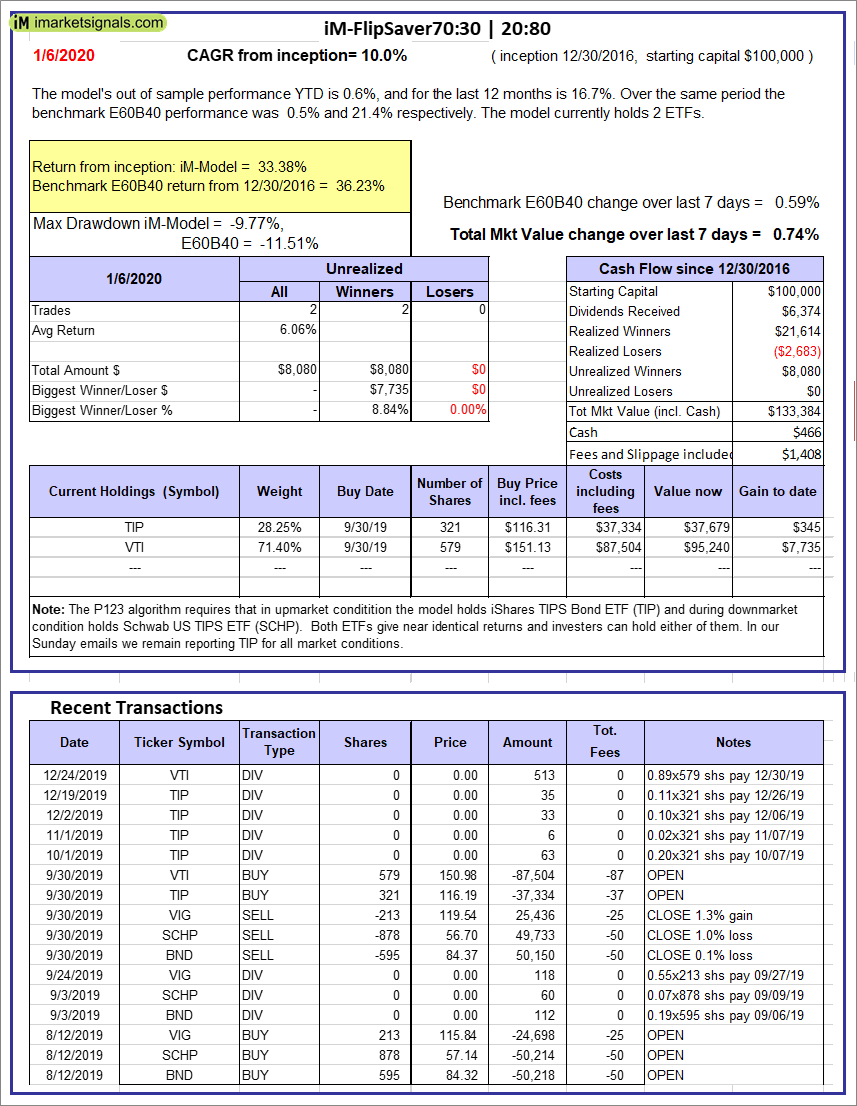 |
iM-FlipSaver 70:30 | 20:80 – 2017: The model’s out of sample performance YTD is 0.6%, and for the last 12 months is 16.7%. Over the same period the benchmark E60B40 performance was 0.5% and 21.4% respectively. Over the previous week the market value of iM-FlipSaver 70:30 | 20:80 gained 0.74% at a time when SPY gained 0.59%. A starting capital of $100,000 at inception on 7/15/2015 would have grown to $133,384 which includes $466 cash and excludes $1,408 spent on fees and slippage. |
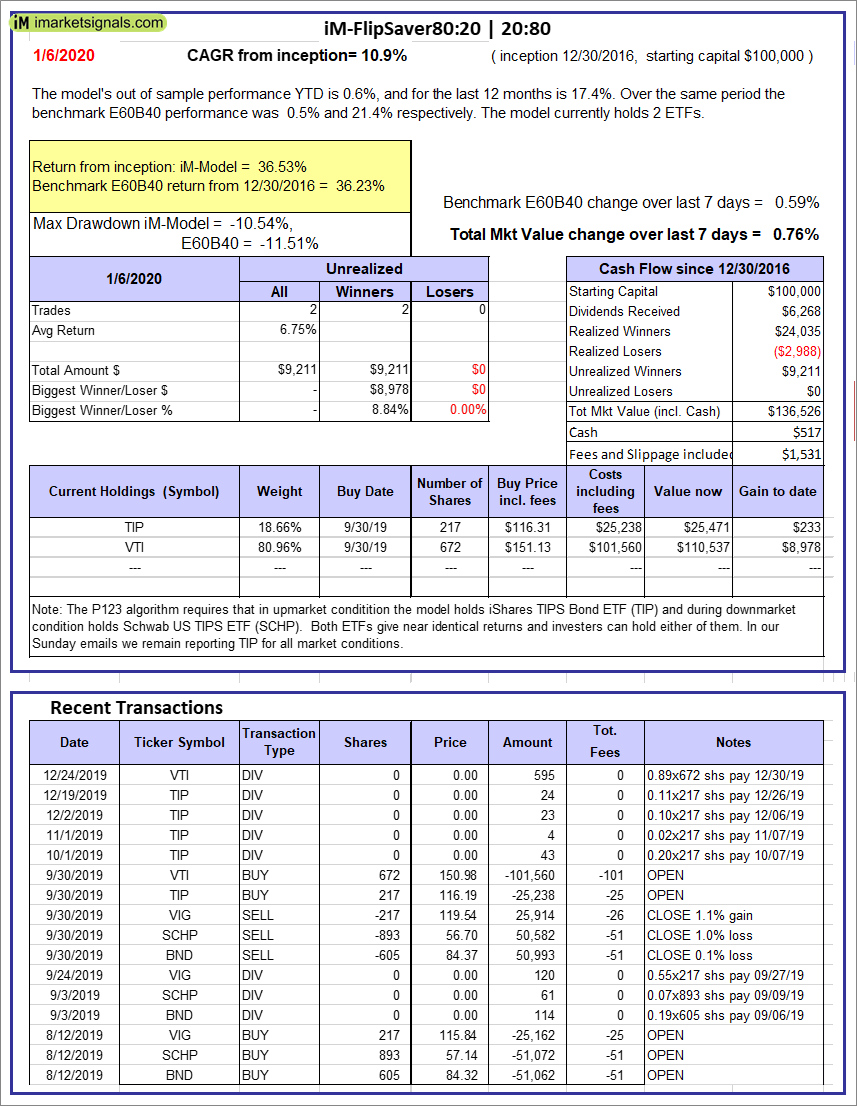 |
iM-FlipSaver 80:20 | 20:80 – 2017: The model’s out of sample performance YTD is 0.6%, and for the last 12 months is 17.4%. Over the same period the benchmark E60B40 performance was 0.5% and 21.4% respectively. Over the previous week the market value of iM-FlipSaver 80:20 | 20:80 gained 0.76% at a time when SPY gained 0.59%. A starting capital of $100,000 at inception on 1/2/2017 would have grown to $136,526 which includes $517 cash and excludes $1,531 spent on fees and slippage. |
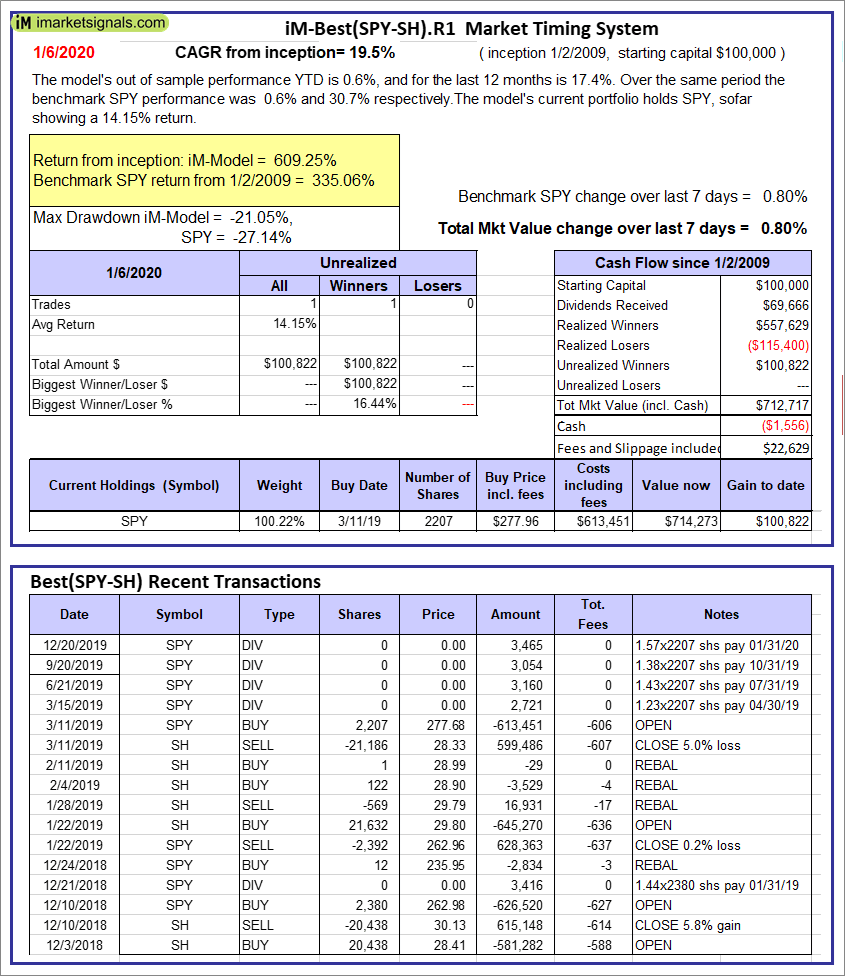 |
iM-Best(SPY-SH).R1: The model’s out of sample performance YTD is 0.6%, and for the last 12 months is 17.4%. Over the same period the benchmark SPY performance was 0.6% and 30.7% respectively. Over the previous week the market value of Best(SPY-SH) gained 0.80% at a time when SPY gained 0.80%. A starting capital of $100,000 at inception on 1/2/2009 would have grown to $712,717 which includes -$1,556 cash and excludes $22,629 spent on fees and slippage. |
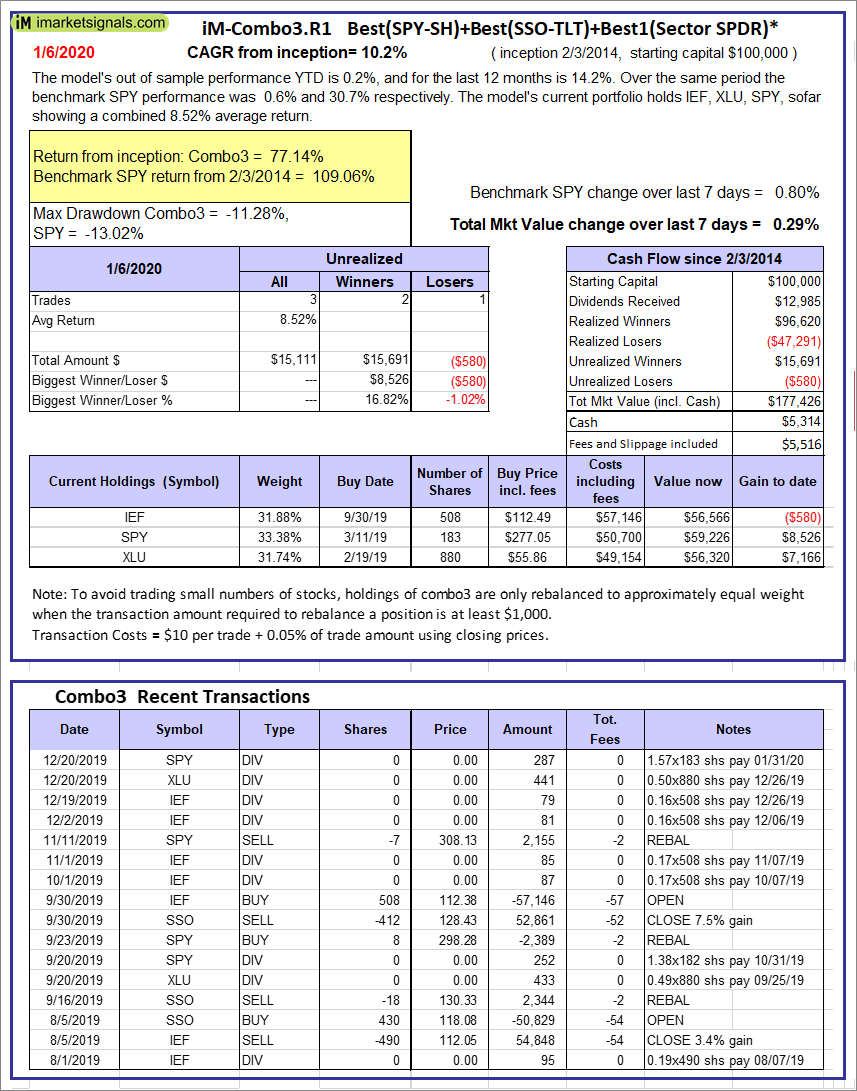 |
iM-Combo3.R1: The model’s out of sample performance YTD is 0.2%, and for the last 12 months is 14.2%. Over the same period the benchmark SPY performance was 0.6% and 30.7% respectively. Over the previous week the market value of iM-Combo3.R1 gained 0.29% at a time when SPY gained 0.80%. A starting capital of $100,000 at inception on 2/3/2014 would have grown to $177,426 which includes $5,314 cash and excludes $5,516 spent on fees and slippage. |
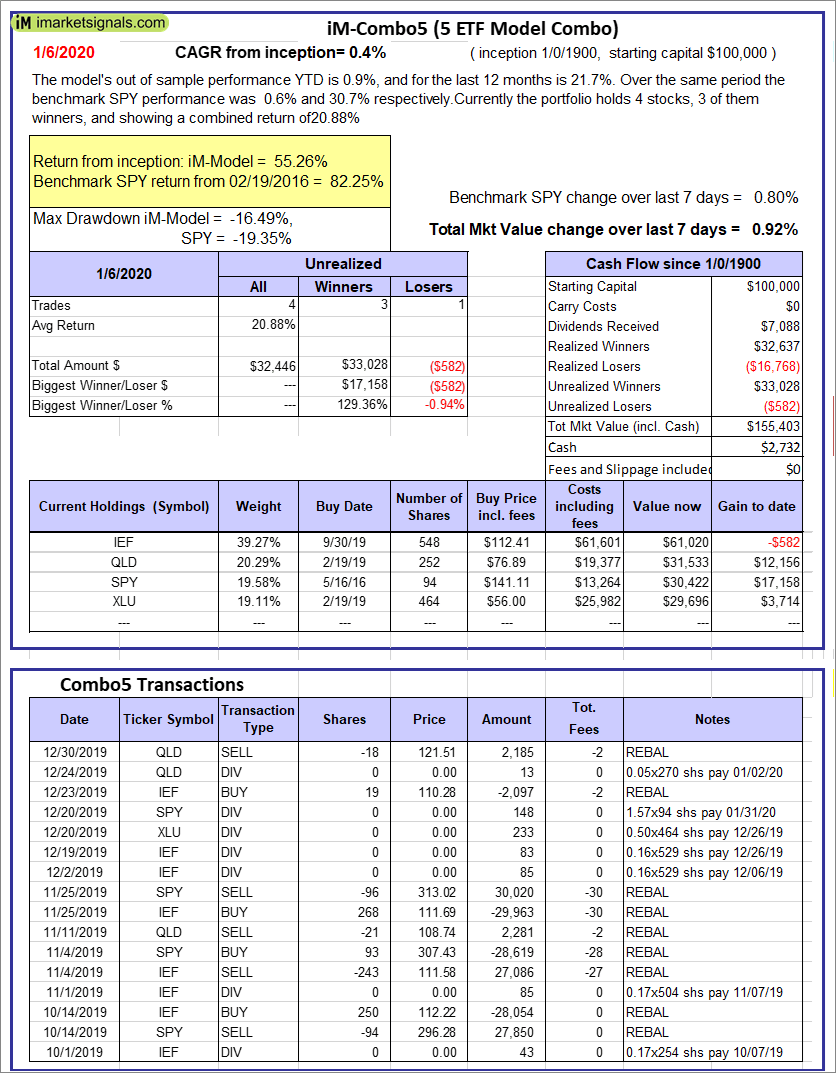 |
iM-Combo5: The model’s out of sample performance YTD is 0.9%, and for the last 12 months is 21.7%. Over the same period the benchmark SPY performance was 0.6% and 30.7% respectively. Over the previous week the market value of iM-Combo5 gained 0.92% at a time when SPY gained 0.80%. A starting capital of $100,000 at inception on 2/22/2016 would have grown to $155,403 which includes $2,732 cash and excludes $0 spent on fees and slippage. |
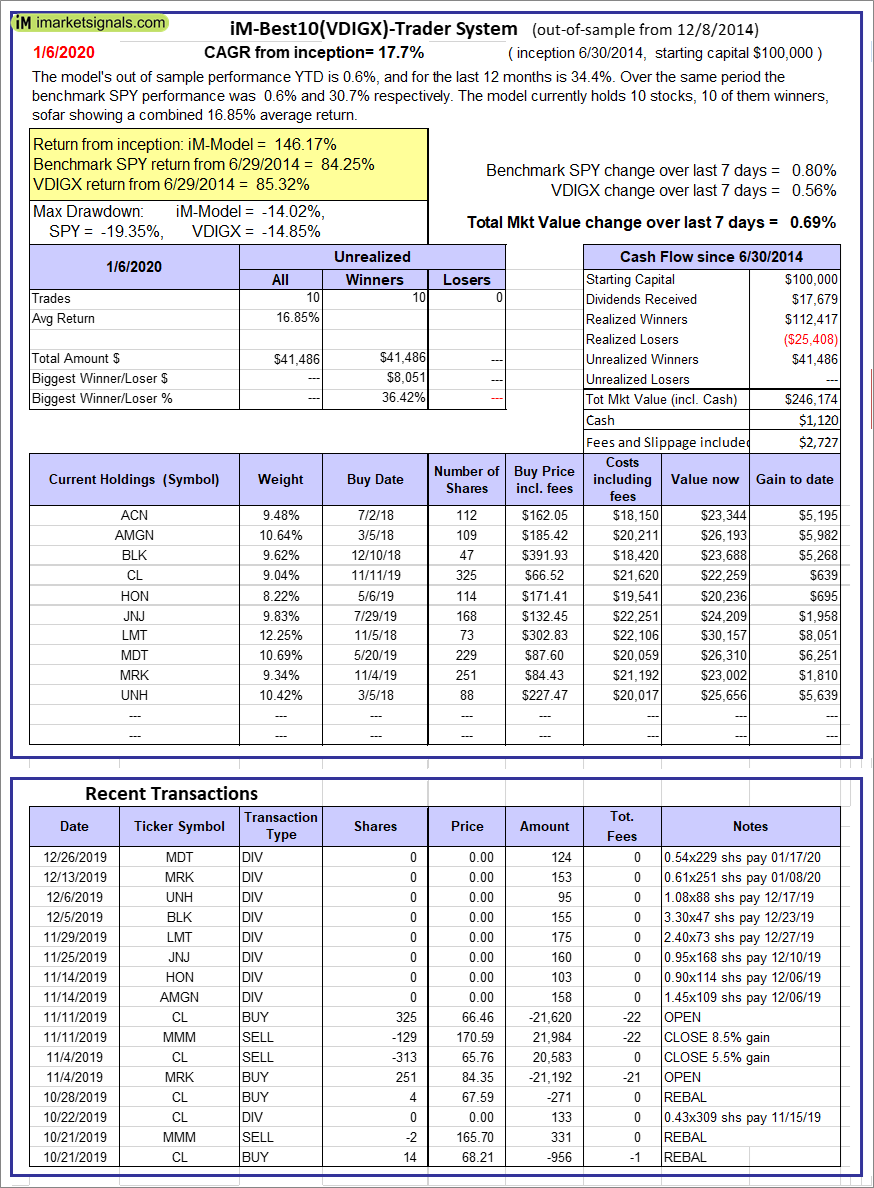 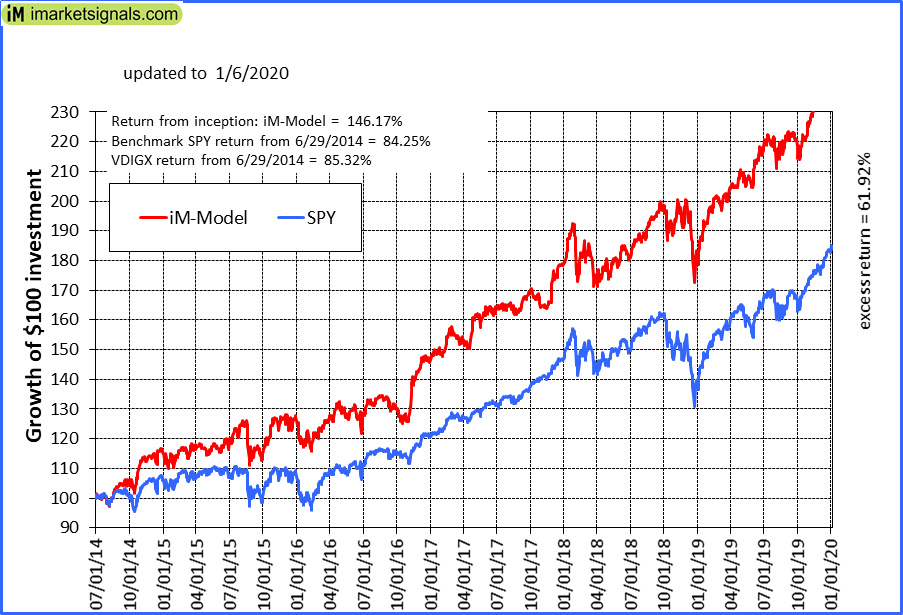 |
iM-Best10(VDIGX)-Trader: The model’s out of sample performance YTD is 0.6%, and for the last 12 months is 34.4%. Over the same period the benchmark SPY performance was 0.6% and 30.7% respectively. Since inception, on 7/1/2014, the model gained 146.17% while the benchmark SPY gained 84.25% and VDIGX gained 85.32% over the same period. Over the previous week the market value of iM-Best10(VDIGX) gained 0.69% at a time when SPY gained 0.80%. A starting capital of $100,000 at inception on 7/1/2014 would have grown to $246,174 which includes $1,120 cash and excludes $2,727 spent on fees and slippage. |
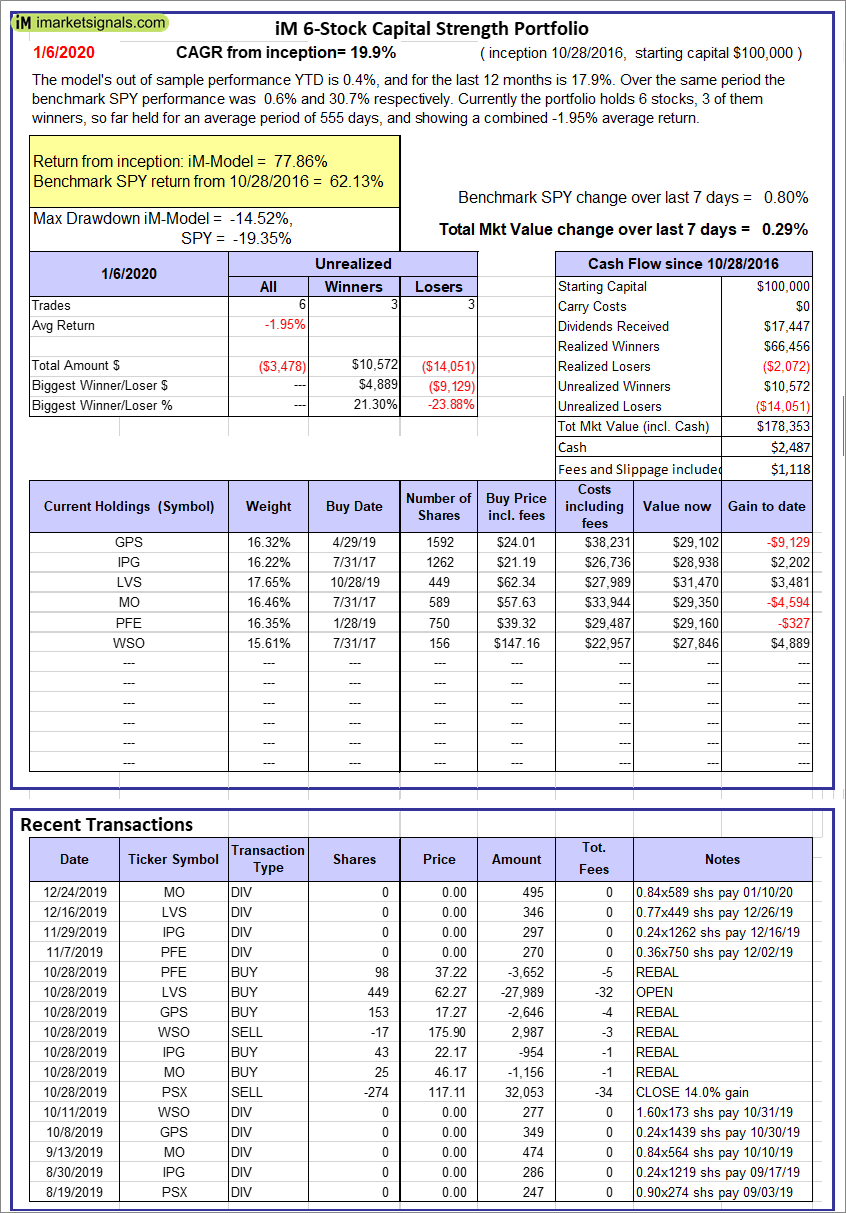 |
iM 6-Stock Capital Strength Portfolio: The model’s out of sample performance YTD is 0.4%, and for the last 12 months is 17.9%. Over the same period the benchmark SPY performance was 0.6% and 30.7% respectively. Over the previous week the market value of the iM 6-Stock Capital Strength Portfolio gained 0.29% at a time when SPY gained 0.80%. A starting capital of $100,000 at inception on 10/28/2016 would have grown to $178,353 which includes $2,487 cash and excludes $1,118 spent on fees and slippage. |
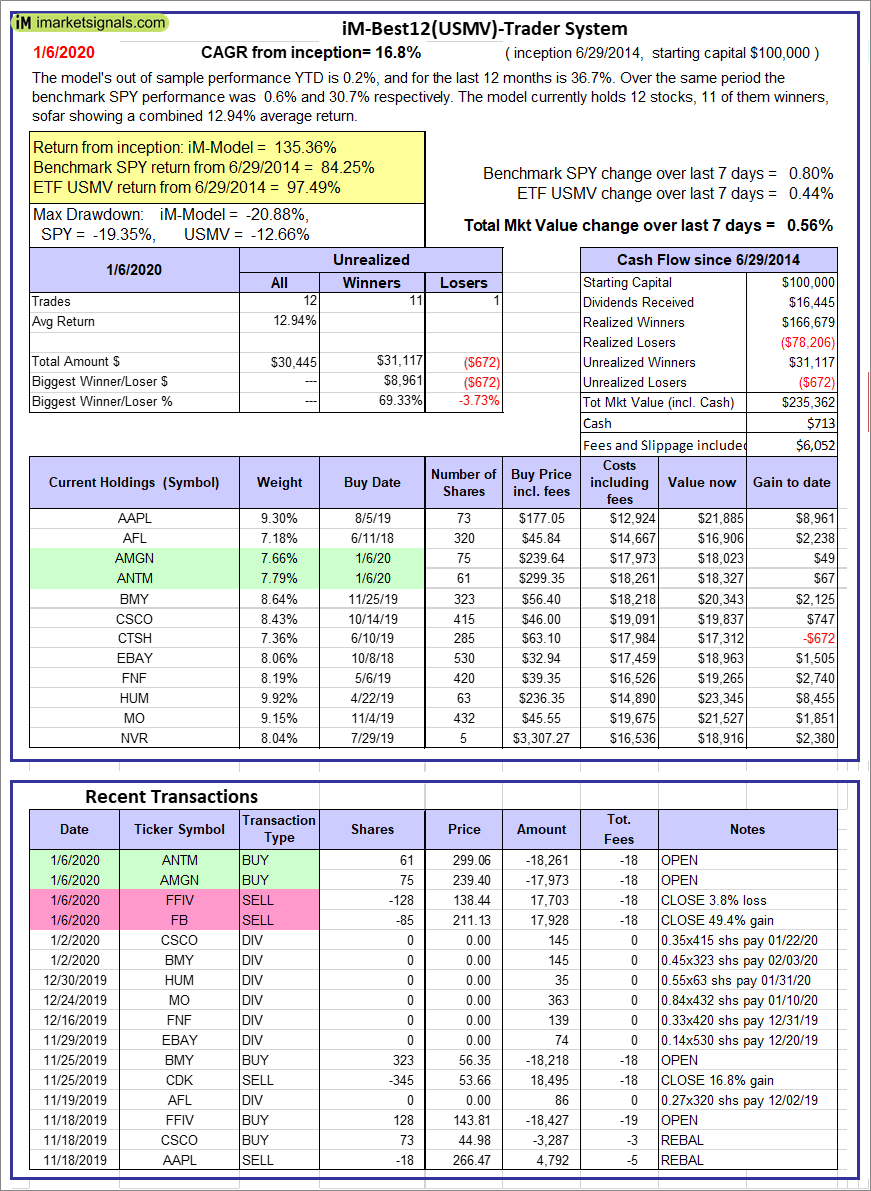 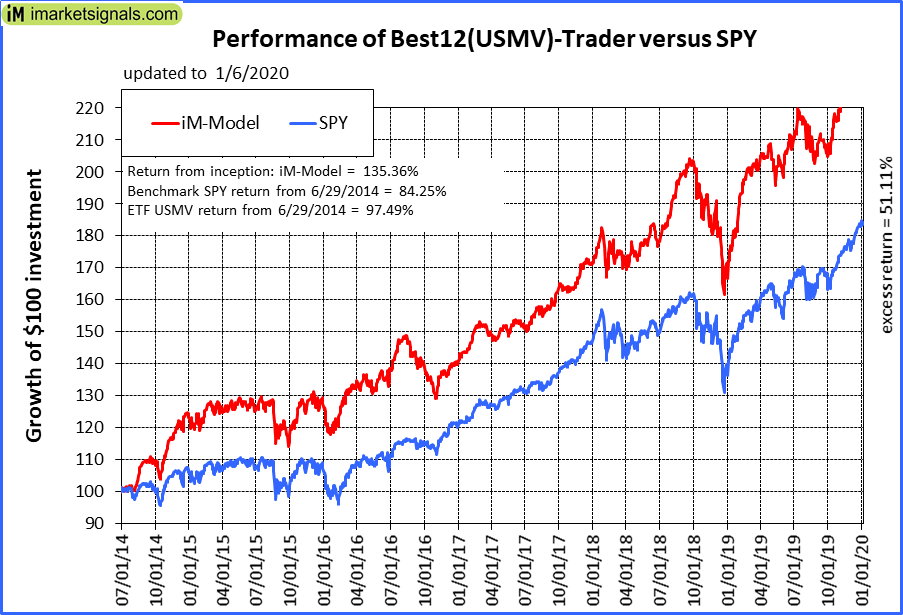 |
iM-Best12(USMV)-Trader: The model’s out of sample performance YTD is 0.2%, and for the last 12 months is 36.7%. Over the same period the benchmark SPY performance was 0.6% and 30.7% respectively. Since inception, on 6/30/2014, the model gained 135.36% while the benchmark SPY gained 84.25% and the ETF USMV gained 97.49% over the same period. Over the previous week the market value of iM-Best12(USMV)-Trader gained 0.56% at a time when SPY gained 0.80%. A starting capital of $100,000 at inception on 6/30/2014 would have grown to $235,362 which includes $713 cash and excludes $6,052 spent on fees and slippage. |
 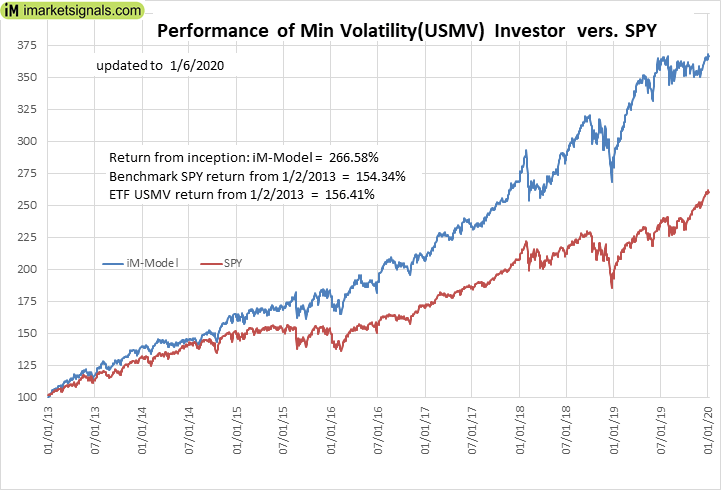 |
iM-Min Volatility(USMV) Investor (Tax Efficient): The model’s out of sample performance YTD is 0.6%, and for the last 12 months is 27.0%. Over the same period the benchmark SPY performance was 0.6% and 30.7% respectively. Since inception, on 1/3/2013, the model gained 266.58% while the benchmark SPY gained 154.34% and the ETF USMV gained 156.41% over the same period. Over the previous week the market value of iM-Best12(USMV)Q1 gained 0.79% at a time when SPY gained 0.80%. A starting capital of $100,000 at inception on 1/3/2013 would have grown to $366,579 which includes $741 cash and excludes $2,394 spent on fees and slippage. |
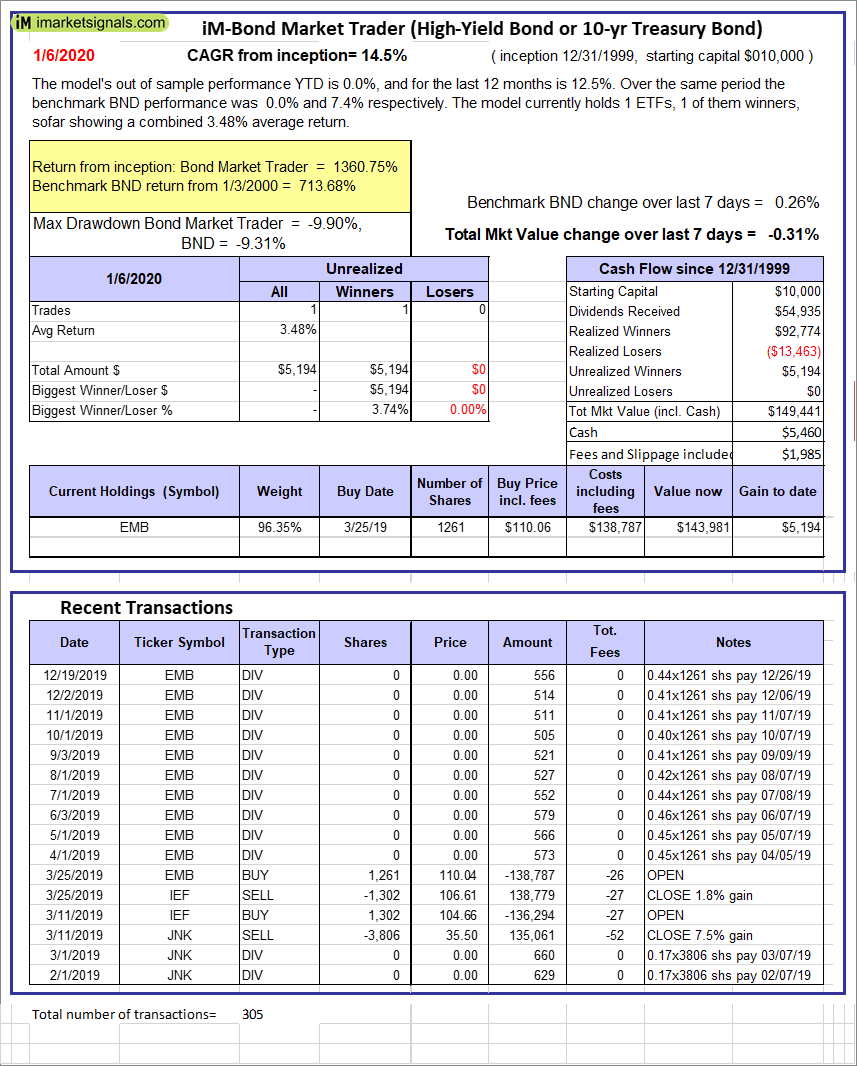 |
iM-Bond Market Trader (High-Yield Bond or 10-yr Treasury Bond): The model’s out of sample performance YTD is 0.2%, and for the last 12 months is 13.9%. Over the same period the benchmark SPY performance was 0.6% and 30.7% respectively. Over the previous week the market value of the iM-Bond Market Trader (High-Yield Bond or 10-yr Treasury Bond) gained -0.31% at a time when BND gained 0.26%. A starting capital of $100,000 at inception on 10/30/2016 would have grown to $149,441 which includes $5,460 cash and excludes $1,985 spent on fees and slippage. |
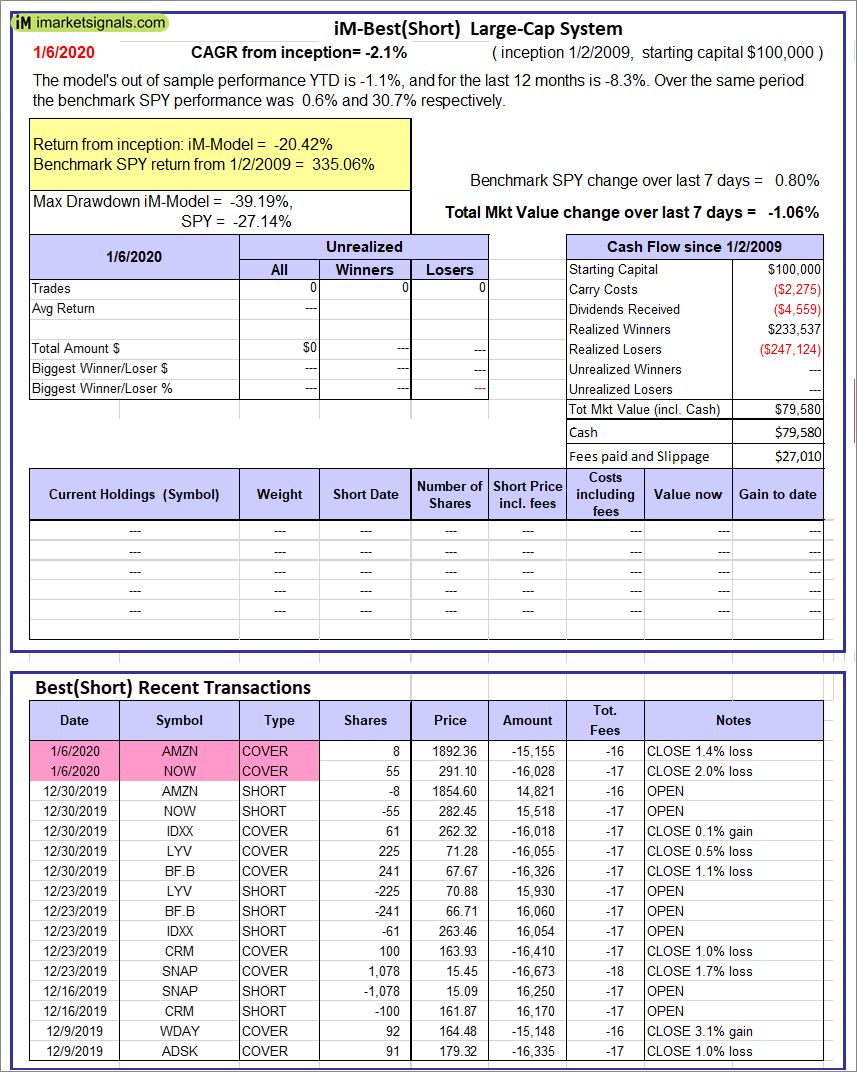 |
iM-Best(Short): The model’s out of sample performance YTD is -1.1%, and for the last 12 months is -8.3%. Over the same period the benchmark SPY performance was 0.6% and 30.7% respectively. Over the previous week the market value of iM-Best(Short) gained -1.06% at a time when SPY gained 0.80%. Over the period 1/2/2009 to 1/6/2020 the starting capital of $100,000 would have grown to $79,580 which includes $79,580 cash and excludes $27,010 spent on fees and slippage. |
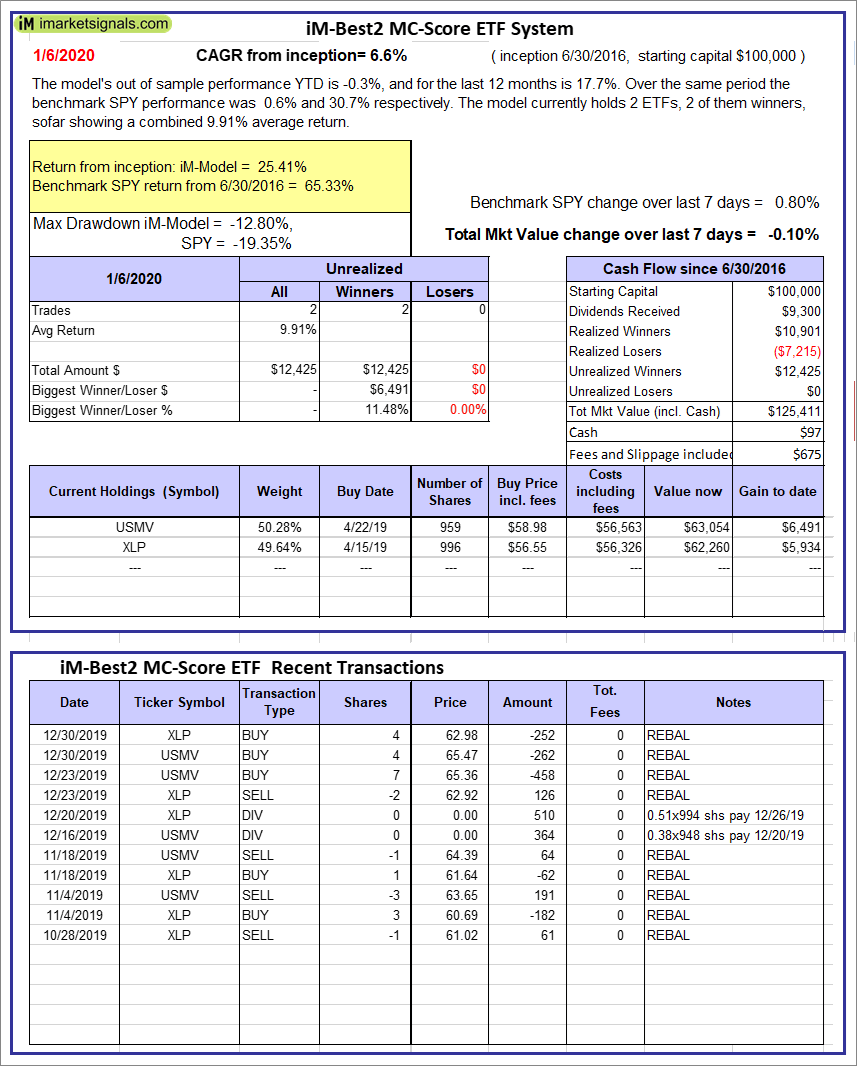 |
iM-Best2 MC-Score ETF System: The model’s out of sample performance YTD is -0.3%, and for the last 12 months is 17.7%. Over the same period the benchmark SPY performance was 0.6% and 30.7% respectively. Over the previous week the market value of the iM-Best2 MC-Score ETF System gained -0.10% at a time when SPY gained 0.80%. A starting capital of $100,000 at inception on 6/30/2016 would have grown to $125,411 which includes $97 cash and excludes $675 spent on fees and slippage. |
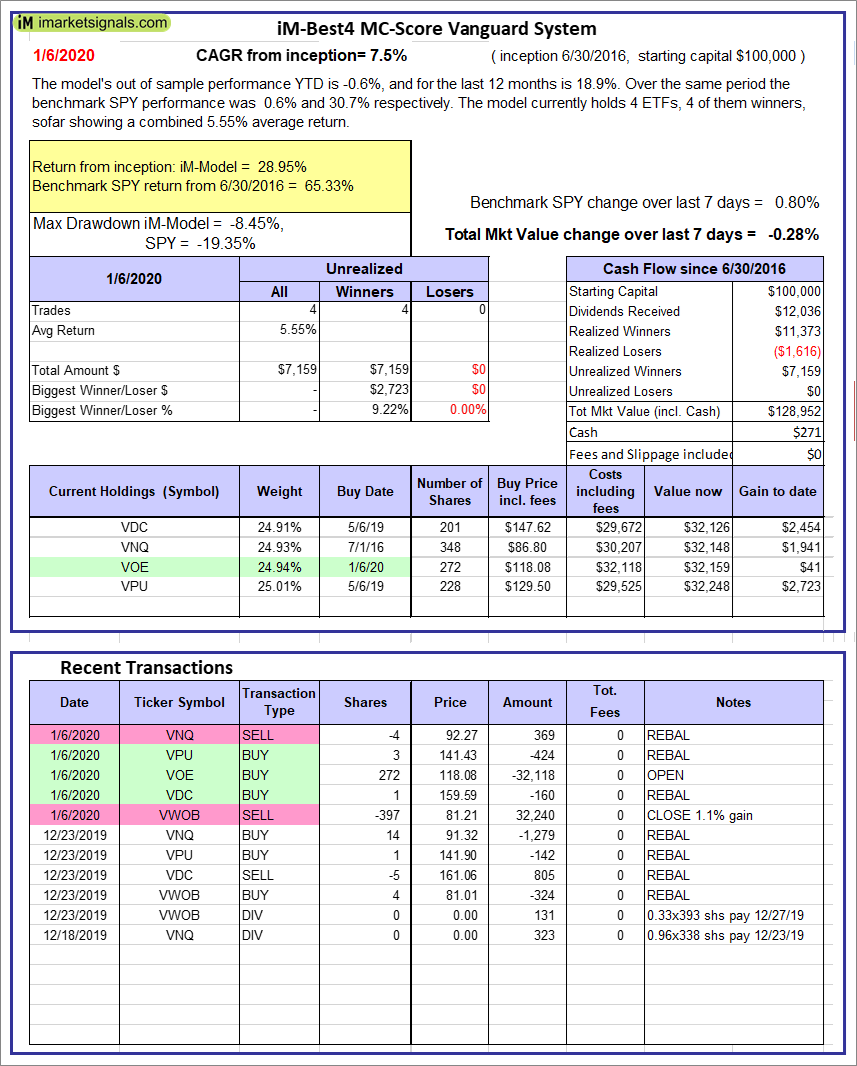 |
iM-Best4 MC-Score Vanguard System: The model’s out of sample performance YTD is -0.6%, and for the last 12 months is 18.9%. Over the same period the benchmark SPY performance was 0.6% and 30.7% respectively. Over the previous week the market value of the iM-Best4 MC-Score Vanguard System gained -0.28% at a time when SPY gained 0.80%. A starting capital of $100,000 at inception on 6/30/2016 would have grown to $128,952 which includes $271 cash and excludes $00 spent on fees and slippage. |
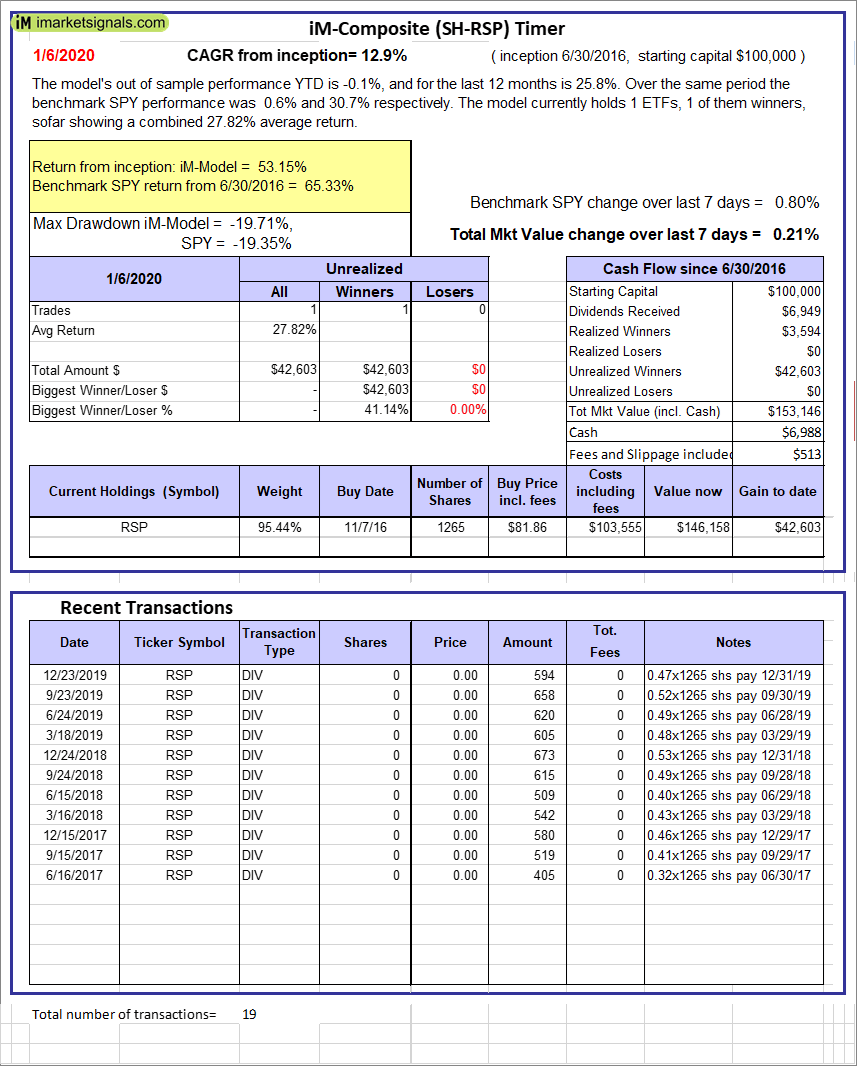 |
iM-Composite (SH-RSP) Timer: The model’s out of sample performance YTD is -0.1%, and for the last 12 months is 25.8%. Over the same period the benchmark SPY performance was 0.6% and 30.7% respectively. Over the previous week the market value of the iM-Composite (SH-RSP) Timer gained 0.21% at a time when SPY gained 0.80%. A starting capital of $100,000 at inception on 6/30/2016 would have grown to $153,146 which includes $6,988 cash and excludes $513 spent on fees and slippage. |
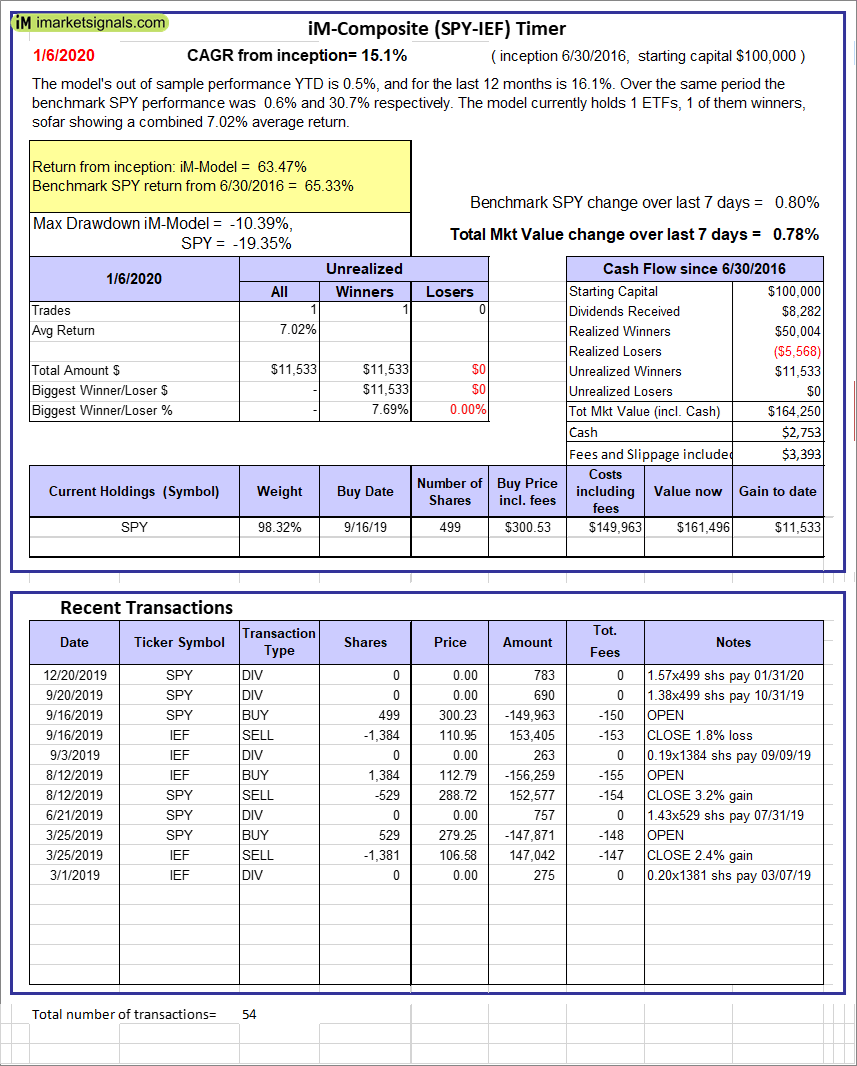 |
iM-Composite (SPY-IEF) Timer: The model’s out of sample performance YTD is 0.5%, and for the last 12 months is 16.1%. Over the same period the benchmark SPY performance was 0.6% and 30.7% respectively. Over the previous week the market value of the iM-Composite (SPY-IEF) Timer gained 0.78% at a time when SPY gained 0.80%. A starting capital of $100,000 at inception on 6/30/2016 would have grown to $164,250 which includes $2,753 cash and excludes $3,393 spent on fees and slippage. |
 |
iM-VIX Timer with ZIV: The model’s out of sample performance YTD is 1.3%, and for the last 12 months is 1.6%. Over the same period the benchmark SPY performance was 0.6% and 30.7% respectively. Over the previous week the market value of the iM-VIX Timer with ZIV gained 1.58% at a time when SPY gained 0.80%. A starting capital of $100,000 at inception on 6/30/2016 would have grown to $188,150 which includes $817 cash and excludes $7,434 spent on fees and slippage. |
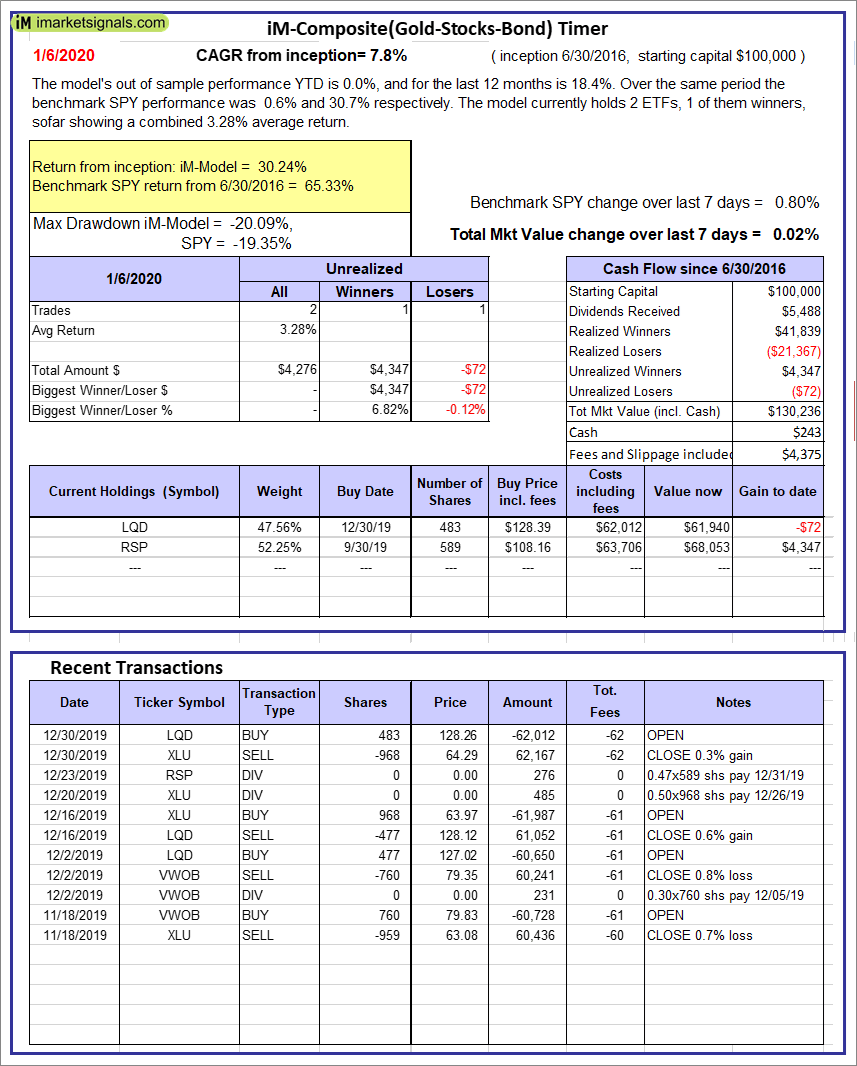 |
iM-Composite(Gold-Stocks-Bond) Timer: The model’s out of sample performance YTD is 0.0%, and for the last 12 months is 18.4%. Over the same period the benchmark SPY performance was 0.6% and 30.7% respectively. Over the previous week the market value of the iM-Composite(Gold-Stocks-Bond) Timer gained 0.02% at a time when SPY gained 0.80%. A starting capital of $100,000 at inception on 6/30/2016 would have grown to $130,236 which includes $243 cash and excludes $4,375 spent on fees and slippage. |
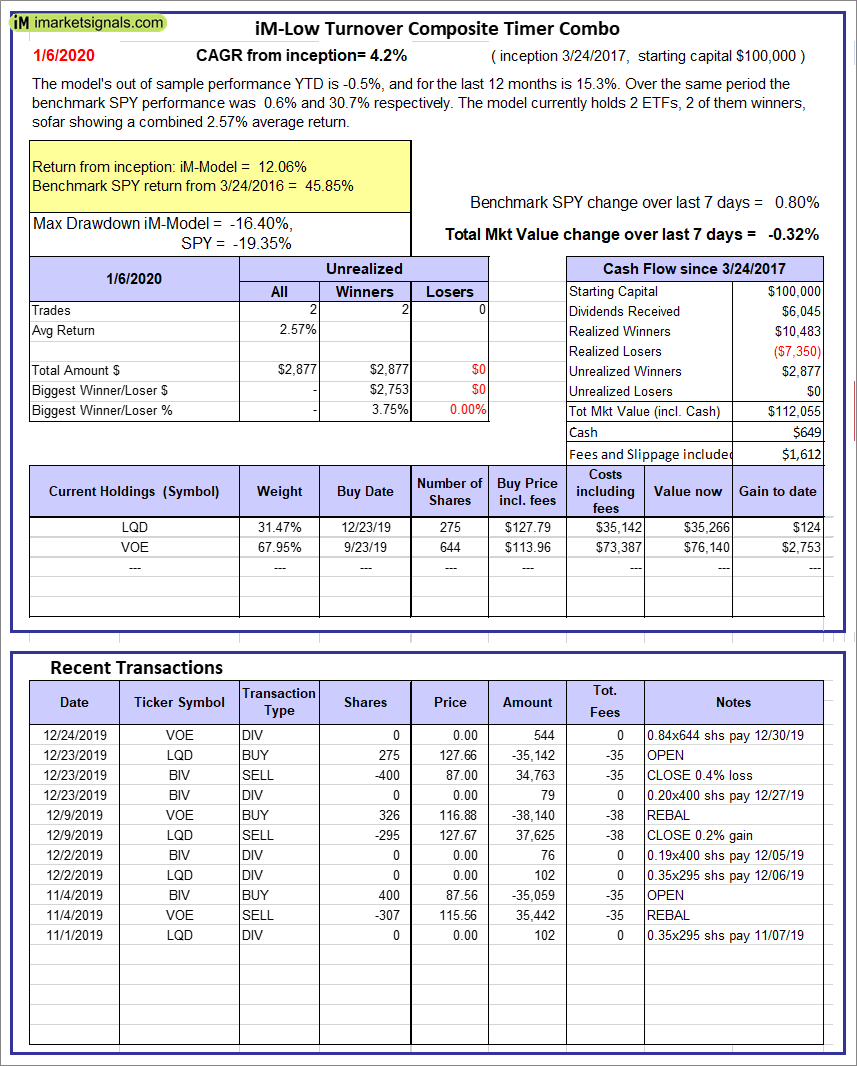 |
iM-Low Turnover Composite Timer Combo: The model’s out of sample performance YTD is -0.5%, and for the last 12 months is 15.3%. Over the same period the benchmark SPY performance was 0.6% and 30.7% respectively. Over the previous week the market value of the iM-Low Turnover Composite Timer Combo gained -0.32% at a time when SPY gained 0.80%. A starting capital of $100,000 at inception on 3/24/27 would have grown to $112,055 which includes $649 cash and excludes $1,612 spent on fees and slippage. |
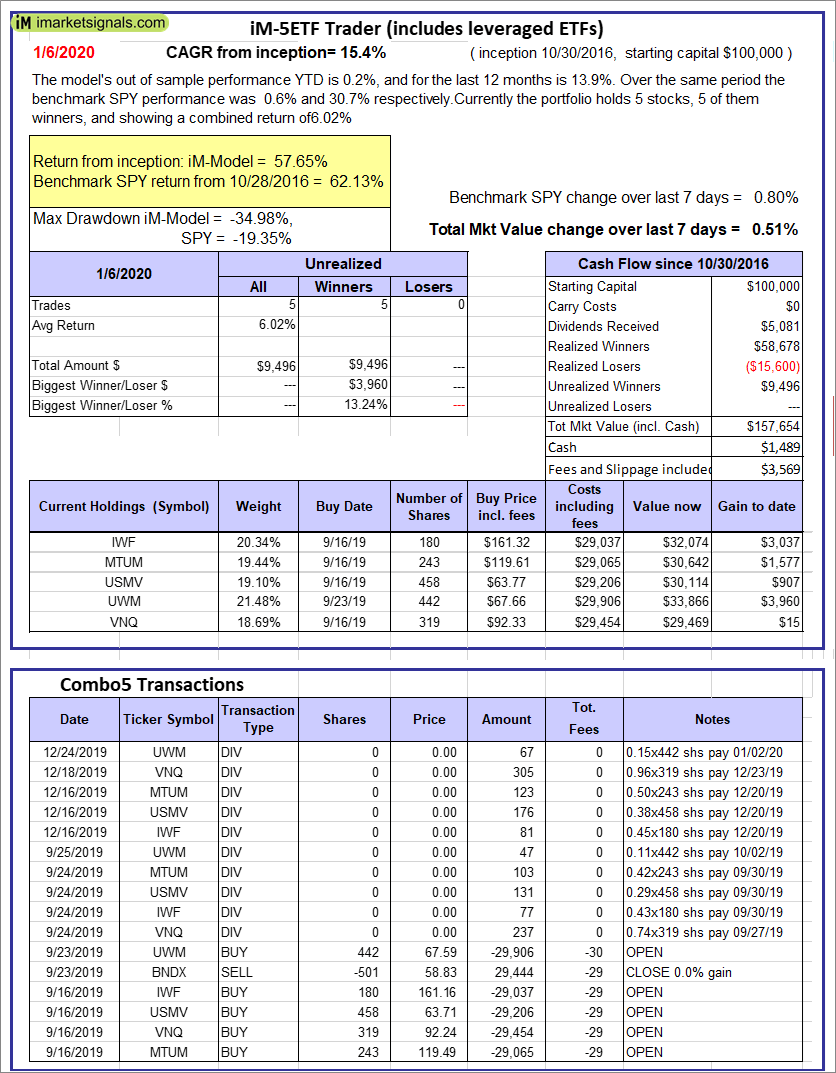 |
iM-5ETF Trader (includes leveraged ETFs): The model’s out of sample performance YTD is 0.2%, and for the last 12 months is 13.9%. Over the same period the benchmark SPY performance was 0.6% and 30.7% respectively. Over the previous week the market value of the iM-5ETF Trader (includes leveraged ETFs) gained 0.51% at a time when SPY gained 0.80%. A starting capital of $100,000 at inception on 10/30/2016 would have grown to $157,654 which includes $1,489 cash and excludes $3,569 spent on fees and slippage. |
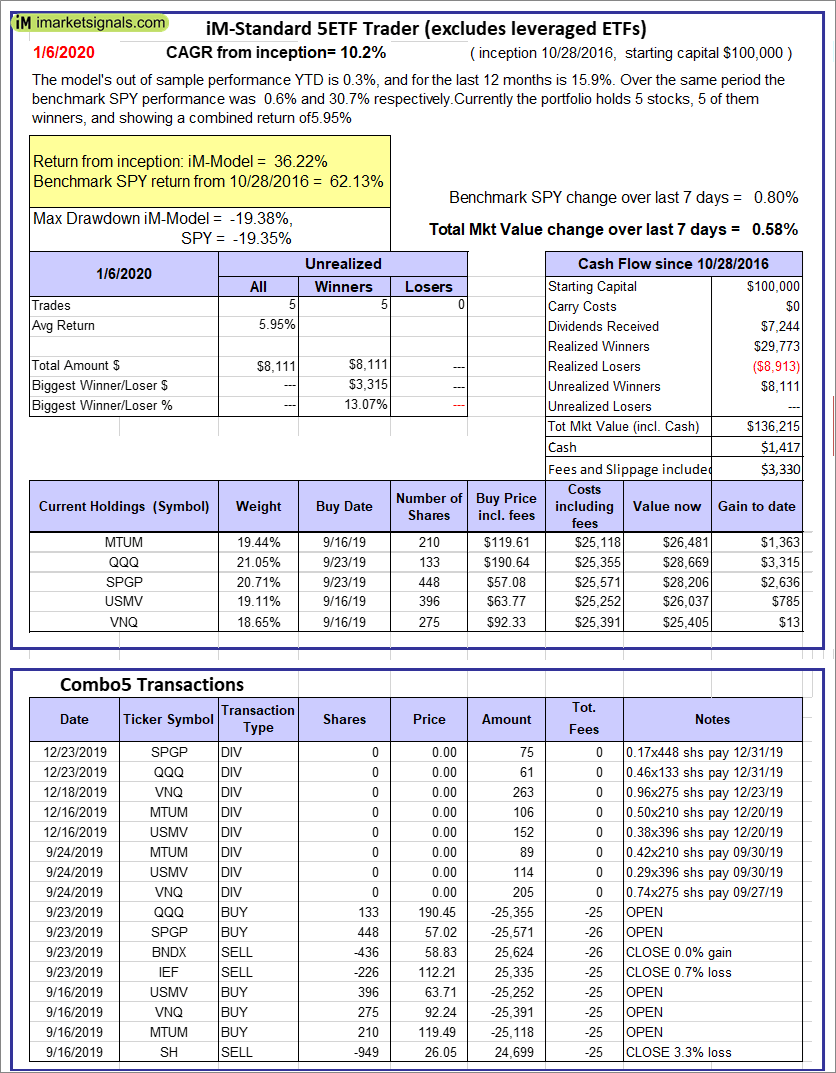 |
iM-Standard 5ETF Trader (excludes leveraged ETFs): The model’s out of sample performance YTD is 0.3%, and for the last 12 months is 15.9%. Over the same period the benchmark SPY performance was 0.6% and 30.7% respectively. Over the previous week the market value of the iM-Standard 5ETF Trader (excludes leveraged ETFs) gained 0.58% at a time when SPY gained 0.80%. A starting capital of $100,000 at inception on 10/30/2016 would have grown to $136,215 which includes $1,417 cash and excludes $3,330 spent on fees and slippage. |
iM-Best Reports – 1/6/2020
Posted in pmp SPY-SH
Leave a Reply
You must be logged in to post a comment.