
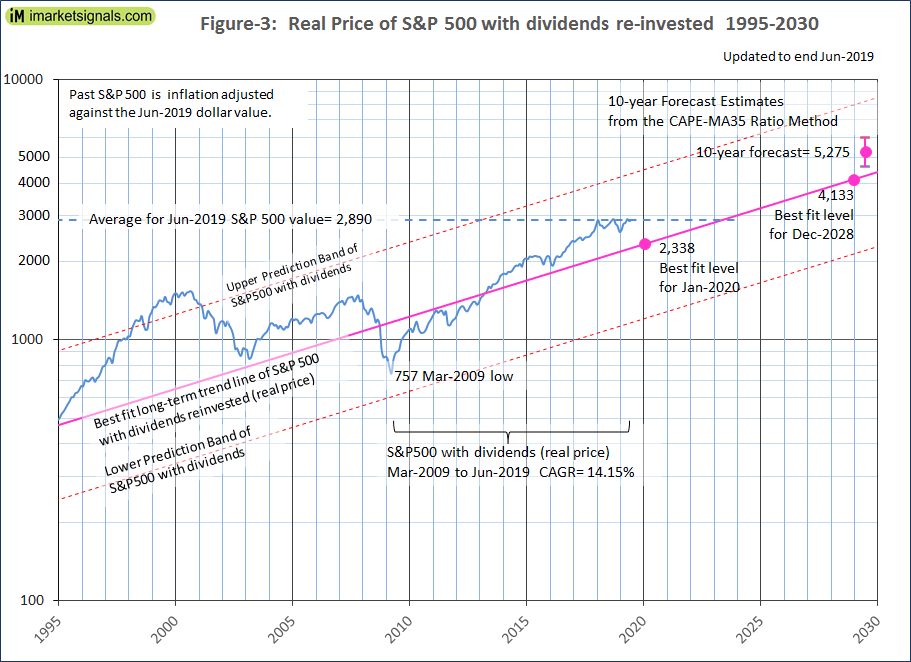
- The average of S&P 500 for Jun-2019 was 2,890. A 20% decline from this level would bring it to the Jan-2020 level of the long-term trend line.
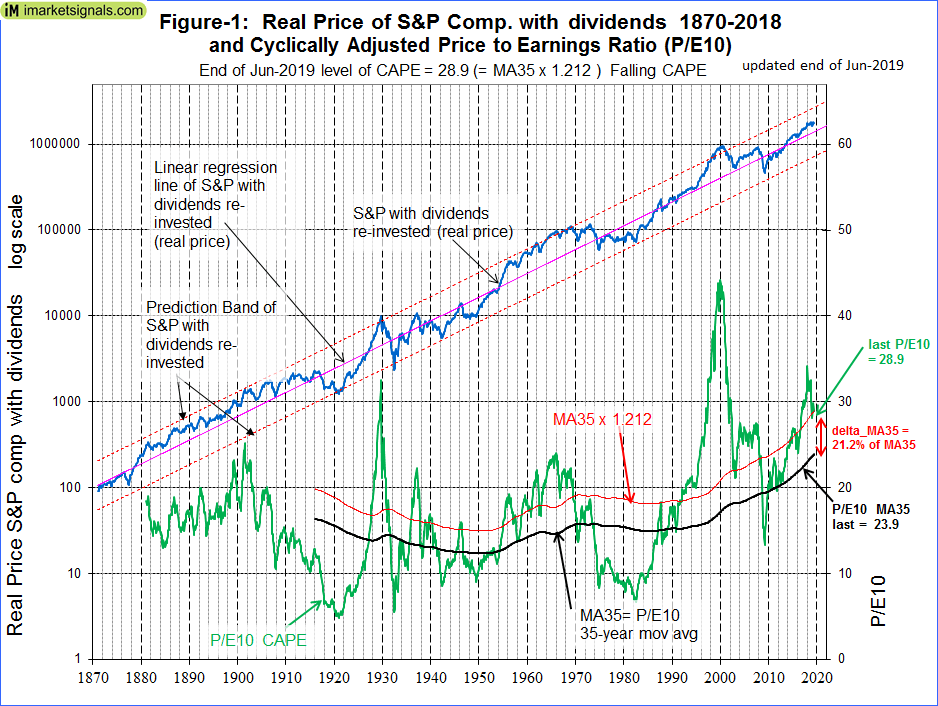
- The Shiller Cyclically Adjusted Price to Earnings Ratio (CAPE) is at a relatively high level of 28.9, and the CAPE’s 35-year moving average (MA35) is at 23.9.
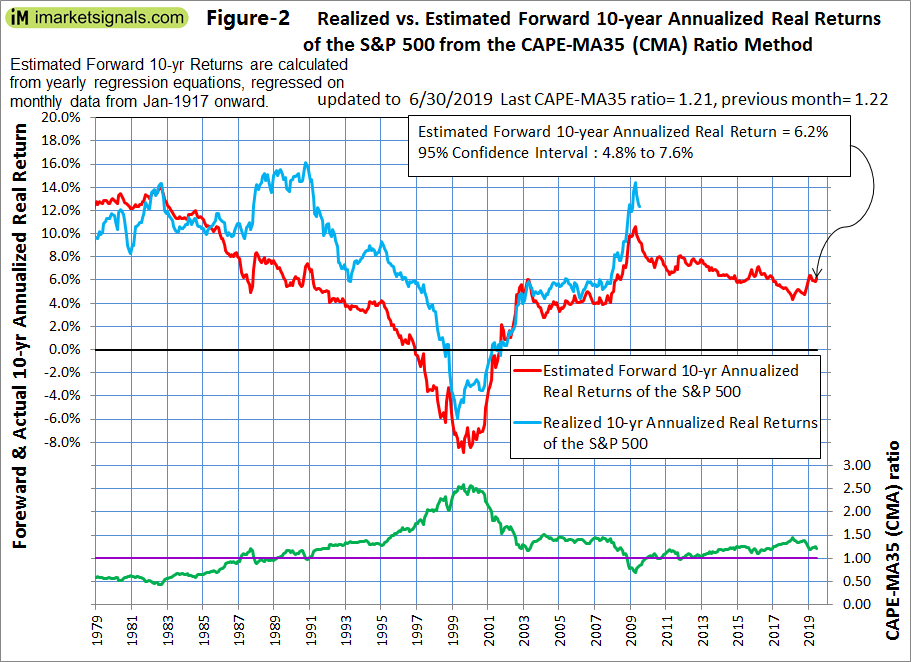
- The CAPE-MA35 ratio is 1.21, forecasting a 10-year annualized real return of 6.2%. This would indicate that for long-term investors the S&P 500 is currently not overvalued.
- Investing in equities for the long-haul when the CAPE-MA35 ratio is below 1.30 should produce reasonable returns as this level of the ratio does not signifies overvaluation of the market.
This is a follow-up article to Estimating Forward 10-Year Stock Market Returns using the Shiller CAPE Ratio and its 35-Year Moving Average, which is referred to as the “referenced article” further down.
Over the last 10 years, since March 2009 the S&P500 with dividends has gained a real 290%. So what further gains can we expect, if any?
Will the bull market continue?
Nobody knows, and the best we can do is to use the historic data (which is from Shiller’s S&P series) to guide us to make estimates for the future. From the real price of the S&P-Composite with dividends re-invested (S&P-real) one finds that the best-fit line from 1871 onward is a straight line when plotted to a semi-log scale. There is no reason to believe that this long-term trend of S&P-real will be interrupted. S&P-real, updated to end of June 2019, and the best fit line together with its 95% prediction bands are shown in Figure-1. (See appendix A for the equation.)
The current level of the S&P-real is above the long-term trend line, and a reversal to the mean trend would entail a 20% decline.
Forecasting 10-year stock market returns with the CAPE-MA35 Ratio
Also shown in Figure-1 are the CAPE (which is the S&P-real divided by the average of the real earnings over the preceding 10 years) and its 35-year moving average, having end of June values of 28.9 and 23.9, respectively.
As discussed in the referenced article, a superior method to the standard use of the Shiller CAPE-ratio is to predict 10-year real returns using the CAPE-MA35 ratio as a valuation measure, which is simply the value of the Shiller CAPE-ratio divided by the corresponding value of its 35-year moving average (28.9 / 23.9 = 1.21).
Currently, for the 10-year period to Jun-2029, the CAPE-MA35 ratio of 1.21 forecasts an annualized real return of 6.2%. For the S&P-real referenced to the current S&P 500 value this would indicating a Jun-2029 value of 5,275, with upper and lower confidence values of 6,000 and 4,600, respectively, all as shown in Figures-2 and -3.
What losses can we expect?
When extending the best fit line and the prediction bands to 2030 (Figure-3) it enables us to estimate the change of S&P-real from the current level of about 2,890. In Jan-2020 the value of S&P-real as indicated by the best fit line should be about 2,340, about 20% lower than where it is now. In Dec- 2028, the value of S&P-real should be about 4,130, while the highest and lowest values shown by the prediction band would be 7,980 and 2,140, respectively.
Thus, the historic trend forecasts a probable gain of about 45% for S&P-real to Dec-2028. The worst scenario would be a possible loss of about 25%, and the best outcome would be a 180% gain from the current level.
Conclusion
The current relatively high CAPE ratio of 28.9 and the elevated level of S&P-real relative to its long-term trend line suggest that the S&P 500 could decline over the shorter term. However, the current CAPE-MA35 ratio of 1.21 still forecasts reasonably good 10-year forward returns for the stock market.
Large drawdowns are always possible during a 10-year look-ahead period. Investments can be protected by following signals from various market-timing models at iMarketSignals. It is also important to know when a recession is looming, because stocks usually do poorly during recession periods. Our Business Cycle Index should provide early warning of an oncoming recession.
Appendix A
The best fit line and prediction band were calculated from monthly data from Jan-1871 to July-2012. The SP-real values for the period after July-2012 are “out of sample” and were not included in the regression analysis.
The equation of the best fit line is y = 10(ax+b)
y = is the dependent variable of the best fit line.
x = are the number of months from January 1871 onwards.
a = 0.0023112648
b = 2.02423522
Hi,
I think I understand why your projected 10year returns are on the high side. While using a 35-year SMA of the CAPE is reasonable to determine under/over valuation, I don’t believe that it is valid to effectively imply as you seem to be doing that the 35-year SMA will correspond to the long-term average returns across the history of the series. By constructing models that have an r-squared of 0.9 (for example the Price/Integrated Earnings published by OSAM), or in Vanguard’s proprietary simulations using their capital markets model, projected *nominal* 10-year returns have a central estimate of ~4% per annum.
Thank you for your comment.
Nowhere is it implied that the 35-year SMA will correspond to the long-term average returns across the history of the series. However, the ratio CAPE/35yr-MA is indicative of forward returns, better than the CAPE-ratio on its own.
Please look at Figure-2. The red graph are the estimated real 10-yr forward returns, and the blue graph are the actual real 10-yr returns. As one can see the estimated returns were on the low side, not on the high side.
In 10 years we will look at this again. Only then will we know whether the model’s forecast was reasonable or not.
Hi,
I believe when you look at the CAPE ratio relative to the 35-yr MA, you are effectively implying that the 35-yr MA is fair value. The long-term mean returns is ~10% nominal, so fair value could be construed to correspond to the long-term returns. As you know, the 35-year SMA deviated from the full history long-term mean only starting in the 80s. So, I believe is not fair to compare CAPE returns relative to the 35-year avg from an earlier era to the relative value now. Vanguard in their 2019 outlook similarly adjust for fair value CAPE over time. They (and I am able to replicate this) get a fair value coincidentally around 24 at this time. They still (and my results are consistent with theirs or the OSAM ones) project 10-year nominal returns of ~4% p.a. I think while you don’t explicitly state that the 35-year SMA corresponds to the long-term average returns, by looking at the relative value independent of the absolute CAPE average, you are implicitly making that assumption.
My estimated 10-year returns come from a regression analysis of the CAPE/MA35 and actual 10-year returns. Shiller’s forecast returns are based on regressing the CAPE itself and actual 10-year returns and have lately been too low.
My current forecast is 6% versus your 4%. None of these forecasts is accurate. We shall see in 2029 what the actual 10-yr return is.
In the meantime a good strategy in my opinion is to follow the Composite Market Timer, or the SuperTimer for higher returns.
My current (central) forecast (and Vanguard’s) is 4% nominal while yours is 6% real, effectively ~4% p.a. over ten years difference at current inflation rates. It is not a classic purely Shiller forecast although it uses the Shiller CAPE as an input. Vanguard’s is a proprietary model simulated with their VCMM simulator. OSAM’s recent article is based on a novel Price/Integrated Earnings, with an r-squared of 0.9, also at 4% nominal. As you also know, all of these methods have a wide spread to make them worthless for timing. But my conclusion from this is that returns over the next decade will be “less than normal” where “normal” is defined as ~6% real. We shall find out in ten years. I place the odds of 6% real at less than 5%, but taking into account fat tails, I’ll call it a less than 10% chance.
In OSAM’s recent article “The Earnings Mirage” when discounting historical reported earnings to undo the estimated 25% average overstatement that has occurred across history he shows a 10-year forward return of 6%, not 4% as you state. So that gets much closer to my current estimate of 6.2% which has a lower 95% confidence limit of 4.8%. So if inflation stays low my estimate and OSAM’s estimate are pretty much the same.
The 4% is the graph before the one you cite which is based on reported earnings but applying the P/IE methodology. Neither your result nor mine nor Vanguard’s is comparable to the subsequent graph showing 6% which uses a different earnings history by inflating past earnings by 25%.
shrinks past earnings by 25% …
Exactly, shrinks past earnings by 25% …
And goes on to say:
To experiment further with the overstated earnings hypothesis, I’m going to discount historical reported earnings to undo the estimated 25% average overstatement that has occurred across history. I’m going to recalculate the P/IE ratio under the discounted numbers, to see if the return correlations improve. As you can see, they become exceptionally tight.
And the forecast 10-yr annualized return becomes 6%, not 4%, which is close to my forecast.