  |
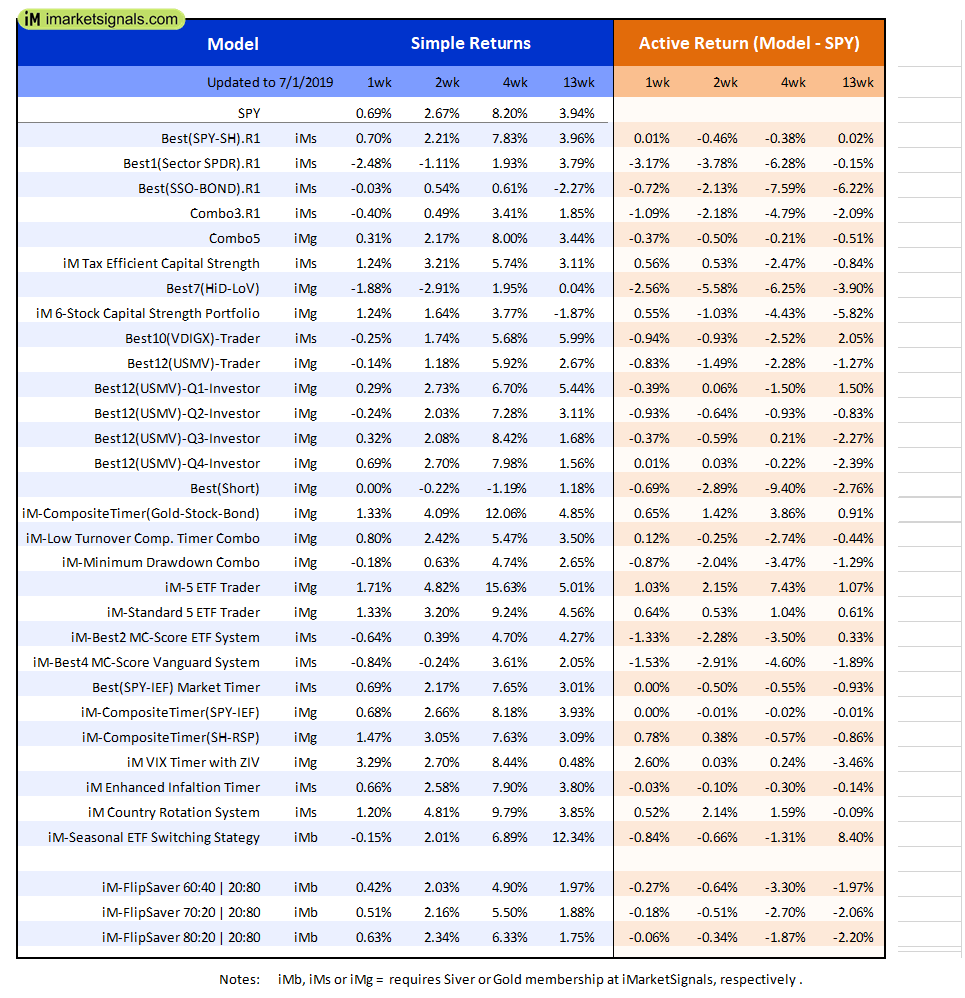
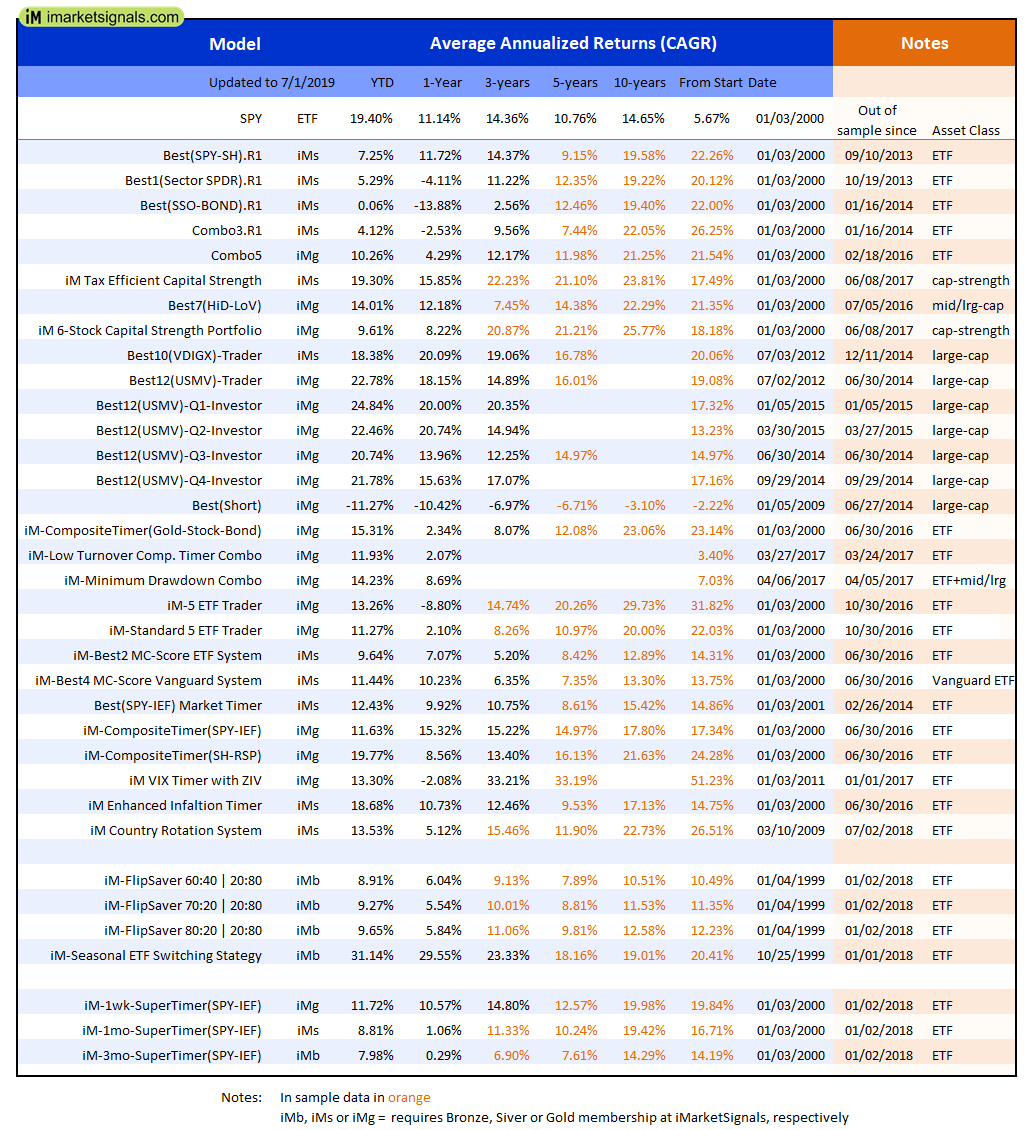
Out of sample performance summary of our models for the past 1, 2, 4 and 13 week periods. The active active return indicates how the models over- or underperformed the benchmark ETF SPY. Also the YTD, and the 1-, 3-, 5- and 10-year annualized returns are shown in the second table |
|
|
iM-FlipSaver 60:40 | 20:80 – 2017: The model’s out of sample performance YTD is 10.0%, and for the last 12 months is 6.4%. Over the same period the benchmark E60B40 performance was 14.0% and 10.2% respectively. Over the previous week the market value of iM-FlipSaver 80:20 | 20:80 gained 0.41% at a time when SPY gained 0.48%. A starting capital of $100,000 at inception on 7/16/2015 would have grown to $123,080 which includes $1,009 cash and excludes $788 spent on fees and slippage. |
|
|
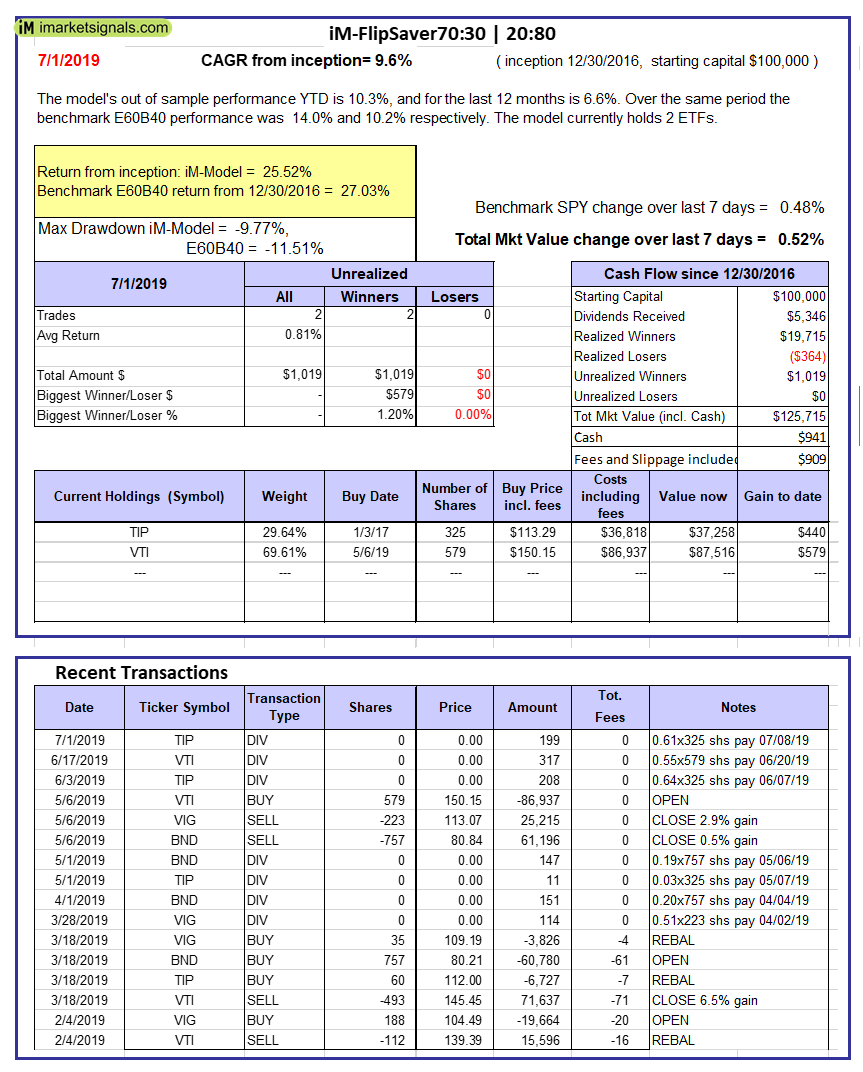
iM-FlipSaver 70:30 | 20:80 – 2017: The model’s out of sample performance YTD is 10.3%, and for the last 12 months is 6.6%. Over the same period the benchmark E60B40 performance was 14.0% and 10.2% respectively. Over the previous week the market value of iM-FlipSaver 70:30 | 20:80 gained 0.52% at a time when SPY gained 0.48%. A starting capital of $100,000 at inception on 7/15/2015 would have grown to $125,715 which includes $941 cash and excludes $909 spent on fees and slippage. |
|
|
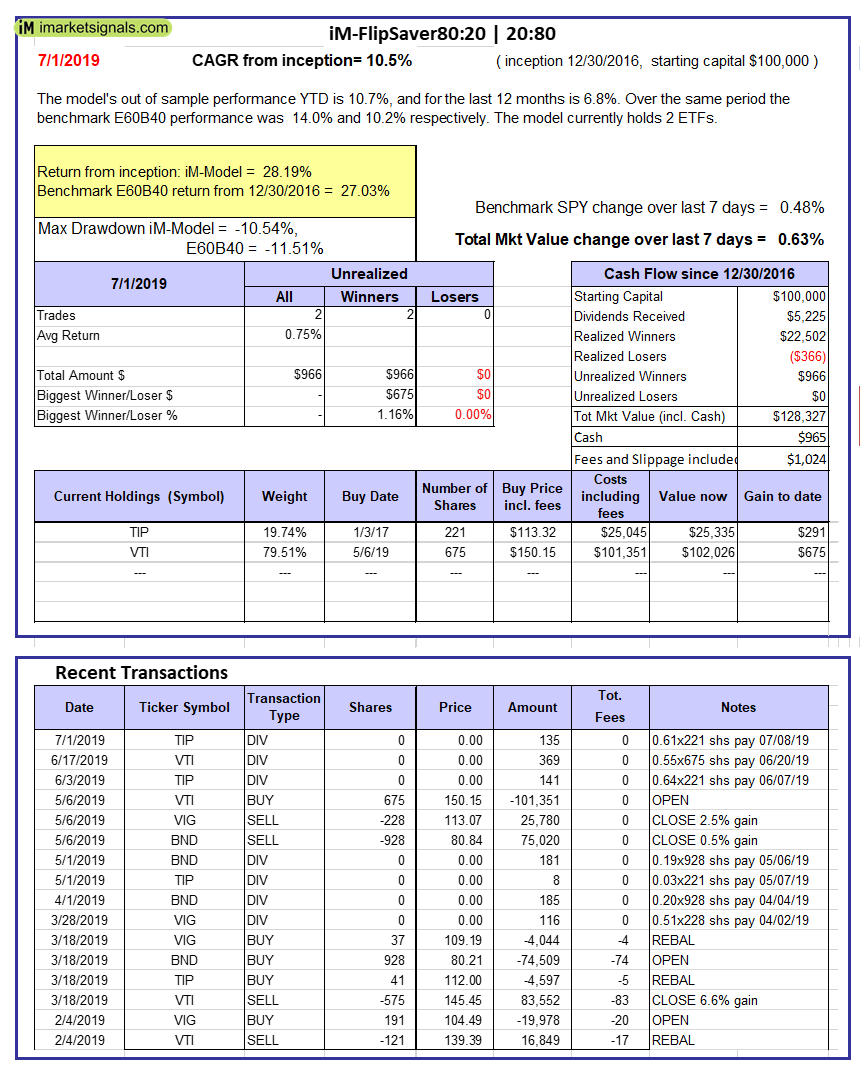
iM-FlipSaver 80:20 | 20:80 – 2017: The model’s out of sample performance YTD is 10.7%, and for the last 12 months is 6.8%. Over the same period the benchmark E60B40 performance was 14.0% and 10.2% respectively. Over the previous week the market value of iM-FlipSaver 80:20 | 20:80 gained 0.63% at a time when SPY gained 0.48%. A starting capital of $100,000 at inception on 1/2/2017 would have grown to $128,327 which includes $965 cash and excludes $1,024 spent on fees and slippage. |
|
|
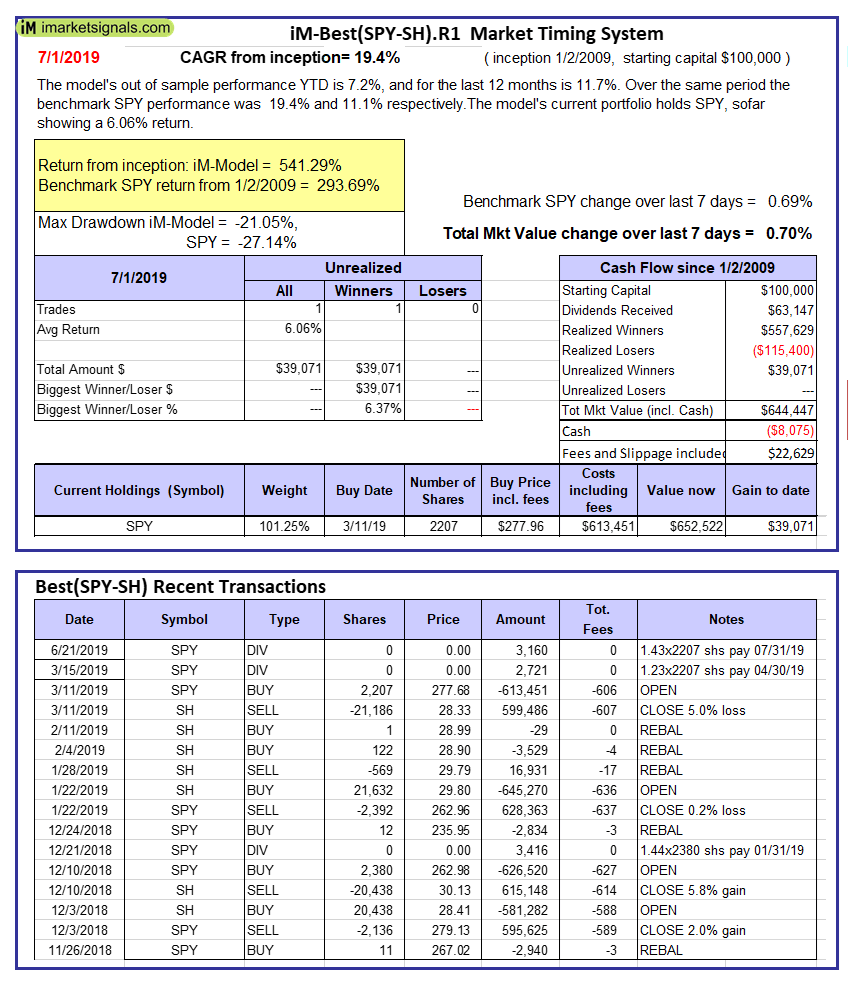
iM-Best(SPY-SH).R1: The model’s out of sample performance YTD is 7.2%, and for the last 12 months is 11.7%. Over the same period the benchmark SPY performance was 19.4% and 11.1% respectively. Over the previous week the market value of Best(SPY-SH) gained 0.70% at a time when SPY gained 0.69%. A starting capital of $100,000 at inception on 1/2/2009 would have grown to $644,447 which includes -$8,075 cash and excludes $22,629 spent on fees and slippage. |
|
|
iM-Combo3.R1: The model’s out of sample performance YTD is 4.2%, and for the last 12 months is -2.5%. Over the same period the benchmark SPY performance was 19.4% and 11.1% respectively. Over the previous week the market value of iM-Combo3.R1 gained -0.61% at a time when SPY gained 0.69%. A starting capital of $100,000 at inception on 2/3/2014 would have grown to $161,531 which includes $1,630 cash and excludes $5,291 spent on fees and slippage. |
|
|
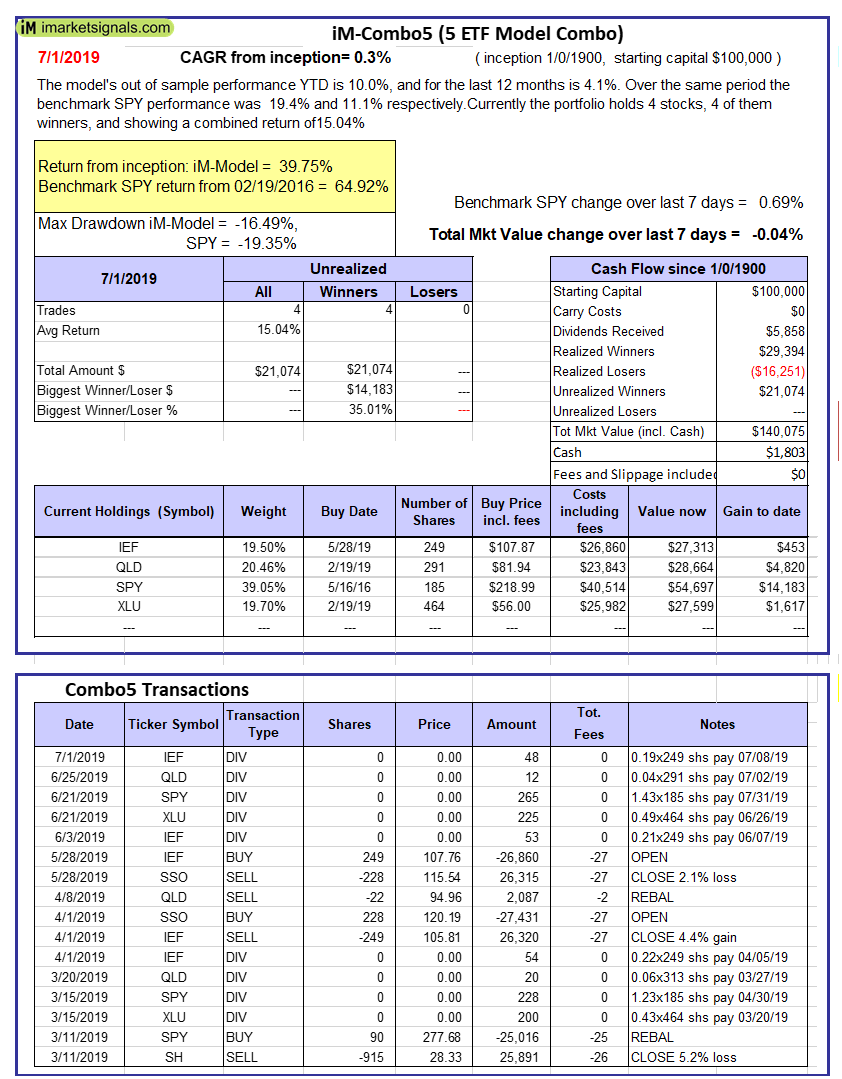
iM-Combo5: The model’s out of sample performance YTD is 10.0%, and for the last 12 months is 4.1%. Over the same period the benchmark SPY performance was 19.4% and 11.1% respectively. Over the previous week the market value of iM-Combo5 gained -0.04% at a time when SPY gained 0.69%. A starting capital of $100,000 at inception on 2/22/2016 would have grown to $140,075 which includes $1,803 cash and excludes $0 spent on fees and slippage. |
|
|
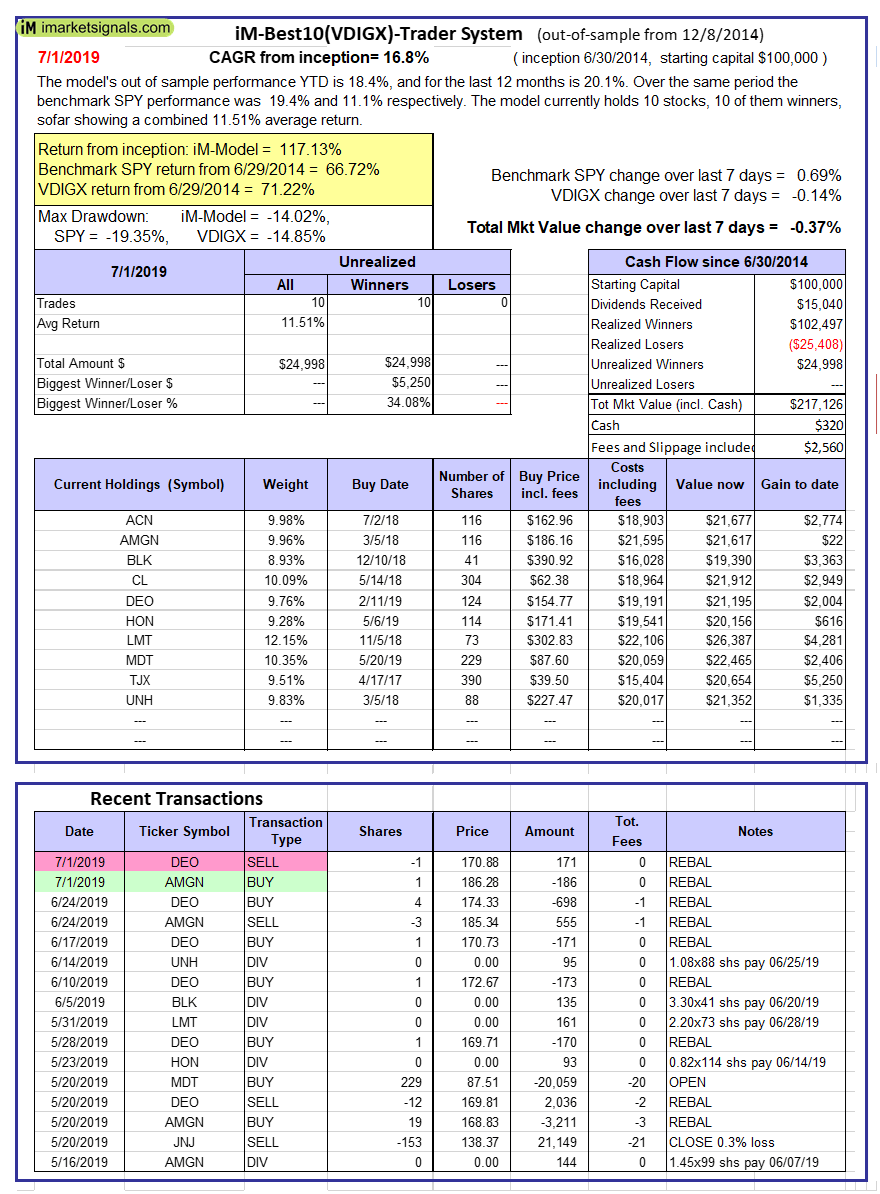
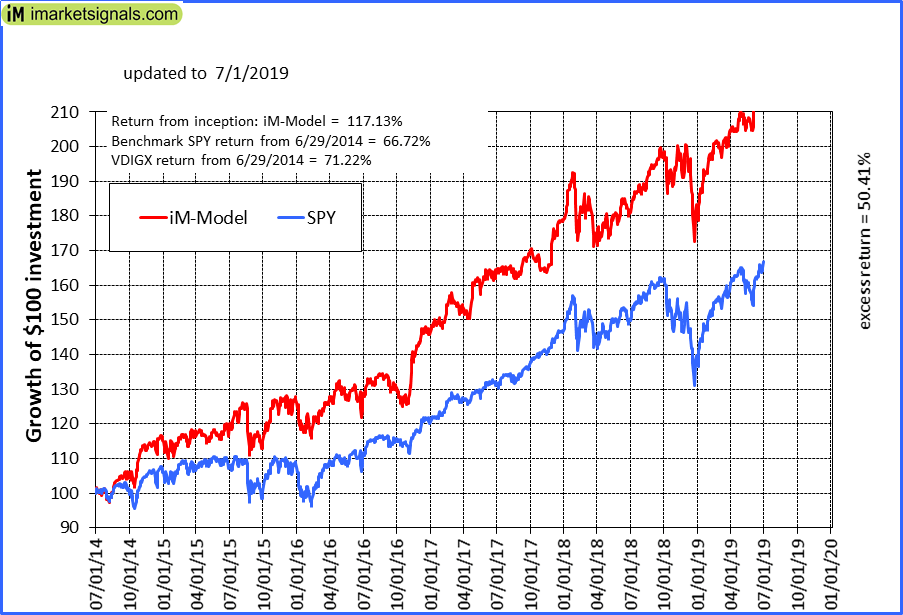
iM-Best10(VDIGX)-Trader: The model’s out of sample performance YTD is 18.4%, and for the last 12 months is 20.1%. Over the same period the benchmark SPY performance was 19.4% and 11.1% respectively. Since inception, on 7/1/2014, the model gained 117.13% while the benchmark SPY gained 66.72% and VDIGX gained 71.22% over the same period. Over the previous week the market value of iM-Best10(VDIGX) gained -0.37% at a time when SPY gained 0.69%. A starting capital of $100,000 at inception on 7/1/2014 would have grown to $217,126 which includes $320 cash and excludes $2,560 spent on fees and slippage. |
|
|
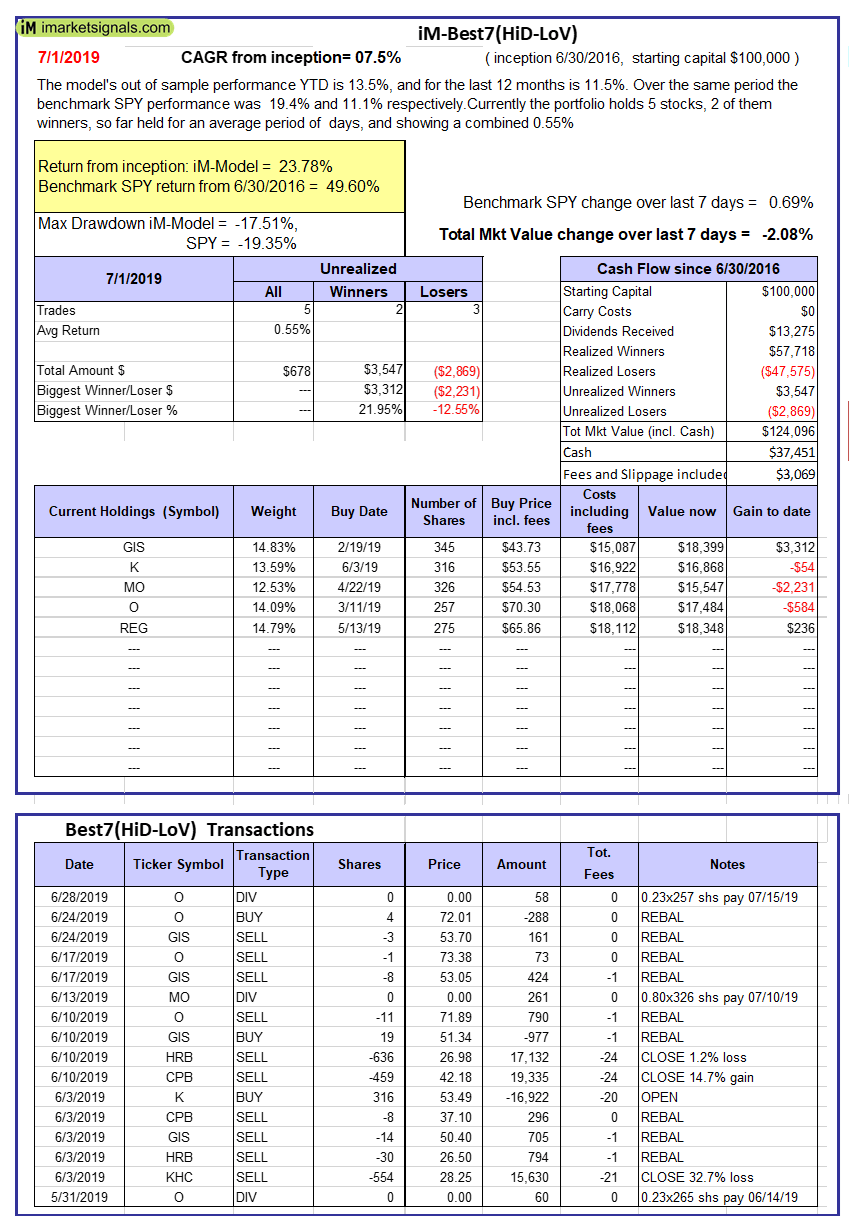
iM-Best7(HiD-LoV): The model’s out of sample performance YTD is 13.5%, and for the last 12 months is 11.5%. Over the same period the benchmark SPY performance was 19.4% and 11.1% respectively. Over the previous week the market value of iM-Best7(HiD-LoV) gained -2.08% at a time when SPY gained 0.69%. A starting capital of $100,000 at inception on 6/30/2016 would have grown to $124,096 which includes $37,451 cash and excludes $3,069 spent on fees and slippage. |
|
|
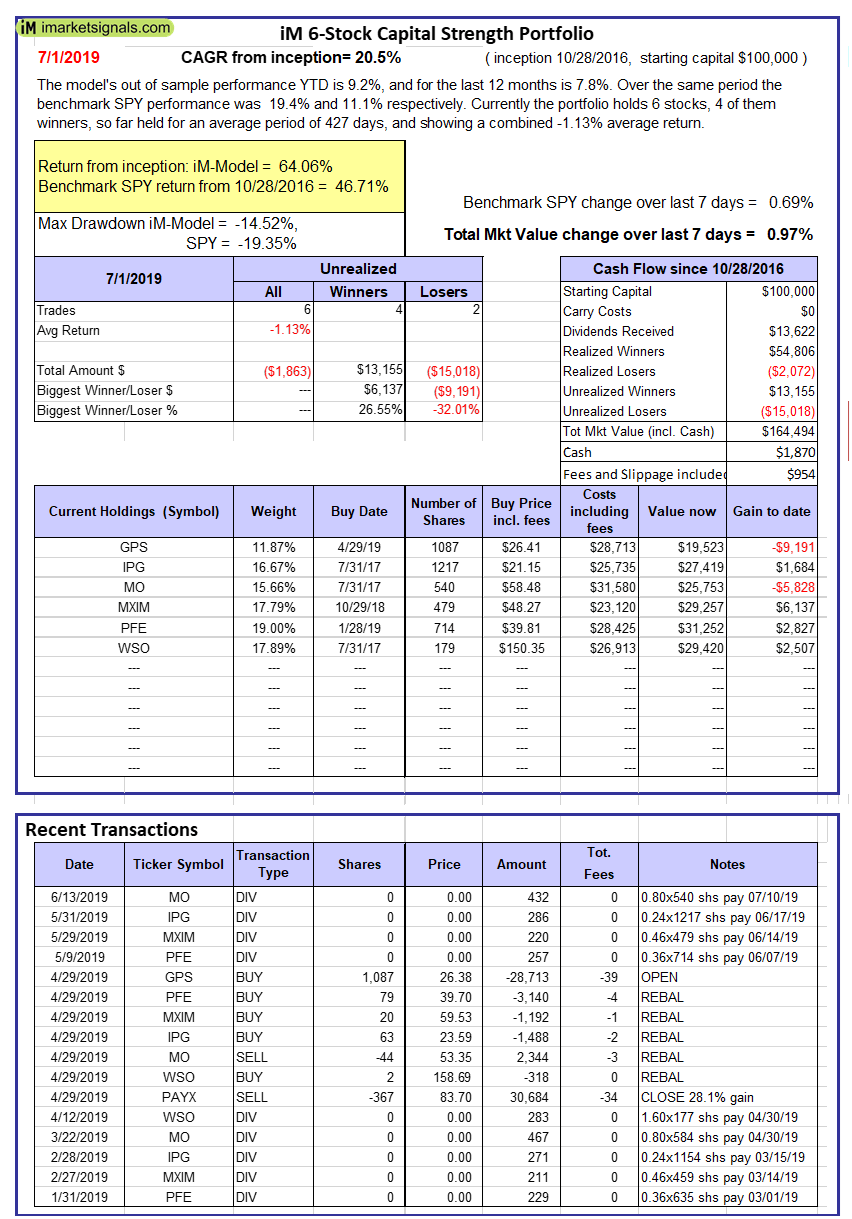
iM 6-Stock Capital Strength Portfolio: The model’s out of sample performance YTD is 9.2%, and for the last 12 months is 7.8%. Over the same period the benchmark SPY performance was 19.4% and 11.1% respectively. Over the previous week the market value of the iM 6-Stock Capital Strength Portfolio gained 0.97% at a time when SPY gained 0.69%. A starting capital of $100,000 at inception on 10/28/2016 would have grown to $164,494 which includes $1,870 cash and excludes $954 spent on fees and slippage. |
|
|
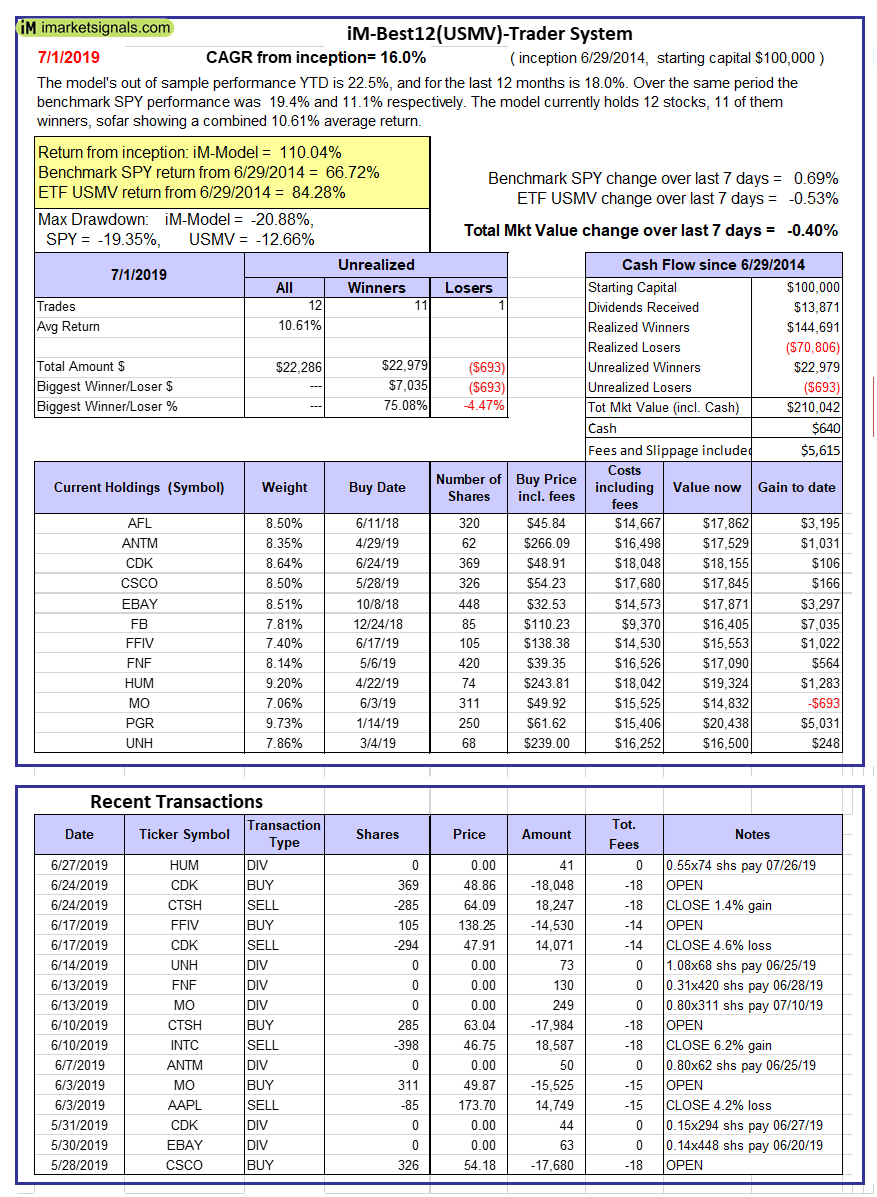
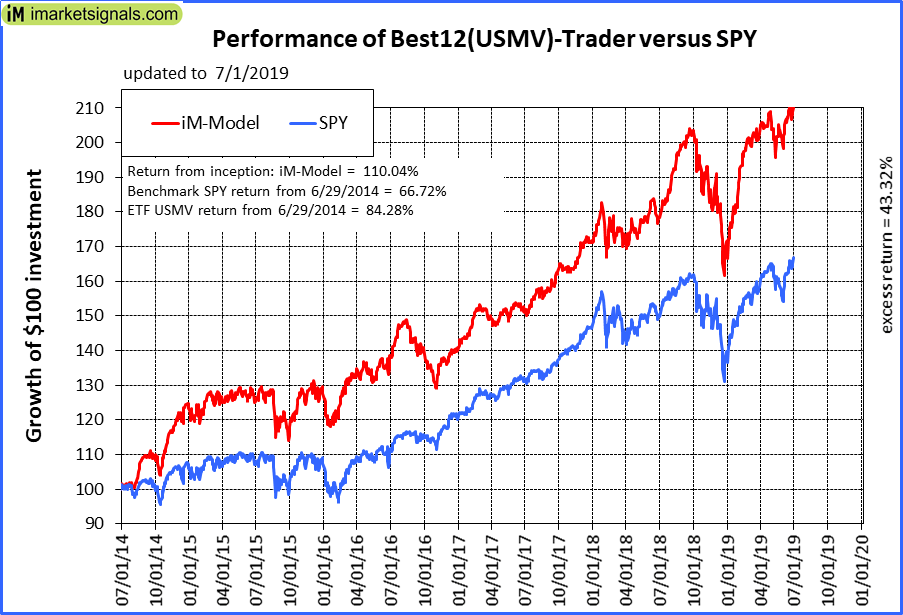
iM-Best12(USMV)-Trader: The model’s out of sample performance YTD is 22.5%, and for the last 12 months is 18.0%. Over the same period the benchmark SPY performance was 19.4% and 11.1% respectively. Since inception, on 6/30/2014, the model gained 110.04% while the benchmark SPY gained 66.72% and the ETF USMV gained 84.28% over the same period. Over the previous week the market value of iM-Best12(USMV)-Trader gained -0.40% at a time when SPY gained 0.69%. A starting capital of $100,000 at inception on 6/30/2014 would have grown to $210,042 which includes $640 cash and excludes $5,615 spent on fees and slippage. |
|
|
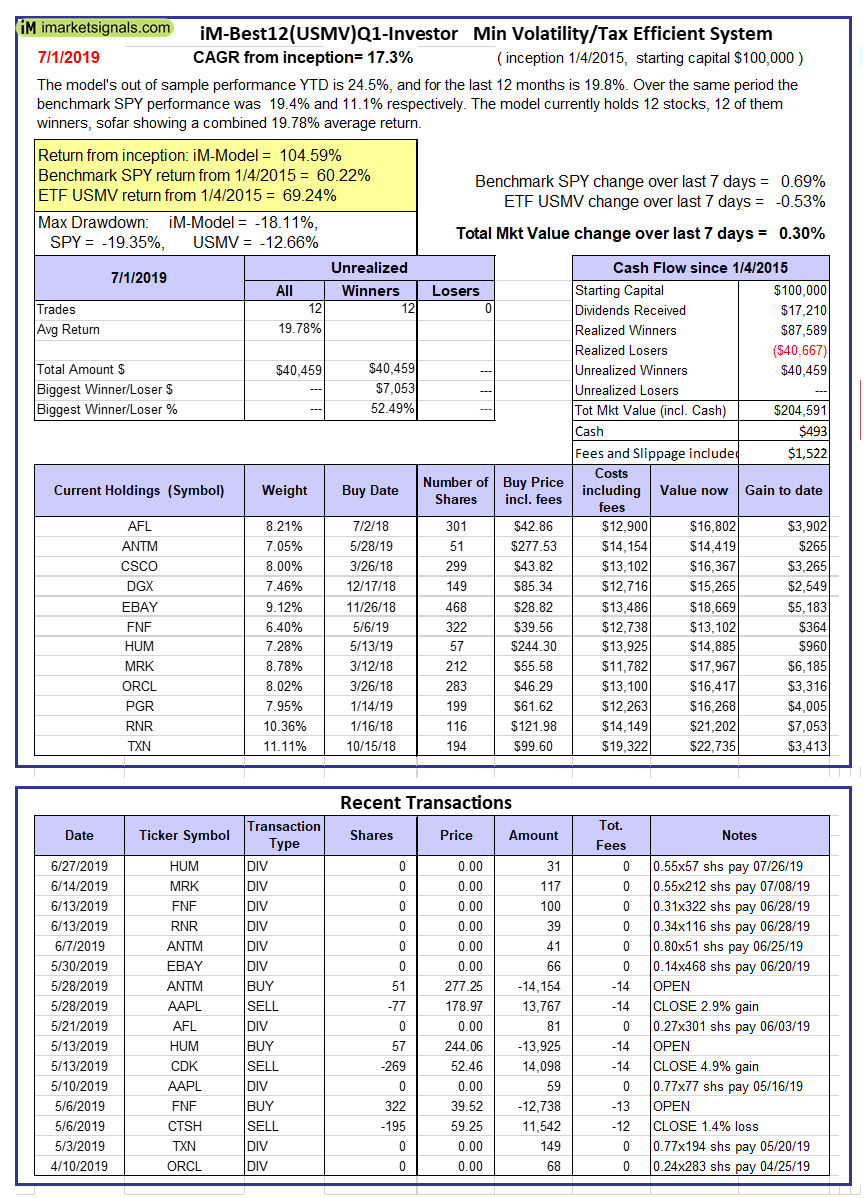
iM-Best12(USMV)Q1-Investor: The model’s out of sample performance YTD is 24.5%, and for the last 12 months is 19.8%. Over the same period the benchmark SPY performance was 19.4% and 11.1% respectively. Since inception, on 1/5/2015, the model gained 104.59% while the benchmark SPY gained 60.22% and the ETF USMV gained 69.24% over the same period. Over the previous week the market value of iM-Best12(USMV)Q1 gained 0.30% at a time when SPY gained 0.69%. A starting capital of $100,000 at inception on 1/5/2015 would have grown to $204,591 which includes $493 cash and excludes $1,522 spent on fees and slippage. |
|
|
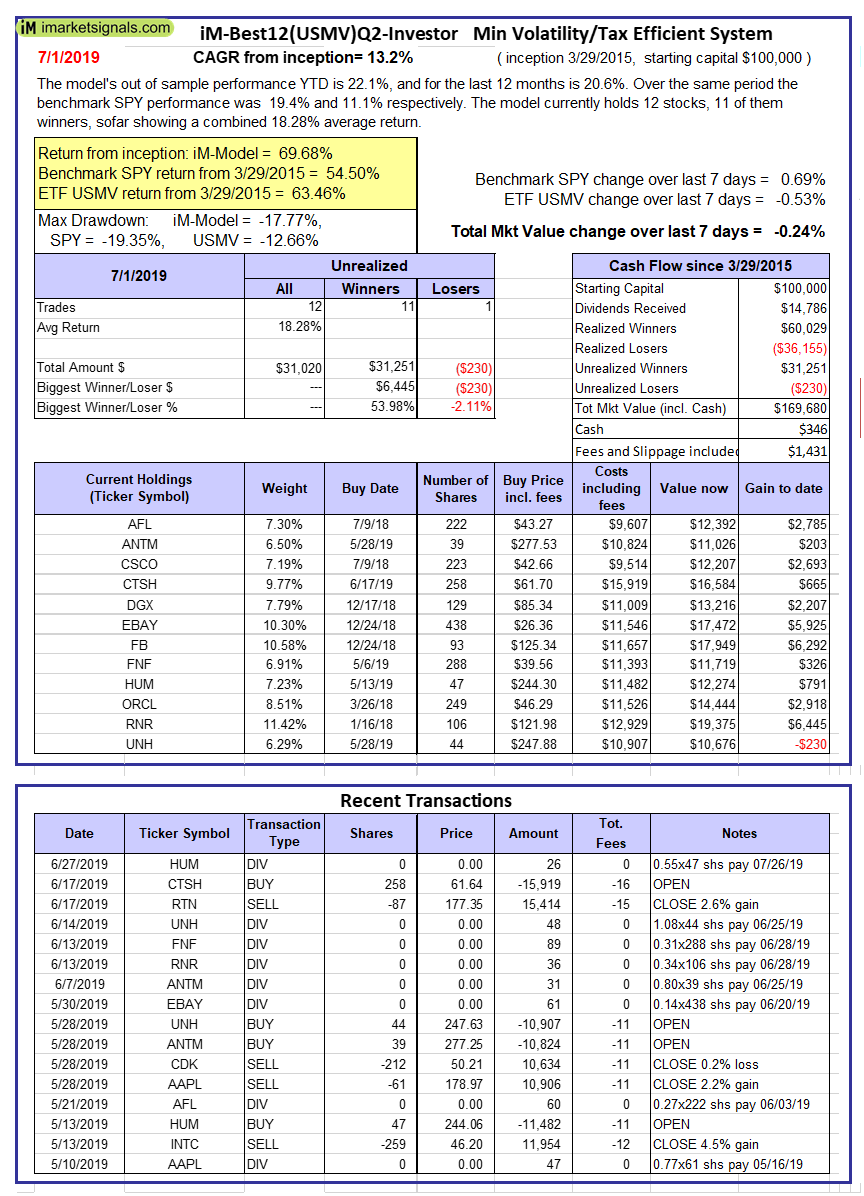
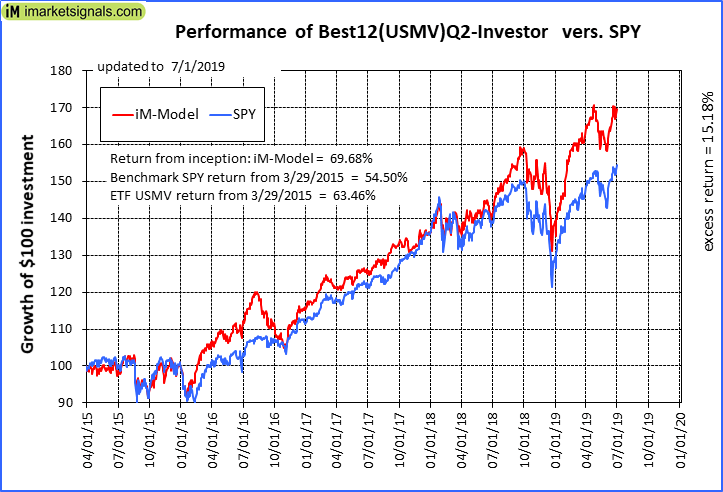
iM-Best12(USMV)Q2-Investor: The model’s out of sample performance YTD is 22.1%, and for the last 12 months is 20.6%. Over the same period the benchmark SPY performance was 19.4% and 11.1% respectively. Since inception, on 3/30/2015, the model gained 69.68% while the benchmark SPY gained 54.50% and the ETF USMV gained 63.46% over the same period. Over the previous week the market value of iM-Best12(USMV)Q2 gained -0.24% at a time when SPY gained 0.69%. A starting capital of $100,000 at inception on 3/30/2015 would have grown to $169,680 which includes $346 cash and excludes $1,431 spent on fees and slippage. |
|
|
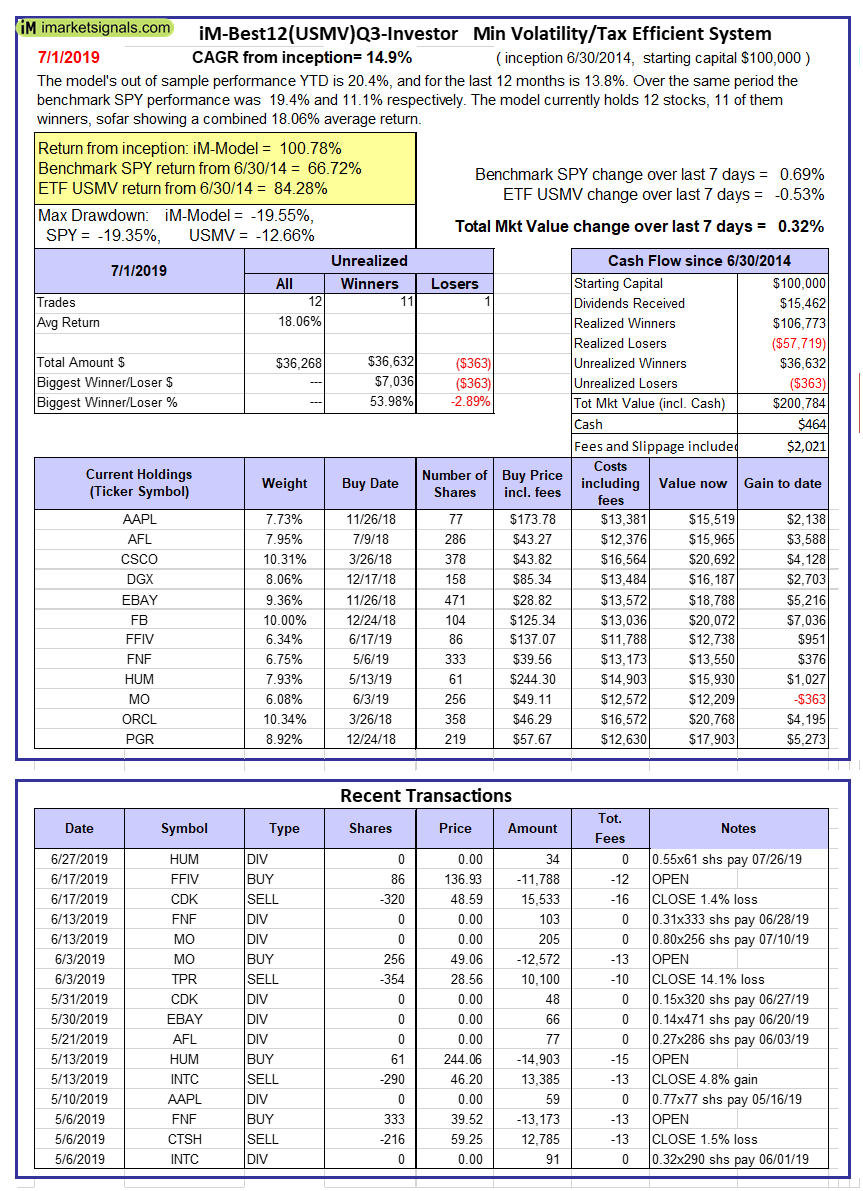
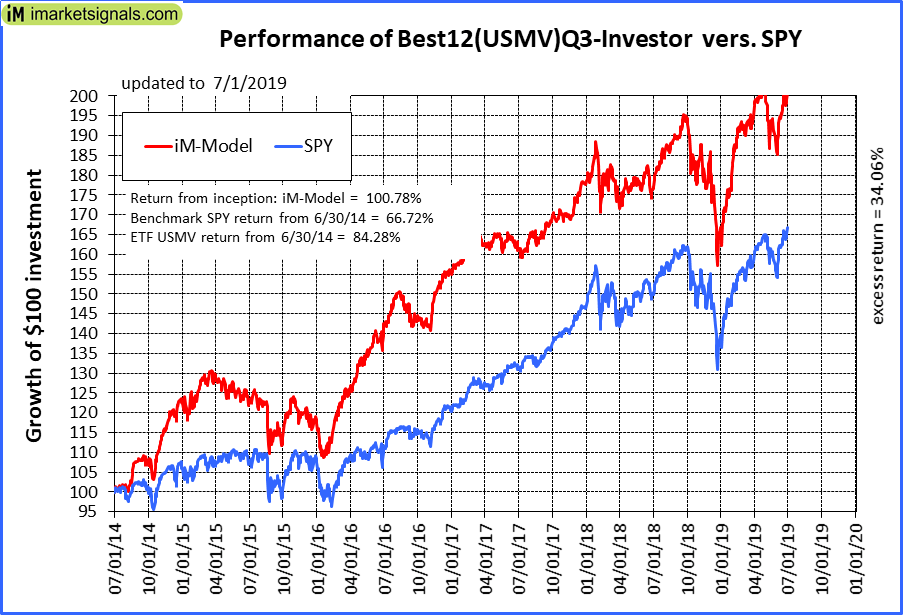
iM-Best12(USMV)Q3-Investor: The model’s out of sample performance YTD is 20.4%, and for the last 12 months is 13.8%. Over the same period the benchmark SPY performance was 19.4% and 11.1% respectively. Since inception, on 7/1/2014, the model gained 100.78% while the benchmark SPY gained 66.72% and the ETF USMV gained 84.28% over the same period. Over the previous week the market value of iM-Best12(USMV)Q3 gained 0.32% at a time when SPY gained 0.69%. A starting capital of $100,000 at inception on 7/1/2014 would have grown to $200,784 which includes $464 cash and excludes $2,021 spent on fees and slippage. |
|
|
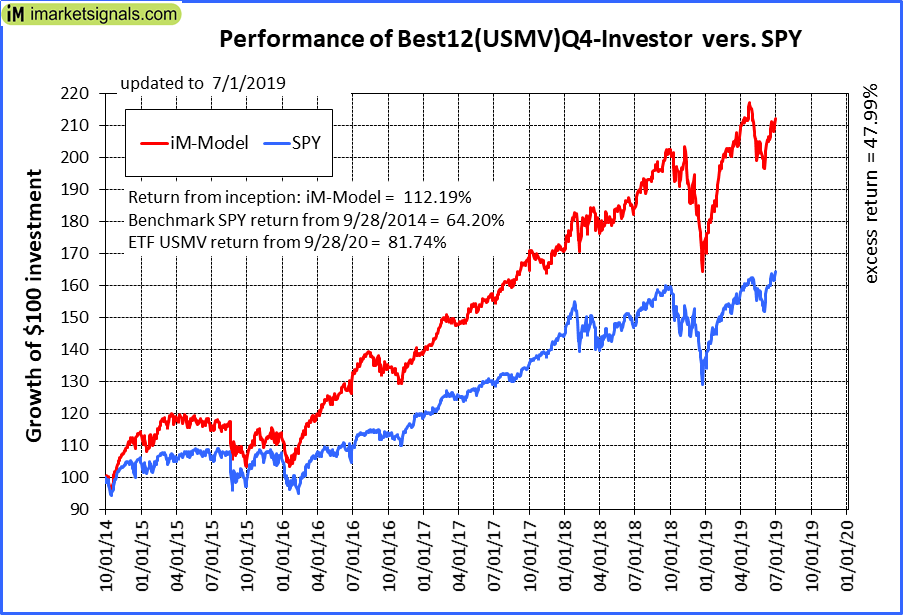
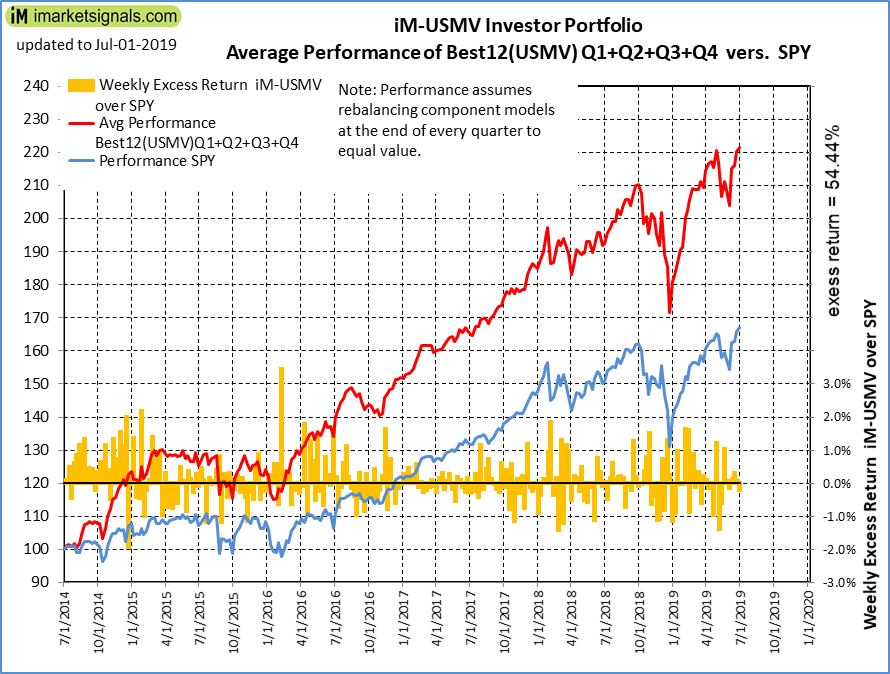
iM-Best12(USMV)Q4-Investor: Since inception, on 9/29/2014, the model gained 112.19% while the benchmark SPY gained 64.20% and the ETF USMV gained 81.74% over the same period. Over the previous week the market value of iM-Best12(USMV)Q4 gained 0.56% at a time when SPY gained 0.69%. A starting capital of $100,000 at inception on 9/29/2014 would have grown to $212,195 which includes $310 cash and excludes $1,870 spent on fees and slippage. |
|
|
Average Performance of iM-Best12(USMV)Q1+Q2+Q3+Q4-Investor resulted in an excess return of 53.31% over SPY. (see iM-USMV Investor Portfolio) |
|
|
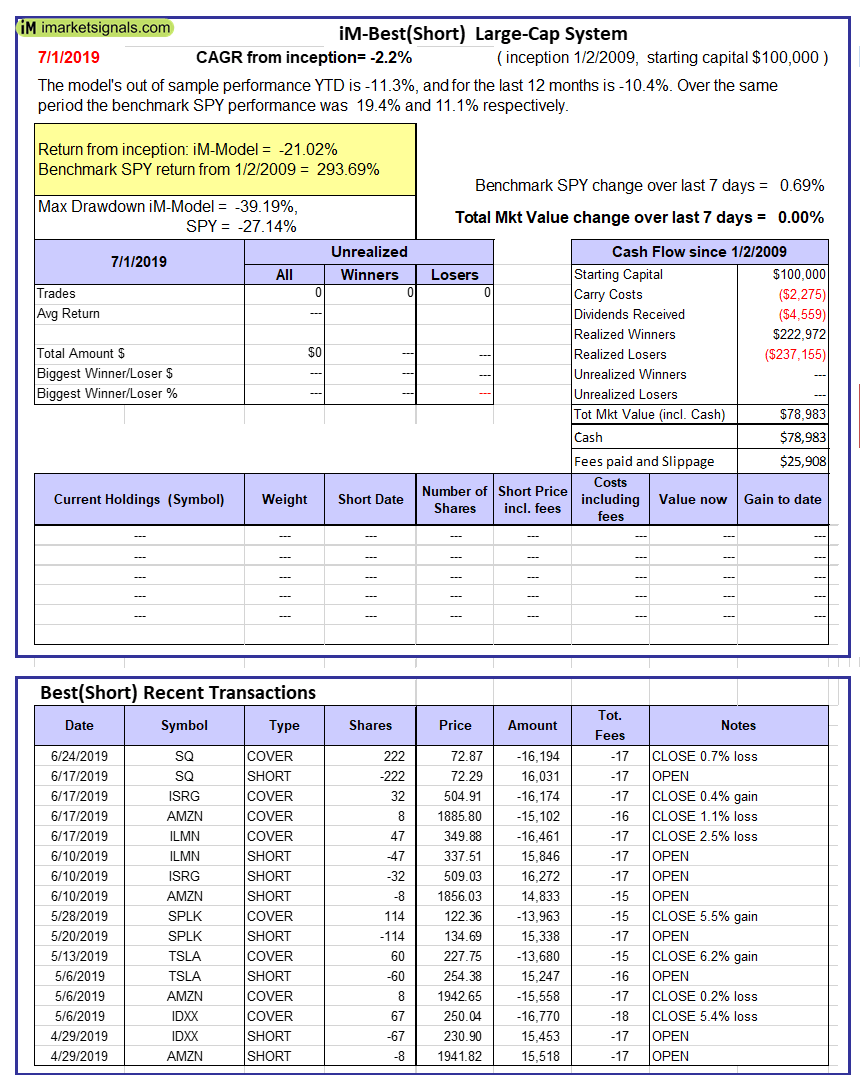
iM-Best(Short): The model’s out of sample performance YTD is -11.3%, and for the last 12 months is -10.4%. Over the same period the benchmark SPY performance was 19.4% and 11.1% respectively. Over the previous week the market value of iM-Best(Short) gained 0.00% at a time when SPY gained 0.69%. Over the period 1/2/2009 to 7/1/2019 the starting capital of $100,000 would have grown to $78,983 which includes $78,983 cash and excludes $25,908 spent on fees and slippage. |
|
|
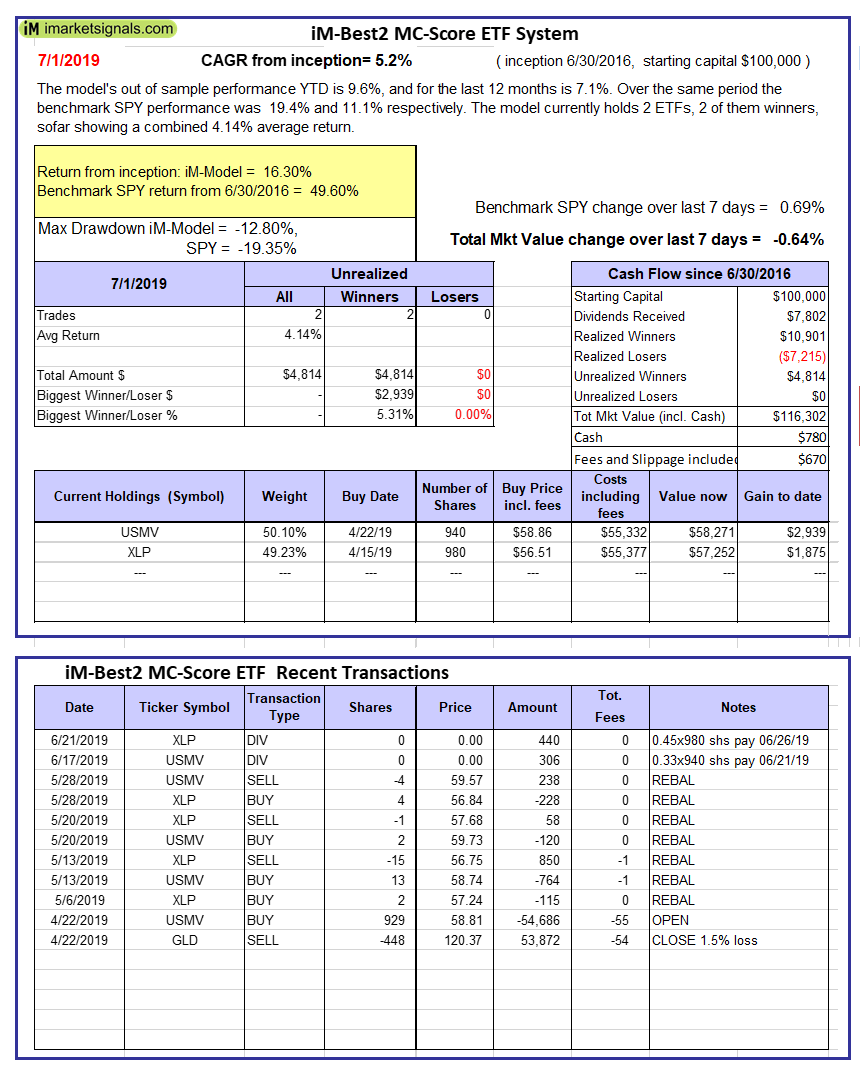
iM-Best2 MC-Score ETF System: The model’s out of sample performance YTD is 9.6%, and for the last 12 months is 7.1%. Over the same period the benchmark SPY performance was 19.4% and 11.1% respectively. Over the previous week the market value of the iM-Best2 MC-Score ETF System gained -0.64% at a time when SPY gained 0.69%. A starting capital of $100,000 at inception on 6/30/2016 would have grown to $116,302 which includes $780 cash and excludes $670 spent on fees and slippage. |
|
|
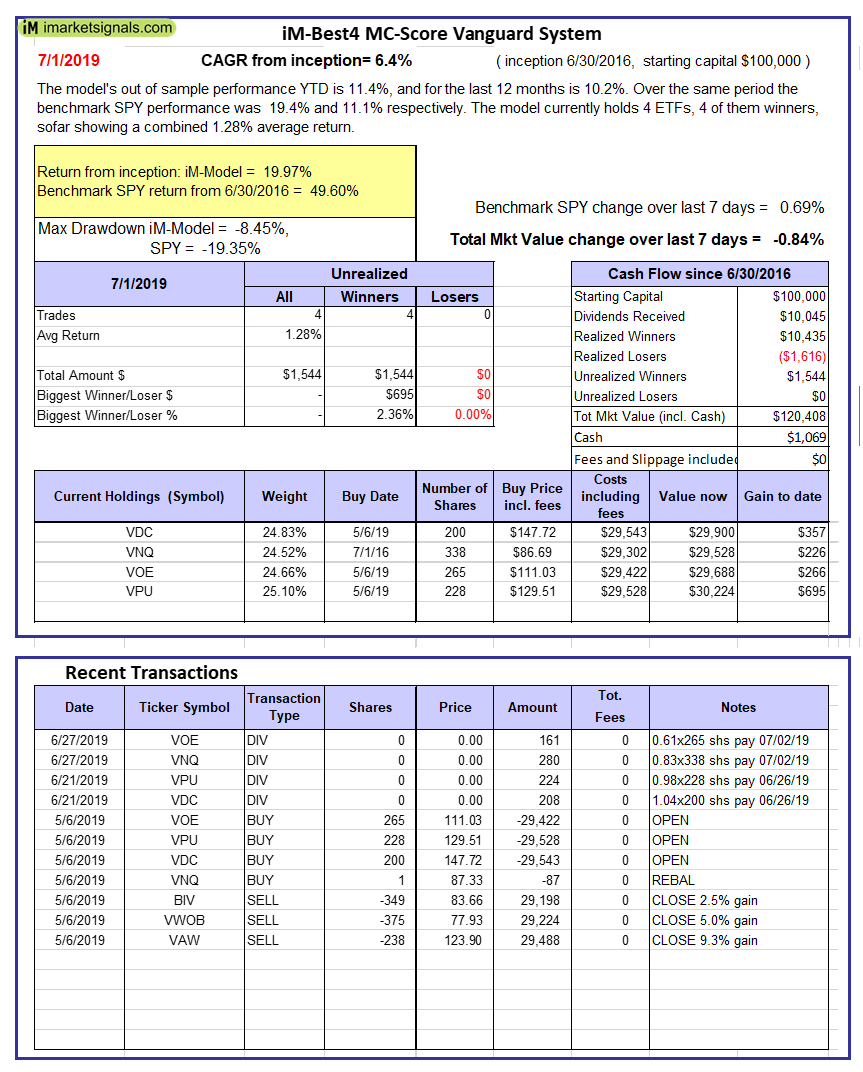
iM-Best4 MC-Score Vanguard System: The model’s out of sample performance YTD is 11.4%, and for the last 12 months is 10.2%. Over the same period the benchmark SPY performance was 19.4% and 11.1% respectively. Over the previous week the market value of the iM-Best4 MC-Score Vanguard System gained -0.84% at a time when SPY gained 0.69%. A starting capital of $100,000 at inception on 6/30/2016 would have grown to $120,408 which includes $1,069 cash and excludes $00 spent on fees and slippage. |
|
|
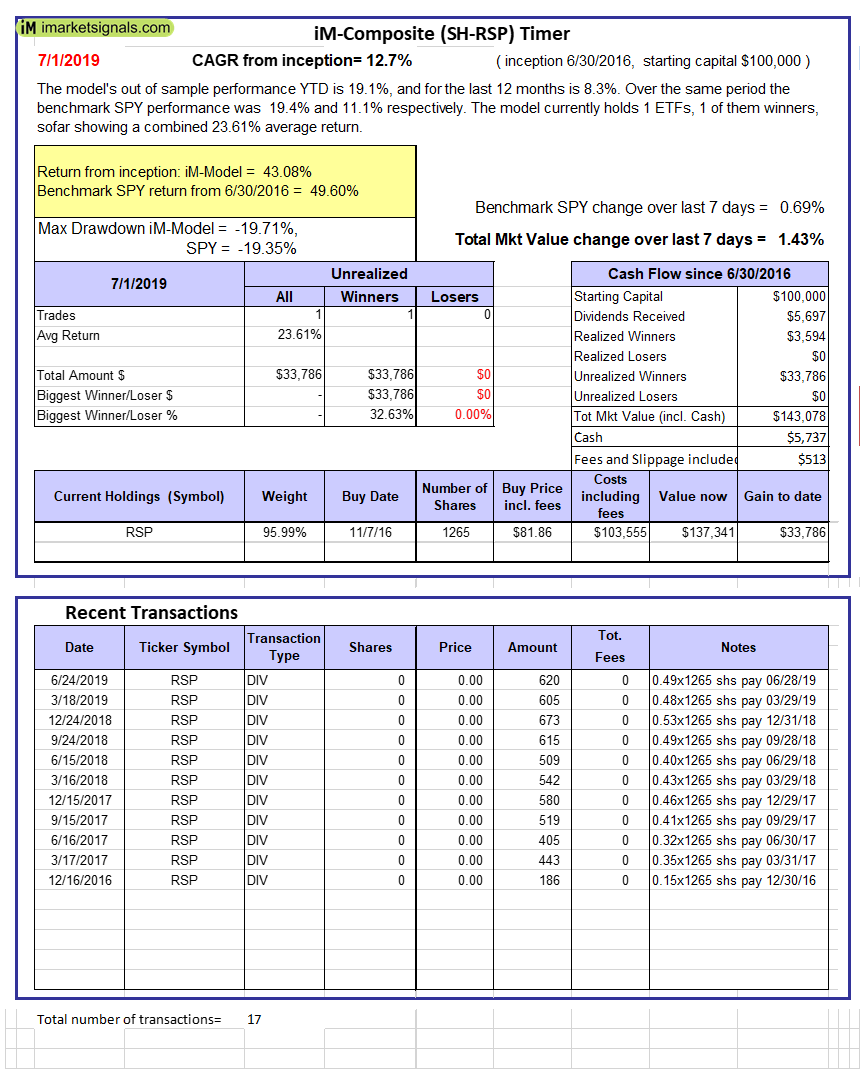
iM-Composite (SH-RSP) Timer: The model’s out of sample performance YTD is 19.1%, and for the last 12 months is 8.3%. Over the same period the benchmark SPY performance was 19.4% and 11.1% respectively. Over the previous week the market value of the iM-Composite (SH-RSP) Timer gained 1.43% at a time when SPY gained 0.69%. A starting capital of $100,000 at inception on 6/30/2016 would have grown to $143,078 which includes $5,737 cash and excludes $513 spent on fees and slippage. |
|
|
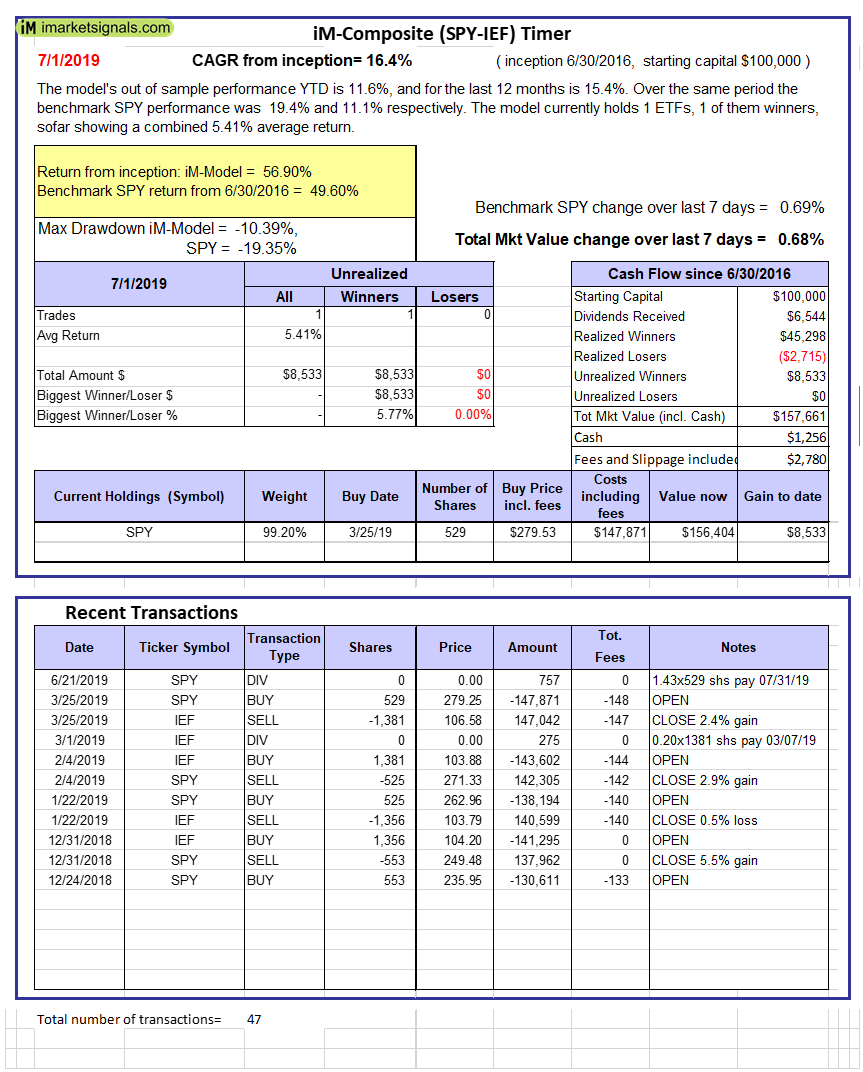
iM-Composite (SPY-IEF) Timer: The model’s out of sample performance YTD is 11.6%, and for the last 12 months is 15.4%. Over the same period the benchmark SPY performance was 19.4% and 11.1% respectively. Over the previous week the market value of the iM-Composite (SPY-IEF) Timer gained 0.68% at a time when SPY gained 0.69%. A starting capital of $100,000 at inception on 6/30/2016 would have grown to $157,661 which includes $1,256 cash and excludes $2,780 spent on fees and slippage. |
|
|
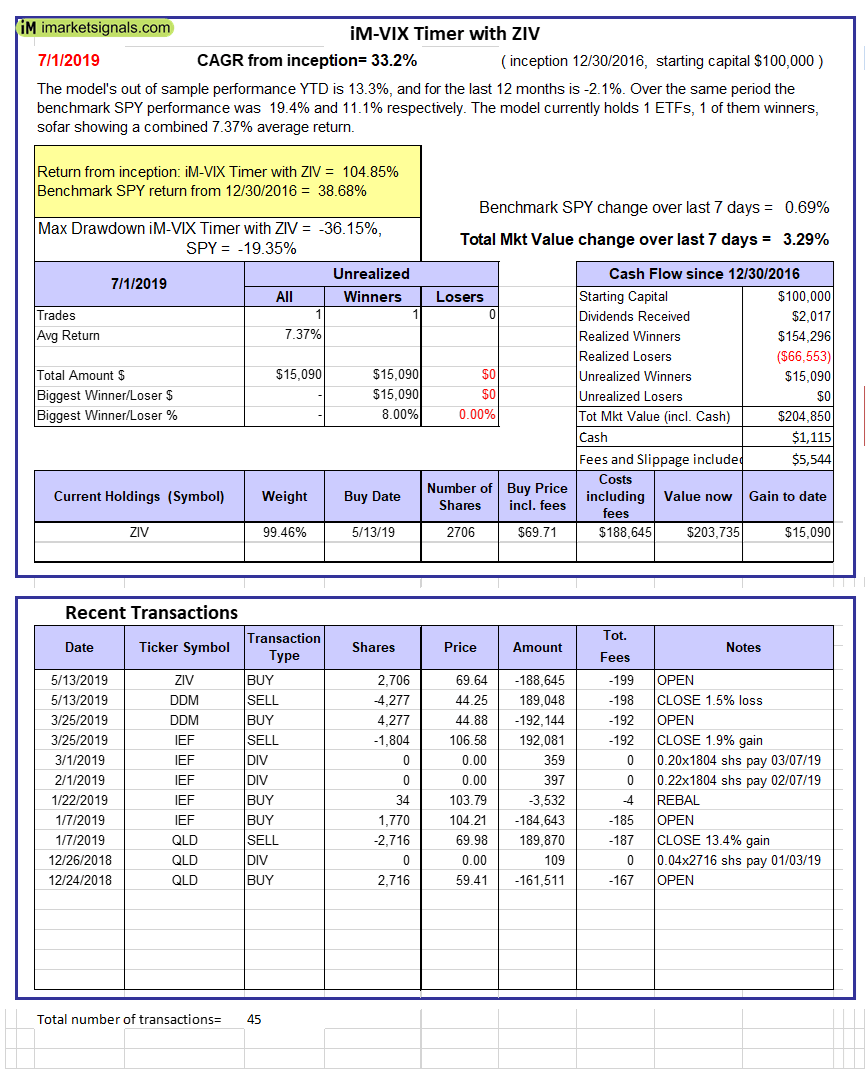
iM-VIX Timer with ZIV: The model’s out of sample performance YTD is 13.3%, and for the last 12 months is -2.1%. Over the same period the benchmark SPY performance was 19.4% and 11.1% respectively. Over the previous week the market value of the iM-VIX Timer with ZIV gained 3.29% at a time when SPY gained 0.69%. A starting capital of $100,000 at inception on 6/30/2016 would have grown to $204,850 which includes $1,115 cash and excludes $5,544 spent on fees and slippage. |
|
|
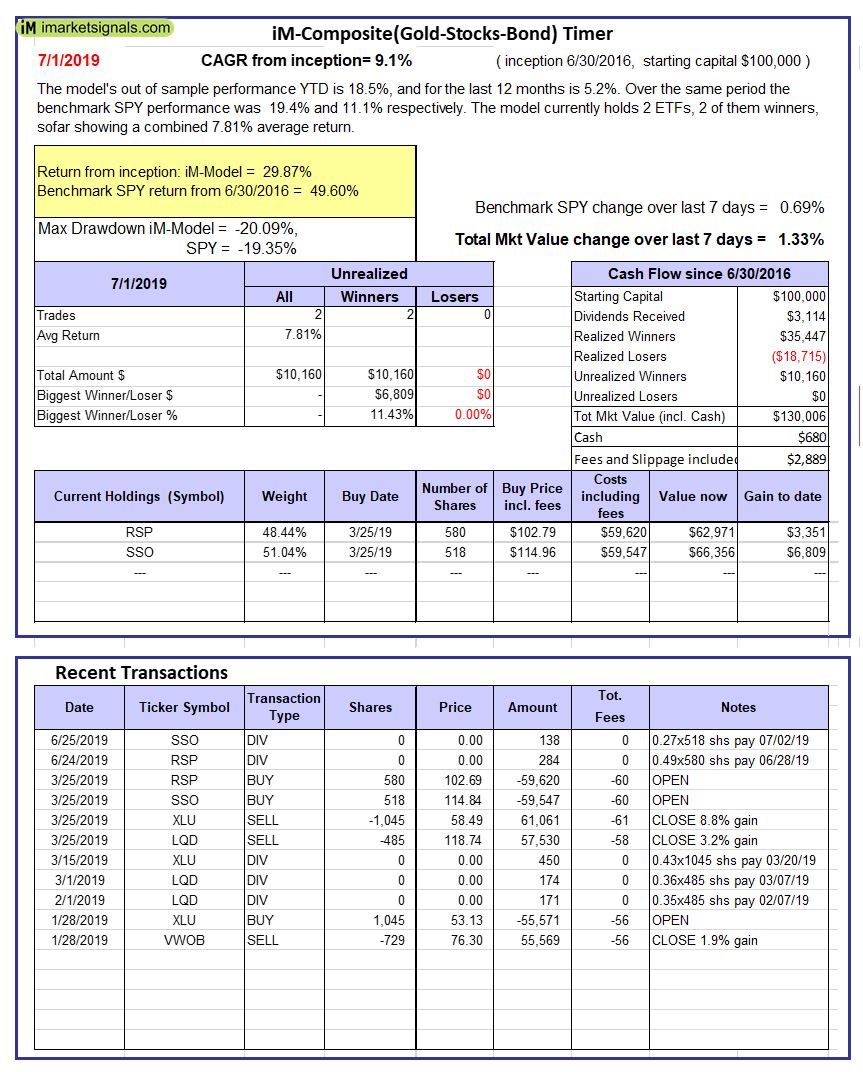
iM-Composite(Gold-Stocks-Bond) Timer: The model’s out of sample performance YTD is 18.5%, and for the last 12 months is 5.2%. Over the same period the benchmark SPY performance was 19.4% and 11.1% respectively. Over the previous week the market value of the iM-Composite(Gold-Stocks-Bond) Timer gained 1.33% at a time when SPY gained 0.69%. A starting capital of $100,000 at inception on 6/30/2016 would have grown to $130,006 which includes $680 cash and excludes $2,889 spent on fees and slippage. |
|
|
iM-Low Turnover Composite Timer Combo: The model’s out of sample performance YTD is 11.9%, and for the last 12 months is 2.1%. Over the same period the benchmark SPY performance was 19.4% and 11.1% respectively. Over the previous week the market value of the iM-Low Turnover Composite Timer Combo gained 0.80% at a time when SPY gained 0.69%. A starting capital of $100,000 at inception on 3/24/27 would have grown to $107,842 which includes $517 cash and excludes $887 spent on fees and slippage. |
|
|
iM-Min Drawdown Combo: The model’s out of sample performance YTD is 14.2%, and for the last 12 months is 8.7%. Over the same period the benchmark SPY performance was 19.4% and 11.1% respectively. Over the previous week the market value of the iM-Min Drawdown Combo gained -0.18% at a time when SPY gained 0.69%. A starting capital of $100,000 at inception on 4/5/2017 would have grown to $116,486 which includes $11,953 cash and excludes $1,058 spent on fees and slippage. |
|
|
iM-5ETF Trader (includes leveraged ETFs): The model’s out of sample performance YTD is 12.9%, and for the last 12 months is -9.0%. Over the same period the benchmark SPY performance was 19.4% and 11.1% respectively. Over the previous week the market value of the iM-5ETF Trader (includes leveraged ETFs) gained 1.71% at a time when SPY gained 0.69%. A starting capital of $100,000 at inception on 10/30/2016 would have grown to $156,401 which includes $634 cash and excludes $2,795 spent on fees and slippage. |
|
|
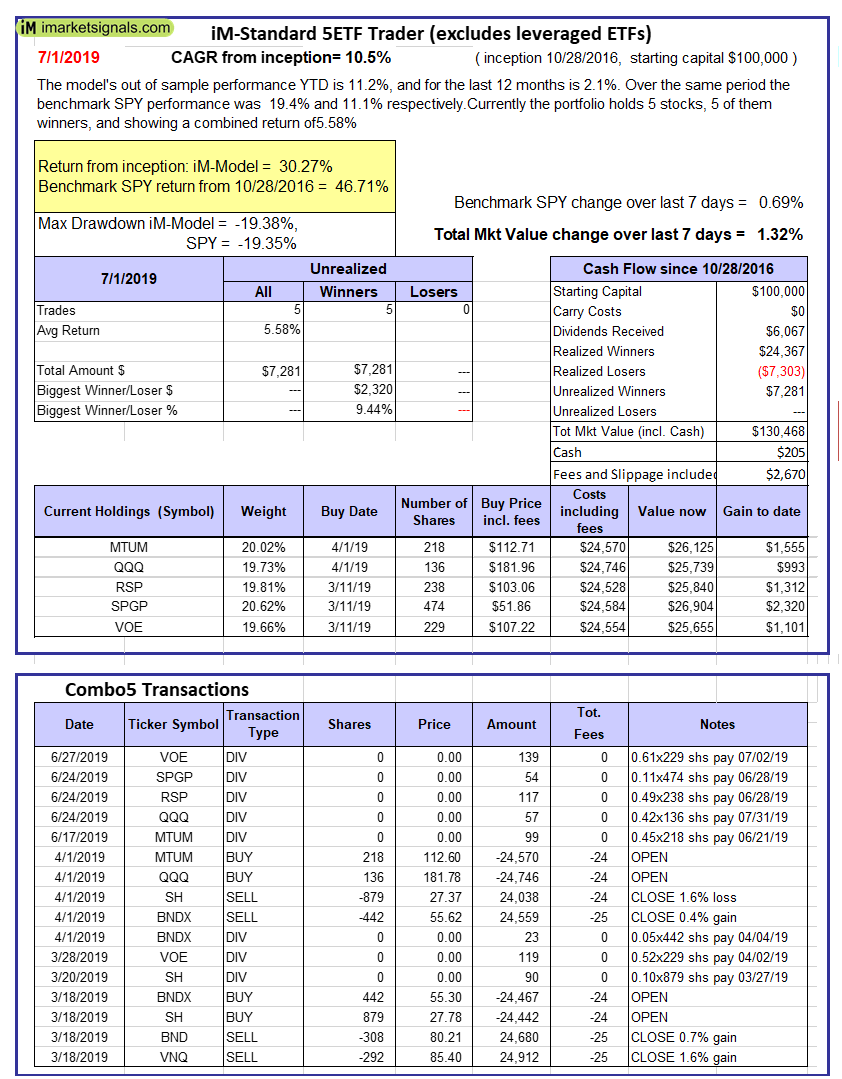
iM-Standard 5ETF Trader (excludes leveraged ETFs): The model’s out of sample performance YTD is 11.2%, and for the last 12 months is 2.1%. Over the same period the benchmark SPY performance was 19.4% and 11.1% respectively. Over the previous week the market value of the iM-Standard 5ETF Trader (excludes leveraged ETFs) gained 1.32% at a time when SPY gained 0.69%. A starting capital of $100,000 at inception on 10/30/2016 would have grown to $130,468 which includes $205 cash and excludes $2,670 spent on fees and slippage. |


Leave a Reply
You must be logged in to post a comment.