
Please also refer to https://imarketsignals.com/im-flipsavers/
Rev 1. Responding to user comments, and to reduce drawdowns in down-market periods, we changed all models to hold 20% stocks and 80% Bonds in down-market conditions.
In order to simplify retirement investment we are replacing our iM-Vanguard/TIAA-CREF Systems (updated monthly) with three iM-FlipSaver Models (updated weekly).
Prudent investors have assets allocated to both bonds and stocks. This conservative strategy is found in the Vanguard LifeStrategy Funds that invest statically in bonds and stocks and also in Life-Cycle/Target-Date Retirement Funds.
Instead of a static bond/stock ratio, these models change allocation in accordance with stock market conditions; e.g. during up-market periods the models hold more stocks than bonds, and during down-market periods the allocation “flips” to holding less stocks than bonds. This should improve performance and reduce drawdowns.
The required market timing to signal flipping comes from a combination of our Composite Market Timer and a momentum timer based on the movement of the S&P 500 index.
To reduce turnover and to facilitate mutual fund investments the models hold positions longer than 45 days.
Asset Allocations
The nominal asset allocations for the three models are:
Up market:
|
Down market:
|
Assets used (ETFs or Mutual Funds)
Stock Funds:
- Vanguard Total Stock Market Index ETF (VTI) or Mutual Fund (VSMPX)
- Vanguard Dividend Appreciation ETF (VIG) or Mutual Fund (VDADX)
Bond Funds:
- Vanguard Total Bond Market Index ETF (BND) or Mutual Fund (VBTIX)
- iShares TIPS Bond ETF (TIP) or Vanguard Inflation-Protected Securities Fund (VIPIX)
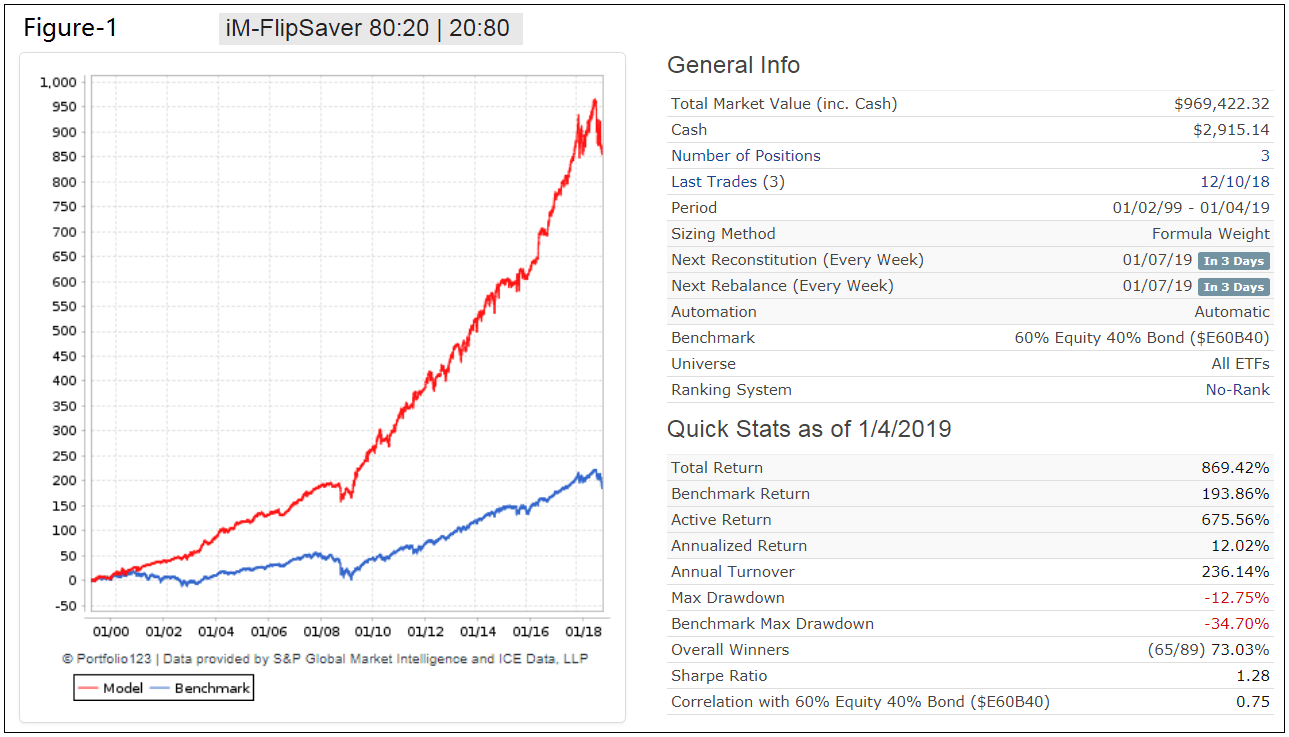
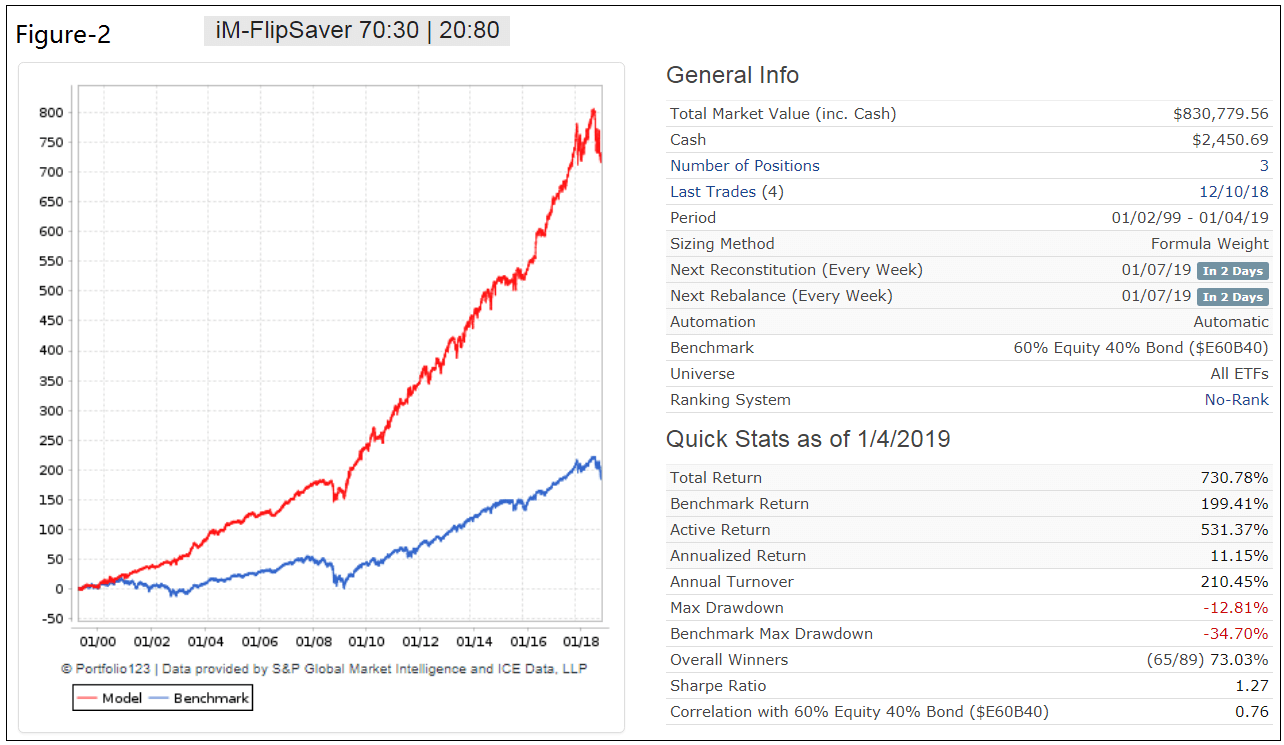
Simulated Performance Jan-1999 to Dec-2018
The backtests (over a 20 year period) were performed on the on-line simulation platform Portfolio 123 which also provides extended data prior to ETFs’ inception dates calculated from the ETFs’ proxies. The starting capital was assumed to be $100,000, and trading costs of 0.1% of every trade amount were taken into account in the simulated returns.
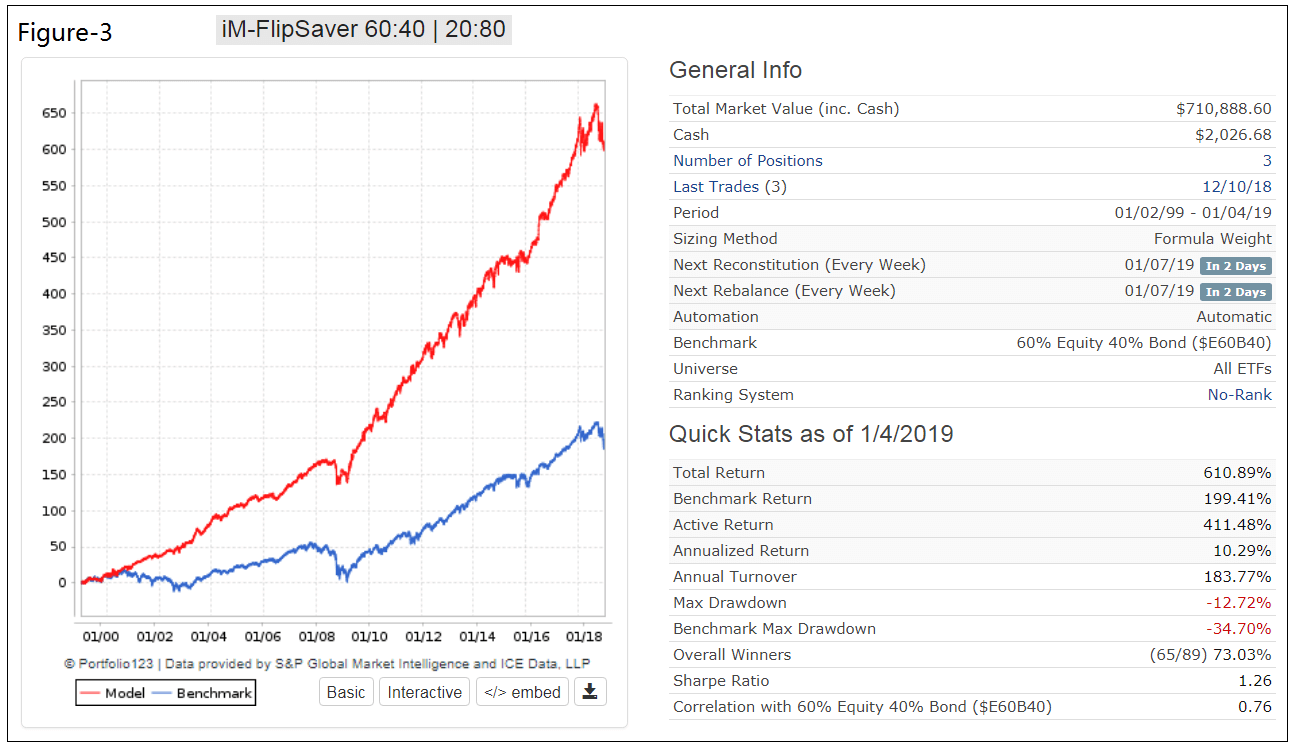
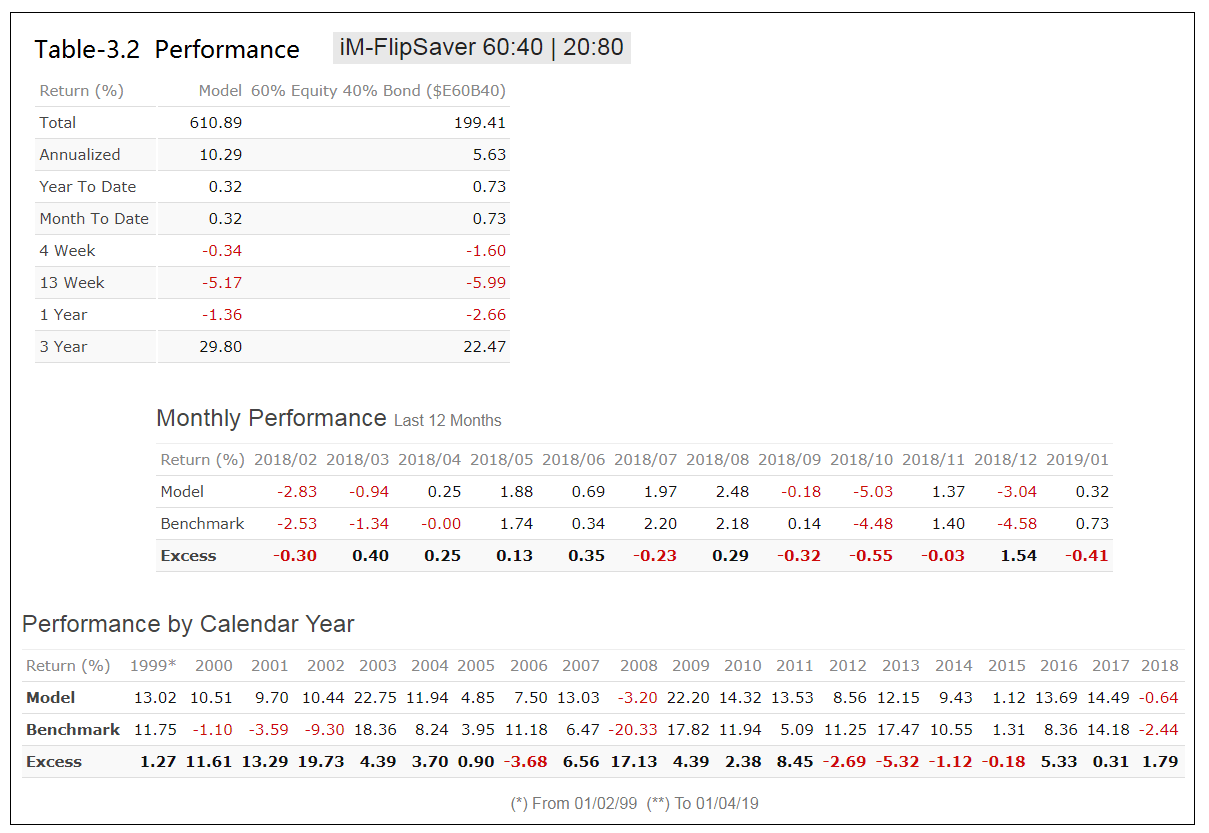
Figures-1, -2, and -3 show the simulated performance of the three FlipSaver models to Dec-15-2018.
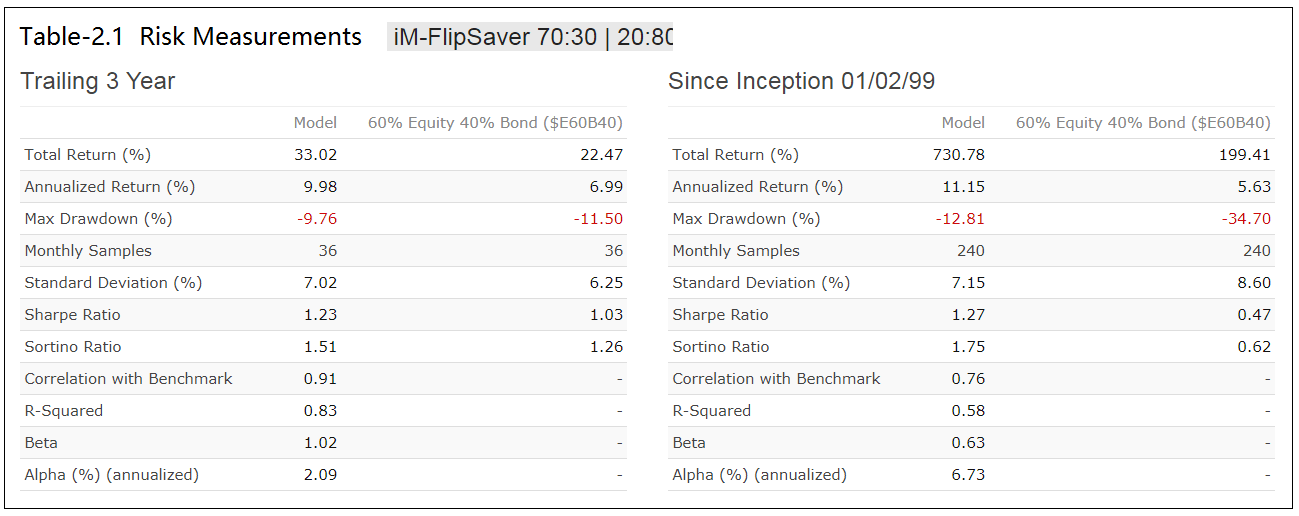
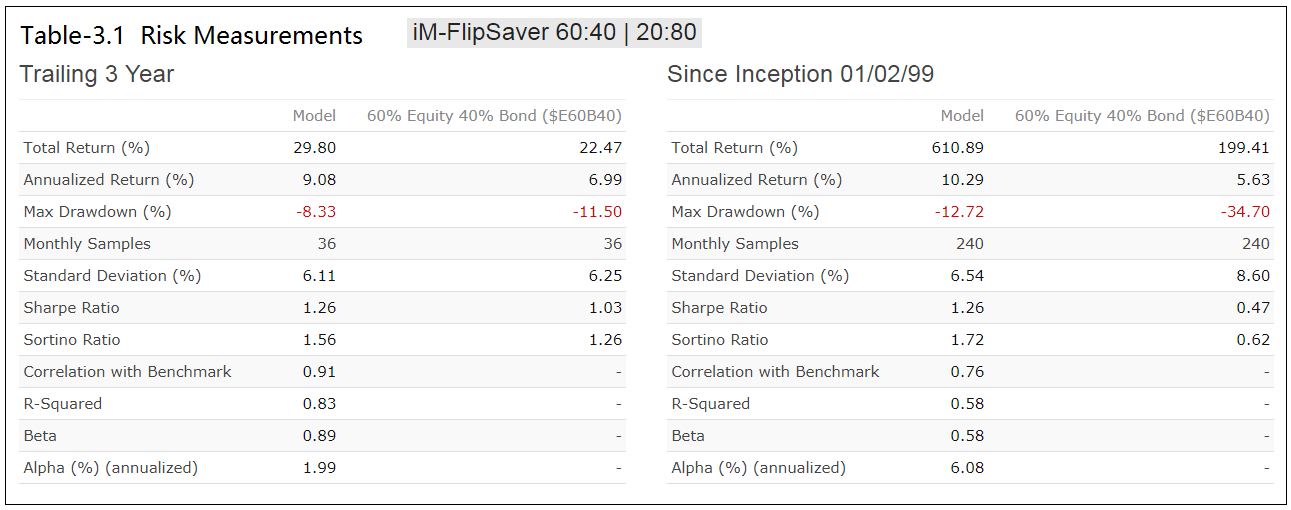
Tables-1.1, -2.1, and -3.1 provide the corresponding Risk Measurements.
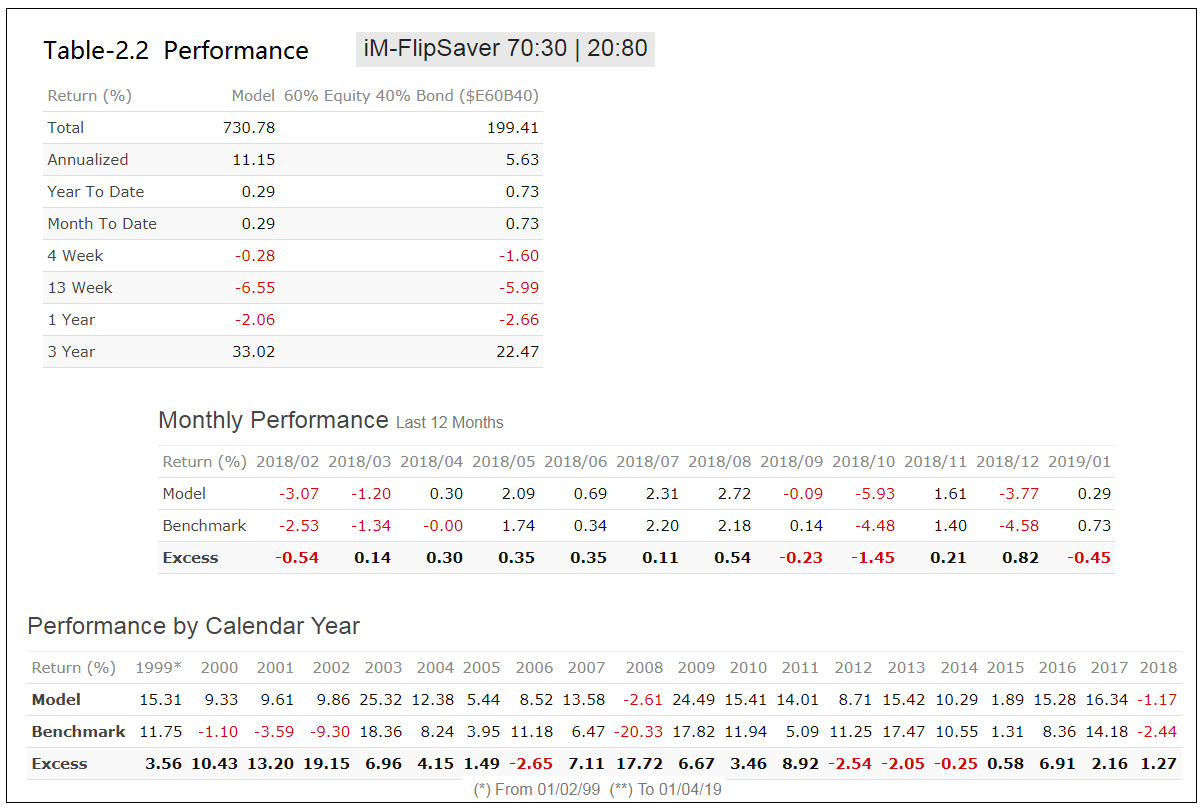
Tables-1.2, -2.2, and -3.2 provide the corresponding Performance Measurements.
All models would have out-perform their benchmarks with less risk.
Note that the models switched to down-market allocations on Dec-10-2018.
Holding history can be downloaded here: FlipSaverHoldingPeriods.xlsx
Conclusion
The backtests suggest that the iM-FlipSaver Models could be useful for retirement saving. Allocation changes are infrequent, with the average holding period of a position being about four months. Small re-balancing trades can have short holding periods, but can be ignored if accurate target exposure to nominal position weights is not required. At iMarketSignals we will provide weekly updates of these models.
Disclaimer
The performance data shown represent simulated past performance, which is not a guarantee of future results. Investment returns and portfolio value will fluctuate, and future signals from these models may not be as efficient as they were in the past.
Georg and Anton,
Can you provide yearly CAGR/DD for these models?
Thanks
For 70:30-30:70 model Simulated annual return
Return (%) ….. Model ….. Benchmark ….. Excess
1999 ….. 13.74 ….. 13.9 ….. -0.16
2000 ….. 12.02 ….. -3.25 ….. 15.27
2001 ….. 10.12 ….. -5.63 ….. 15.74
2002 ….. 8.63 ….. -12.43 ….. 21.07
2003 ….. 24.35 ….. 20.8 ….. 3.55
2004 ….. 12.8 ….. 8.87 ….. 3.93
2005 ….. 4.95 ….. 4.19 ….. 0.76
2006 ….. 8.81 ….. 12.34 ….. -3.53
2007 ….. 12.51 ….. 6.19 ….. 6.32
2008 ….. -5.76 ….. -24.61 ….. 18.85
2009 ….. 23.97 ….. 20.03 ….. 3.93
2010 ….. 15.2 ….. 12.78 ….. 2.43
2011 ….. 12.83 ….. 4.38 ….. 8.45
2012 ….. 9.31 ….. 12.45 ….. -3.14
2013 ….. 16.18 ….. 21.04 ….. -4.86
2014 ….. 10.22 ….. 11.29 ….. -1.07
2015 ….. 0.94 ….. 1.33 ….. -0.39
2016 ….. 14.8 ….. 9.29 ….. 5.51
2017 ….. 16.27 ….. 16.03 ….. 0.24
2018 ….. -2.96 ….. -5.63 ….. 2.67
For 80:20-20:80 model Simulated annual return
Return (%) ….. Model ….. Benchmark ….. Excess
1999 ….. 17.55 ….. 16.06 ….. 1.49
2000 ….. 8.08 ….. -5.41 ….. 13.49
2001 ….. 9.52 ….. -7.67 ….. 17.19
2002 ….. 9.27 ….. -15.53 ….. 24.8
2003 ….. 27.92 ….. 23.25 ….. 4.66
2004 ….. 12.77 ….. 9.49 ….. 3.28
2005 ….. 6.11 ….. 4.41 ….. 1.69
2006 ….. 9.54 ….. 13.51 ….. -3.97
2007 ….. 14.13 ….. 5.88 ….. 8.25
2008 ….. -1.88 ….. -28.79 ….. 26.91
2009 ….. 26.8 ….. 22.2 ….. 4.6
2010 ….. 16.46 ….. 13.58 ….. 2.88
2011 ….. 14.46 ….. 3.61 ….. 10.85
2012 ….. 8.86 ….. 13.64 ….. -4.78
2013 ….. 18.67 ….. 24.7 ….. -6.03
2014 ….. 11.09 ….. 12.03 ….. -0.94
2015 ….. 2.67 ….. 1.33 ….. 1.34
2016 ….. 16.87 ….. 10.21 ….. 6.66
2017 ….. 17.9 ….. 17.9 ….. 0.01
2018 ….. -2 ….. -6.42 ….. 4.43
For 60:40-40:60 model Simulated annual return
Return (%) ….. Model ….. Benchmark ….. Excess
1999 ….. 9.89 ….. 11.75 ….. -1.87
2000 ….. 15.73 ….. -1.1 ….. 16.83
2001 ….. 10.69 ….. -3.59 ….. 14.29
2002 ….. 9.78 ….. -9.3 ….. 19.08
2003 ….. 21 ….. 18.36 ….. 2.65
2004 ….. 12.74 ….. 8.24 ….. 4.5
2005 ….. 3.73 ….. 3.95 ….. -0.22
2006 ….. 8.06 ….. 11.18 ….. -3.11
2007 ….. 10.91 ….. 6.47 ….. 4.43
2008 ….. -9.57 ….. -20.33 ….. 10.76
2009 ….. 21.47 ….. 17.82 ….. 3.66
2010 ….. 14.09 ….. 11.94 ….. 2.15
2011 ….. 11.02 ….. 5.09 ….. 5.94
2012 ….. 9.78 ….. 11.25 ….. -1.47
2013 ….. 13.69 ….. 17.47 ….. -3.79
2014 ….. 9.25 ….. 10.55 ….. -1.29
2015 ….. -0.77 ….. 1.31 ….. -2.07
2016 ….. 12.83 ….. 8.36 ….. 4.46
2017 ….. 14.34 ….. 14.18 ….. 0.16
2018 ….. -3.93 ….. -4.85 ….. 0.92
Much appreciated,
Can you publish the trade dates? It’s hard to ascertain whether this type of strategy would be appropriate for taxable accounts based solely on the average holding time being approximately 4 months.
Thanks
The models hold positions for longer than 45 days. Thus the shortest holding period would be 7 weeks. ETF (TIP) is held constantly, and only re-balanced occasionally.
You suggest timing using the composite timer and momentum timing.
Can you explain how the the momentum timer works?
Thank You,
Mark
Momentum timing uses:
50d and 200d Moving Average of the S&P500 and
10d and 50d Moving Average of the S&P500
Mislabelled Table Charts? Numbers better under Model vs Equity/Bond numbers.
Figures and charts are labeled correctly. I don’t see the mislabeling.
Sorry. I confused Model with Benchmark.
If this is updated weekly, why have no new indicators been shown? Are we still in down market scenario?
I am using free membership until Jan 4th. So far this Flip Saver model is main reason I would join. When will it be shown on your menu or index of portfolio models?
Thanks for your time.
We will publish the FlipSaver models starting on Jan-6-2019. They will be revised from what is shown in the article of posted Dec-21. All models will have down-market allocation of 20% stocks and 80% bonds.
Please also refer to https://imarketsignals.com/im-flipsavers/
Thanks! Looking forward to using this.
Comparing Down Market bond allocations in Model 1 Vs the Appendix’s Conservative Model (both 20% stocks & 80% bonds), how much do the different allocations contribute to the Appendix Model’s performance (1999 – 2018)?
– Model 1: 80% bonds (BND~60%, TIP~20%) Vs.
– Appendix: 80% bonds (BND~40%, TIP~40%)
Please see above comment.
The models will be revised from what is shown in the article of posted Dec-21. All models will have down-market allocation of 20% stocks and 80% bonds to reduce risk and increase returns.
Please also refer to https://imarketsignals.com/im-flipsavers/
Did you find that a model with 100% stock up market / 100% Bond down market was not performing well and that’s why you don’t have this type of model here?
The FlipSaver models are designed to be used for retirement fund saving. Thus we attempt to reduce risk by holding stock and bond funds all the time.
We have a few 100% stock up market / 100% Bond down market models at iM. For example the iM-Composite (SPY-IEF) Timer is one of them. Its return is a lot higher, but trades a lot more often than the FlipSavers.
Where do I find the weekly updates for the FlipSaver models? I don’t see them with the other weekly models, like Google Trends. Thanks
The models will posted starting Jan-6-2019. All models will have down-market allocation of 20% stocks and 80% bonds to reduce risk and increase returns.
Please also refer to https://imarketsignals.com/im-flipsavers/
Thanks for these updated models. I’d like to see models that would be good for 529 accounts where you’re only allowed to trade 2X per year. Do you have models that are low frequency and have good performance?
Exactly what are the trade restriction for 529 accounts?
one can trade 2x in one calendar year. they usually have basic index funds (s&p500, aggregate bond, etc). but the big limitation is begin able to change the allocation twice a year.
However, when one deposits money, they can choose how to invest upon deposit, it doesn’t have to match the existing allocation.
perhaps the best bet here is using the Low Frequency market timer
I am using the Low Frequency for all 529 accounts at the moment. But sounds like a better timing model suitable for 529s is forthcoming.
Thanks Randy. Yes, unfortunately 529 Education accounts are restricted to only 2 trades per year. Sounds like a good possibility on the Low Frequency Timer. Depending on one’s timeline and timing of entry, however, market conditions could affect the returns. If you have 20 years you could handle the swings whereas 10 years might not be so good.
Is it 2 trades, or 2 switches.
i.e. sell SPY and buy IEF are two trades, or 1 switch
So if it is strictly 2 trades then one can only switch positions once a year?
2 switches or rebalances per year. That’s how I understand it.
We will be launching a low frequency model based on the Stock Market Confidence Level which we publish (email) every Sunday for Gold tier subscribers.
This model has only 10 switch trades (SPY-IEF) from 2000-2018 and shows a 15% annualized return. Could be useful for 529 accounts.
Ok, thanks Georg. Sounds interesting.
Georg,
I’ve been trying to use your concept to make an even more conservative model that would optimize dividend payments/ taxes and wonder if you could run the following:
Risk on = 60% VYM
20% MUB
20% TFI
Risk off = 60% IEF
20% MUB
20% TFI
Most of these ETF’s only go back to 07 and that would be fine, if you have a way to synthetically recreate to 00, even better.
Thanks
You have the Risk on and off reversed.
should read:
Risk off = 60% VYM
20% MUB
20% TFI
Risk on = 60% IEF
20% MUB
20% TFI
This is a 60:40 | 0:100 model. i.e. it goes to 100% bonds during down-market periods.
Earliest starting date is 9/3/2007, the inception date of TFI. This model has better returns than benchmark 60%SPY-40%BND.
Number of Positions 3
Period 09/03/07 – 01/11/19
Benchmark 60% Equity 40% Bond ($E60B40)
Quick Stats as of 1/11/2019
Total Return 231.31%
Benchmark Return 103.40%
Active Return 127.91%
Annualized Return 11.12%
Annual Turnover 142.71%
Max Drawdown -7.64%
Benchmark Max Drawdown -34.70%
Overall Winners (24/29) 82.76%
Sharpe Ratio 1.52
Correlation with 60% Equity 40% Bond ($E60B40) 0.44
You get the same return for
Risk off = 60% VYM
40% MUB
Risk on = 60% IEF
40% MUB
Thanks Georg,
Let me clarify so semantics don’t trip us up. I’m using VYM in up market conditions where risk is low and IEF during down market where risk is high. Am I correct that this is how you ran the backtest?
Yes, that is how the backtest was set up.
I like the simplicity of these models.
For most of the other models, you have posted all of the trade history.
Can you do that for these models or at a minimum tell us how many changes per year?
I know you mentioned shortest holding period was 7 weeks, but, don’t know how often model is traded.
Thanks
Holding history can be downloaded here: FlipSaverHoldingPeriods.xlsx
Thank you
Hi Georg and Anton
Kinda like this for long-term investments. Two ?s:
*Using the Composite Timer instead of the default, what would results look like?
*When do you think the low frequency model based on the Stock Market Confidence Level is
going to be ready to review??
Many thanks
Man
The idea of the FlipSaver models is to have models with long holding periods for positions, suitable for retirement accounts.
The Composite Timer has much shorter holding periods.
Have you tried running the FlipSaver using the Super-Timer in place of the Composite Timer?
Tom C
Now that the Super Timer is out, should the Flipsaver be tied to the Super Timer instead of the Composite Timer?
No, we will not change the FlipSaver models.
Georg, in order to compare timing only sharpe ratio to other binary models what would performance be for 100% SPY:100% IEF? Thanks
How would this system compare to using your same rules, with Vanguard Wellingon VWELX in up markets, and Vanguard Wellesley VWINX in down markets?
Tom C
Tom, we have posted the up- and down-market period dates for the FlipSavers. You need to download the daily performance adjusted for dividends for the two Vanguard funds from Yahoo Finance into a spreadsheet and then do the necessary calculations with our period dates to see what our model’s periods applied to the Vanguard funds would have produced.
Unfortunately we can’t automate this for the FlipSavers. It is fairly easy to do for the SuperTimer, because this model runs in excel.
Yes, make sense. Thanks!
Tom,
From 1/3/2000 to 2/4/2019
VWELX CAGR= 7.58%
VWINX CAGR= 7.24%
Both funds have about the same return.
But when one uses them in the SuperTimer you get very robust investment performance of over 9.0% even when holding positions for 13 weeks min.
Below is CAGR for period 1/3/2000 to 2/4/2019 when reconstituting every 1 week to 13 weeks from 1/3/2000 onward, and max number of flip-trades per year:
1-wk 10.63% (8)
2-wk 10.33% (7)
3-wk 9.85% (5)
4-wk 9.71% (5)
8-wk 9.16% (4)
13-wk 9.27% (2)
Because the individual performance of those funds is almost the same, it is a very robust switching model for the SuperTimer.
Just saw your SuperTimer update. I was reviewing these notes, was curious that in the model where you go Wellington VWELX (bull) and Wellesly VWINX (bear) and got the 1 week return of 10.63%, what the max drawdown was. Very powerful. Thanks.
Tom C
Georg and Anton,
Will this be based on the Super Timer, and any ideas when this model will be released?
“We will be launching a low frequency model based on the Stock Market Confidence Level which we publish (email) every Sunday for Gold tier subscribers.
This model has only 10 switch trades (SPY-IEF) from 2000-2018 and shows a 15% annualized return.”
Is the benchmark for flipsaver SPY or 60/40 ? In weekly updates it says SPY.
iM-FlipSaver 60:40 | 20:80 – 2017: The model’s out of sample performance YTD is 7.3%, and for the last 12 months is 6.7%. Over the same period the benchmark SPY performance was 9.9% and 8.4% respectively. Over the previous week the market value of iM-FlipSaver 80:20 | 20:80 gained 0.41% at a time when SPY gained 1.37%. A starting capital of $100,000 at inception on 7/16/2015 would have grown to $120,109 which includes $428 cash and excludes $788 spent on fees and slippage.
Thanks for reporting this discrepancy.
The benchmark for all the FlipSavers is 60% Equity 40% Bond (E60B40), where ETF (SPY) is used for Equity and ETF (BND) is used for Bond.
The reported performance percentages refer to benchmark E60B40 and not to SPY. This will be changed for the next update.
Based on the spreadsheet “FlipSaverHoldingPeriods.xlsx” I would have thought, on 5/5/2019, you would have advised making 2 trades and holding VTI instead of VIG when FlipSaver flipped into up-market condition.
Please help me understand the difference between the website’s recommendation and the spreadsheet.
The Website, on the home page, in the “5/5/2019 iM-FlipSaver ‘Trades 1’ assets changed into up-market condition” table says:
iM-FlipSaver Asset Allocation
Market Condition = Up
TICKER Up: 60:40 Up: 70:30 Up: 80:20
Dn: 20:80 Dn: 20:80 Dn: 20:80
Hold TIP 40% 30% 20%
Hold BND — — —
Hold VIG 60% 70% 80%
The spreadsheet, FlipSaverHoldingPeriods.xlsx, in the “FlipSaver Asset Allocation” table says:
60:40 | 20:80 70:30 | 20:80 80:20 | 20:80
UP TIP 40% 30% 20%
VTI 60% 70% 80%
DOWN TIP 40% 30% 20%
BND 40% 50% 60%
VIG 20% 20% 20%
This is a typo. For the up-market condition the models hold stock fund VTI not VIG.
Thanks for reporting.
Your site says no trades since 9/30/19 switches to UP market condition, but below that says this strategy remains in a DOWN market condition. Which is it? Thanks.
|The model is in up-market. Thank you for notifying the discrepency that is now corrected.
When do you anticipate this strategy changing to up market conditions? Many other market indicators and even signals provided by imarketsignals are beginning to indicate up market conditions.