
- This study analyzes Yale’s Qualified Default Investment Alternative, a retirement plan with a target-date strategy. The findings also apply in principle to target-date strategy models from Vanguard, Fidelity, and others.
- Yale University’s new retirement plan provides a “Glidepath” Target-Date Plus Service and also allows participants to opt out from it to pick their own investments from a few select funds.
- Backtests (1999-2019) show that Yale’s Glidepath strategy would not have performed particularly well; one would have done better selecting one’s own funds, or by following the traditional 60%Stock-40%Bond constant allocation.
- Retirement savings were calculated for a hypothetical individual making contributions to a retirement fund from Jan-2000 onwards using various allocation strategies, including Yale’s Glidepath and also a reverse glide-path strategy.
- Much higher savings with relatively low risks can be obtained by employing a dynamic investment strategy using models which have moderately different allocations for up- and down-market conditions.
The Yale Target-Date Plus models
A glide-path strategy is one that systematically reduces the equity component of the asset allocation and increases the fixed income component of an investment portfolio as the individual ages and approaches retirement.
The new Yale “streamlined” investment lineup consists of only eleven investment options, with the Yale Target-Date Plus model portfolios (hereinafter referred to as “Glidepath portfolios”) using six of the investment options, all as listed here and also in Table-1 below. Corresponding exchange traded funds (ETFs) used for the backtests were added to the table by the author.
The investment allocations for each of the 14 Glidepath portfolios are listed in a brochure titled “Yale retirement savings program – Transition Guide to upcoming changes” which was mailed to members of the retirement savings program.
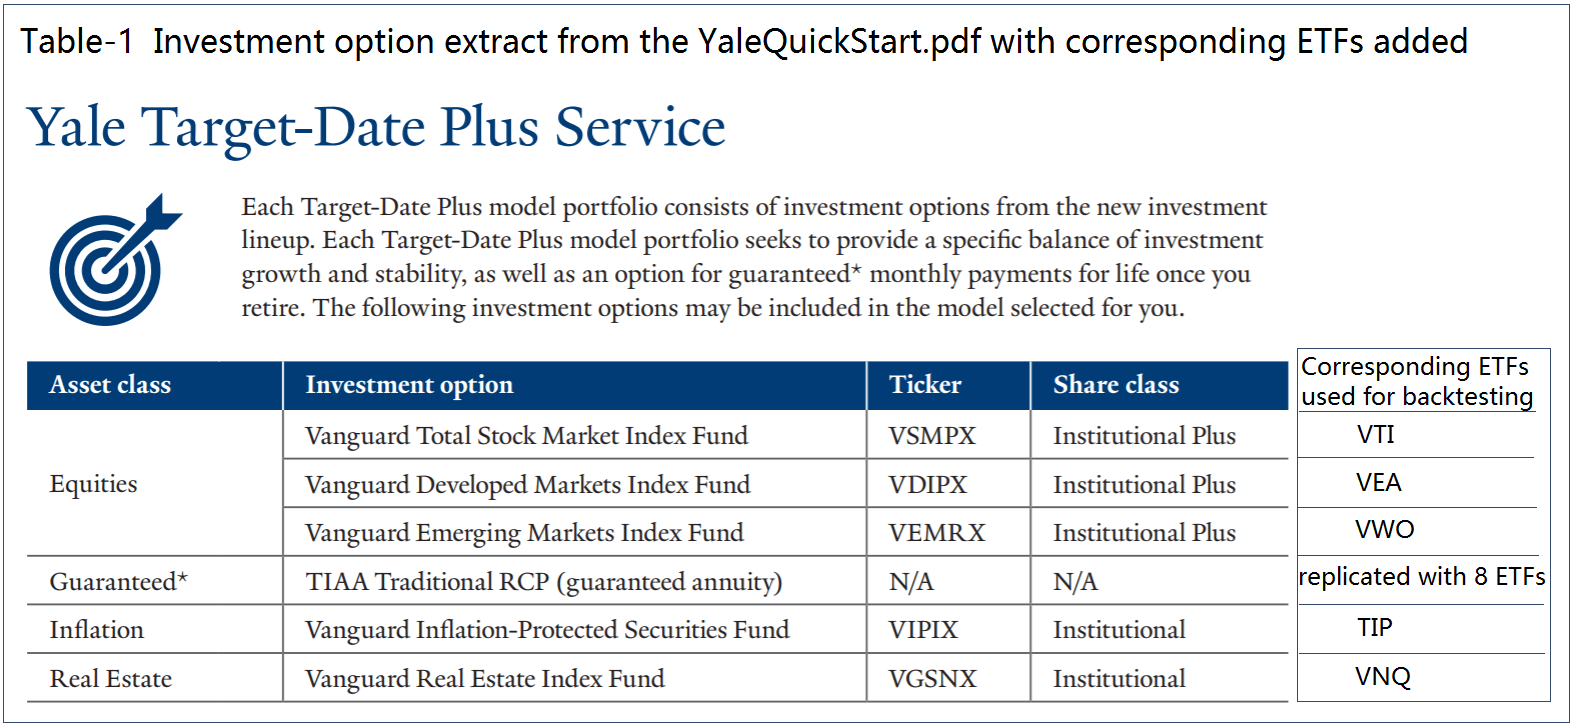
For backtesting purposes the TIAA Traditional guaranteed annuity (herein after referred to as TIAA) was reasonably well replicated with eight ETFs. See Appendix-2 for details.
Simulated performance of the Target-Date Plus model portfolios
The backtests from Jan-1999 to Mar-2019 (a 20-year period) were performed on the online simulation platform Portfolio 123 which also has extended price data for ETFs prior to their inception dates calculated from the ETFs’ proxies.
The performance statistics are for an initial investment only, with no further cash added. Annualized returns, Sharpe ratios, and max drawdowns obtained from the 1999-2019 backtests of the Glidepath portfolios are listed Table-2. As the Glidepath length shortens annualized returns become less and investment risk decreases as indicated by increasing values of the Sharpe ratios and the maximum drawdowns getting less negative.
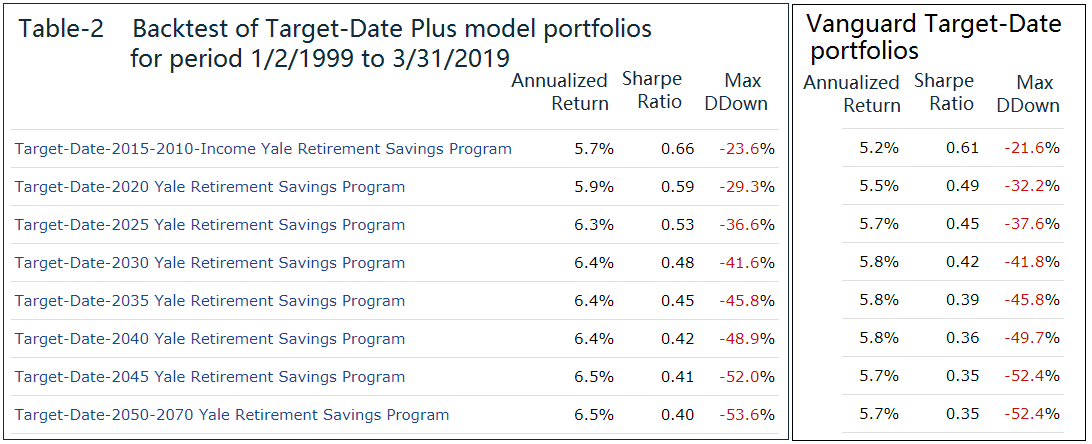
Simulated returns of the Yale models are not particularly good (or bad). Participants in the Glidepath program should not expect better long-term returns in the future.
Also listed in Table-2 are results from a separate backtest of similar Vanguard funds. It is apparent that the average of the Yale Target-Date models’ annualized returns is about 0.6% higher than that of the Vanguard models (probably due to the more stable returns of TIAA), the risk measurements are also better, making the Yale models the preferable investment alternative of the two.
Backtest of YALE Target-Date Plus 2035-2030-2025-2020 Glidepath model
This Glidepath model applies to a hypothetical individual making contributions to the Yale retirement fund from Jan-2000 onward as described later in the article. For the period 1/2/1999 to 3/31/2019 the Glidepath strategy for this individual would consist of the following model portfolios:
| 1999 – 2004 | Target-Date Plus 2035 |
| 2005 – 2009 | Target-Date Plus 2030 |
| 2010 – 2014 | Target-Date Plus 2025 |
| 2015 – 2010 | Target-Date Plus 2020 |
A backtests of this model with the corresponding portfolios listed in Table-2 and for the same period gives:
| Annualized Return | 5.9% |
| Sharpe ratio | 0.37 |
| Max Drawdown | -41.6% |
Backtest of reverse glide-path Target-Date Plus 2020-2025-2030-2035 model
A reverse glide-path strategy is one that systematically increases the equity component of the asset allocation and reduces the fixed income component of an investment portfolio during the accumulation phase leading to retirement.
A reverse glide-path model could consist of the following model portfolios, which are the same as used in the backtest described above, but in reverse order:
| 1999 – 2004 | Target-Date Plus 2020 |
| 2005 – 2009 | Target-Date Plus 2025 |
| 2010 – 2014 | Target-Date Plus 2030 |
| 2015 – 2010 | Target-Date Plus 2035 |
A backtests of this model for the same period (1/2/199 to 3/31/2019) gives:
| Annualized Return | 6.6% |
| Sharpe ratio | 0.47 |
| Max Drawdown | -36.6% |
Note, that the reverse glide-path model would have produced a higher return with better risk measurements than the Yale Glidepath strategy.
Simulated performance for select portfolios TARGET30 and INCOME30
For a retirement savings program it is not necessary to use many different Glidepath portfolios, since they all show approximately the same long-term returns. Members of Yale’s retirement savings program can opt out from the Target-Date Plus Service and pick their own investment options from the eleven few available in the streamlined investment lineup.
The strategy advocated here is to opt out from the automated Glidepath service and only use two portfolios, which for convenience have three of the four investment allocations (50% of the total value) in common and both have a permanent income allocation of 30% TIAA (hence the 30 at the end of TARGET and INCOME).
- TARGET30 = 50%VTI +5%VWO+15%VNQ+30%TIAA (70% Equity : 30% Fixed Interest)
- INCOME30= 50%TIP +5%VWO+15%VNQ+30%TIAA (20% Equity : 80% Fixed Interest)
The ETFs used are representative of the mutual funds listed in Table-1, and are:
- Vanguard Total Stock Market ETF (VTI)
- Vanguard FTSE Emerging Markets ETF (VWO)
- Vanguard Real Estate ETF (VNQ)
- iShares TIPS Bond ETF (TIP)
Table-3 lists the annualized returns, Sharpe ratios, and max drawdowns obtained from the 1999-2019 backtests for the select models TARGET30, INCOME30, and a 50/50 combination model of the two, herein after referred to as COMBO30. The performance statistics are for an initial investment only without any further cash added during the backtest period.
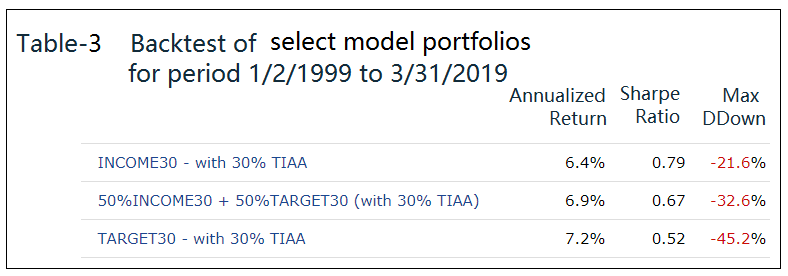
Note, that the TARGET30 portfolio shows a significantly higher return than any of the portfolios listed in Table-2. It is preferable to any of the Target-Date 2070 to 2035 portfolios, as it would have produced higher returns with less risk.
The INCOME30 portfolio is also preferable to the Target-Date Plus Income portfolio, as its historic simulated annualized return and Sharpe ratio are higher. It also out-performs all the Vanguard Target-Date funds with less risk.
The combination model COMBO30 consists of 50%TARGET30 and 50%INCOME30 which has an allocation of 25%VTI+25%TIP+5%VWO+15%VNQ+30%TIAA. It is preferable to any of the Yale and Vanguard Target-Date portfolios, as it would have produced a higher return with less risk than any of them. COMBO30 has a conservative allocation of 45% equity and 55% fixed income, which explains the better risk figures.
Simulated performance with annual contributions – static investment models
The simulated annualized returns listed in Table-2 and -3 are only applicable to the growth of an initial investment made at the beginning of the backtest period.
To provide a more realistic picture of what retirement savers can expect from Yale’s Glidepath program, backtests were performed assuming that this program was already available in the year 2000. The objective of the exercise was to estimate what a hypothetical individual (hereinafter referred to as John) would have in his retirement account by end of March-2019, after working for over 19 years at Yale University.
John’ particulars are assumed as follows:
- Age in year 2000 = 35 years.
- Employed from Jan-2000.
- Age at retirement = 70 years, in year 2035.
- Initial savings = $5,000.
- Initial annual salary = $80,000 increasing annually by 2.70%.
- Contribution to retirement account = 15% of salary.
- Total money invested from Jan-2000 to Mar-2019 = $197,875
- Contribution made yearly (not monthly) on 1st July each year.
In the year 2000, John would have been enrolled in the Target-Date Plus 2035 model portfolio (because he is assumed to retire in 35 years), and then every five years his contributions would be allocated to the shorter Target-Date portfolios until retirement.
The backtest to determine what John would have saved by Mar-2019 uses therefore the Glidepath 2035-2030-2025-2020 model portfolios. The retirement savings over time according to Yale’s Glidepath strategy are compared to what he would have had, if either the TARGET30 or the INCOME30 portfolios were used instead, or if savings had simply followed a buy-and-hold 60%:40% stock-bond (60%VTI-40%TIAA) allocation referred to as E60B40, all as shown in Figure-1.
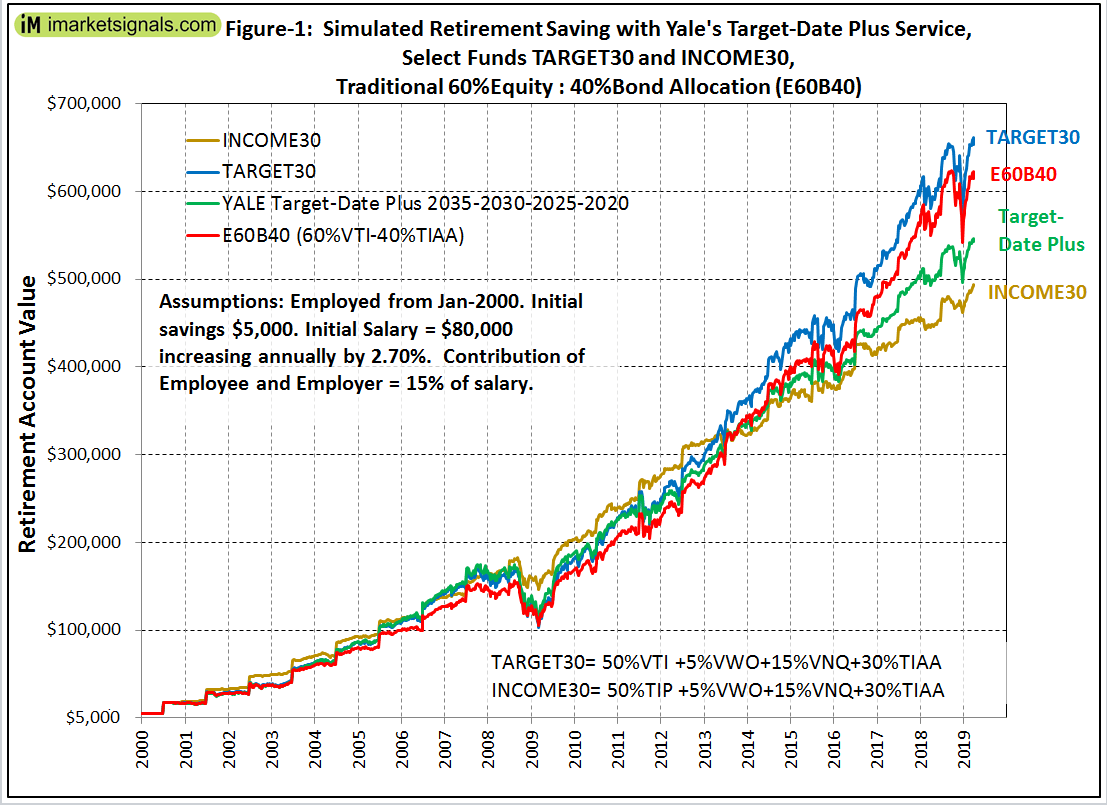
The terminal value and internal rate of return (IRR) from Jan-2000 to Mar-2019 of the total money invested over time ($297,875) are listed for the various savings strategies in the Table-4.
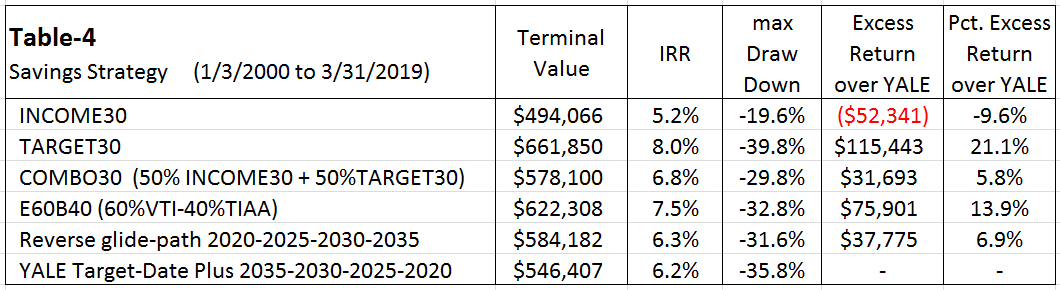
The following observations hold for the period Jan-2000 to Mar-2019:
- All alternative savings strategies, with the exception of INCOME30, show higher terminal values and IRR than the YALE Target-Date Plus 2035-2030-2025-2020 Glidepath strategy.
- John would have had about $115,000 more in his retirement account by Mar-2019 if he had followed the TARGET30 constant allocation strategy in preference to the YALE Target-Date Plus Glidepath savings strategy. This would have been achieved without additional risk since maximum drawdowns for both strategies are similar.
- Even the relatively low risk COMBO30 constant allocation strategy would have produced more than the higher risk Glidepath strategy.
- The argument that a glide-path allocation strategy is more suitable for retirement saving than other traditional allocation models is not supported by this study. The backtest for buy-and-hold 60% equity and 40% bonds (E60B40), shows that John would have saved $76,000 more with somewhat lower risk than what the Yale Glidepath strategy would have produced.
- A reverse glide-path strategy with the Yale Glidepath portfolios would also have produced $38,000 more in savings with less risk than what the Yale Glidepath strategy would have produced.
- Also of interest, as shown in Figure-1, is that the INCOME30 allocation model (80% fixed income and 20% equity) would have produced higher savings from 2000 to 2013 than any of the other three higher risk allocation models depicted in the figure.
Simulated performance with contributions from Oct-2007 to Mar-2009
Assuming that John had followed the Yale Glidepath strategy, he would have saved by end of October 2007 a total of $174,411, and presumably he would have been reasonably satisfied because his contribution this was only $125,429.
However, 15 months later, despite contributing another $14,851 in 2008, his retirement account would have been reduced to $111,931 by March 2009 due to the effect of the 2008 financial crisis. This performance is listed in Table-5 together with performance of the Vanguard glide-path models, INCOME30, TARGET30, COMBO30, and the iM-1wk-SuperTimer described later.
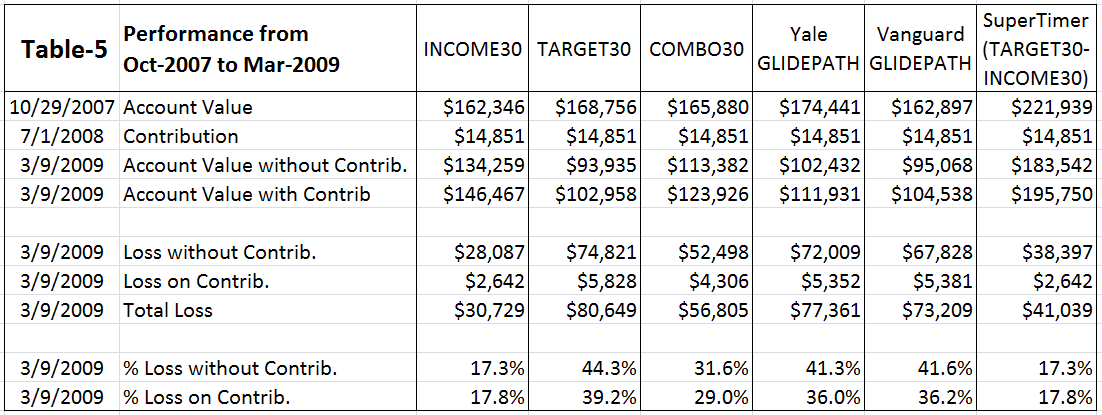
John would have saved more by keeping all his contributions to 2009 in cash; by March 2009 he would have saved $125,429 without any interest added, almost $14,000 and $21,000 more than the retirement account values which followed from investing in the Yale- or Vanguard glide-path models, respectively. Alternatively, following the INCOME30 model would have been the better strategy because he would have saved $146,467 by March 2009, and only lost an acceptable 17% during this critical period.
One can see that the Yale- and Vanguard glide-path models showed similar percentage losses of more than 40%, only slightly lower than the loss of the aggressive TARGET30 model.
These are not acceptable losses; no employer should subject its employees retirement savings to this kind of risk by making a sub-optimal investment strategy the default option of their retirement plan.
John would have lost about five and a half years of savings contributions over a 15 months period by following a Target-Date plan, irrespective of whether such a plan came from Yale or Vanguard, or from any other fund provider, because they are all equally poor schemes.
Boosting retirement saving with the iM-SuperTimer: Simulated performance with annual contributions – dynamic investment model
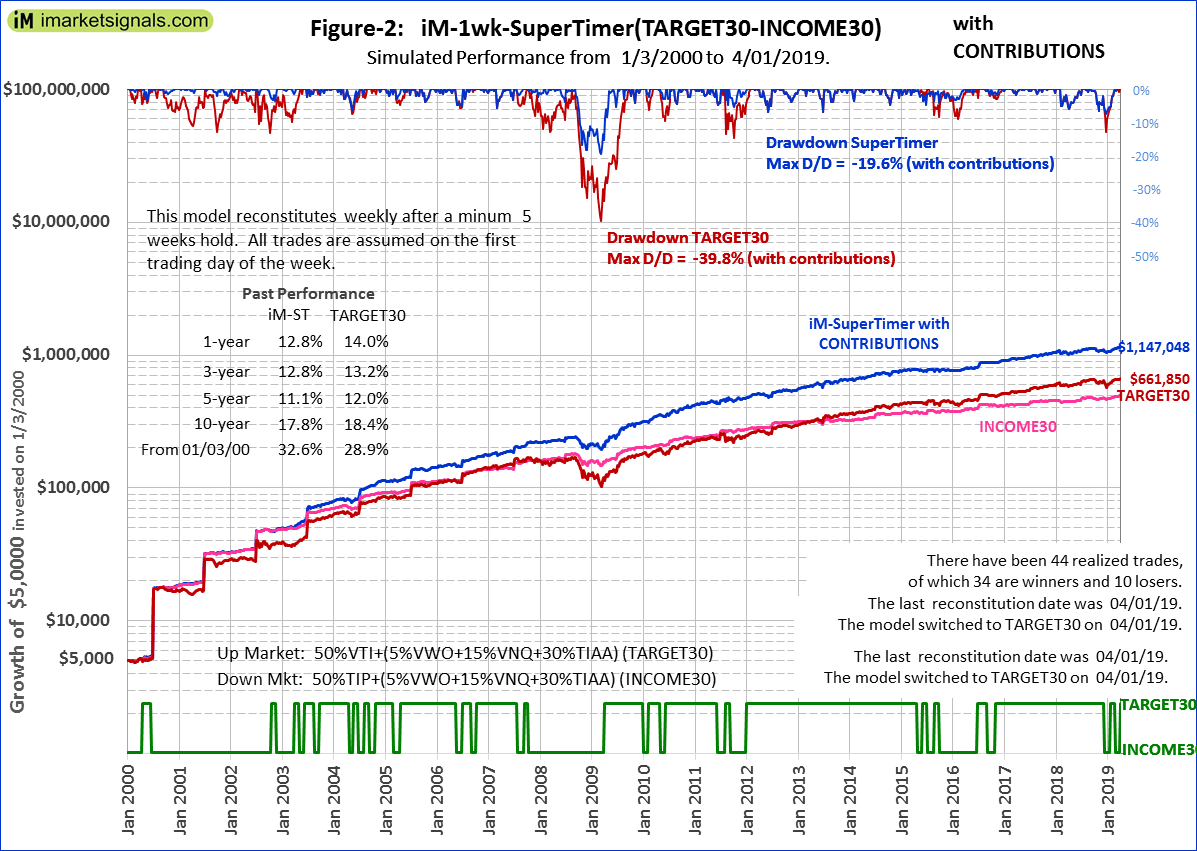
A useful strategy could be to follow iMarketSignals’ weekly updated iM-SuperTimer which defines up-market and down-market periods for stocks. The iM-SuperTimer uses the iM-Stock Market Confidence Level (iM-SMC level) which comes from a combination of 15 unrelated market indicator models, updated weekly. According to backtests, a high probability for up-market conditions exists when the iM-SMC level is greater than 50%.
Retirement saving risk and performance can be significantly improved by following its signals. For example, an effective strategy would be to select the TARGET30 model portfolio during up-market periods and the INCOME30 model portfolio during down-market periods.
This would require only switching 50% of the retirement fund’s value between the Vanguard Total Stock Market Index Fund (represented by VTI) and the Vanguard Inflation-Protected Securities Fund (represented by TIP), while leaving the other 50% of the retirement account value in the static investment allocations (5%VWO+15%VNQ+30%TIAA) untouched.
Assuming that John had followed the SuperTimer strategy (reconstituted weekly with a minimum holding period of 5 weeks) with component models TARGET30 and INCOME30, he would have saved by end of October 2007 a total amount of $221,939 (as shown in Table-5). In March 2009, with the additional 2008 contribution of $14,851, his retirement account would have stood at $195,750, showing an effective loss of $41,039 over this period. This is a more acceptable loss of about 17%; the same percentage loss as for INCOME30.
It is not necessary to accurately time beginning an end of an up-market or down-market period. The switching strategy is robust due to TARGET30 and INCOME30 holding the same permanent 30% fixed income and 20% equity allocations. So even if timing is not optimal it does not lead to significant under performance.
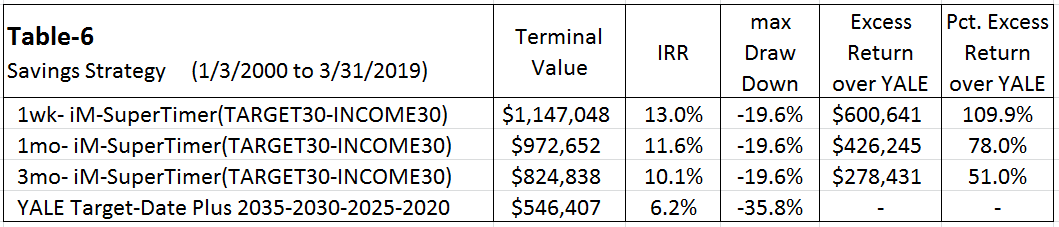
The simulated growth of John’s retirement account value over time (from Jan-2000 to Mar-2019) from $5,000 to a terminal value of $1,147,048, which includes 19 years of contributions totaling $292,875, is shown in Figure-2, and also listed in Table-6.
The high growth is achieved by using the signals from the iM-SuperTimer model reconstituted weekly with a minimum holding period of 5 weeks. Maximum drawdown also becomes an acceptable -20%, much better than the -40% of the constant allocation model TARGET30. Had he just followed TARGET30 without ever switching to INCOME30 he would have saved only $661,850, still $115,000 more than what the Yale Glidepath strategy would have produced (see Table-4).
The bottom graph inFigure-2 indicates the investment periods for the two component models. Accordingly, there would have been 44 realized trades (45 switches) over the backtest period. This model switched to TARGET30 on 4/1/2019, indicating up-market conditions for stocks, and will hold TARGET30 for at least 5 weeks to 5/6/2019.
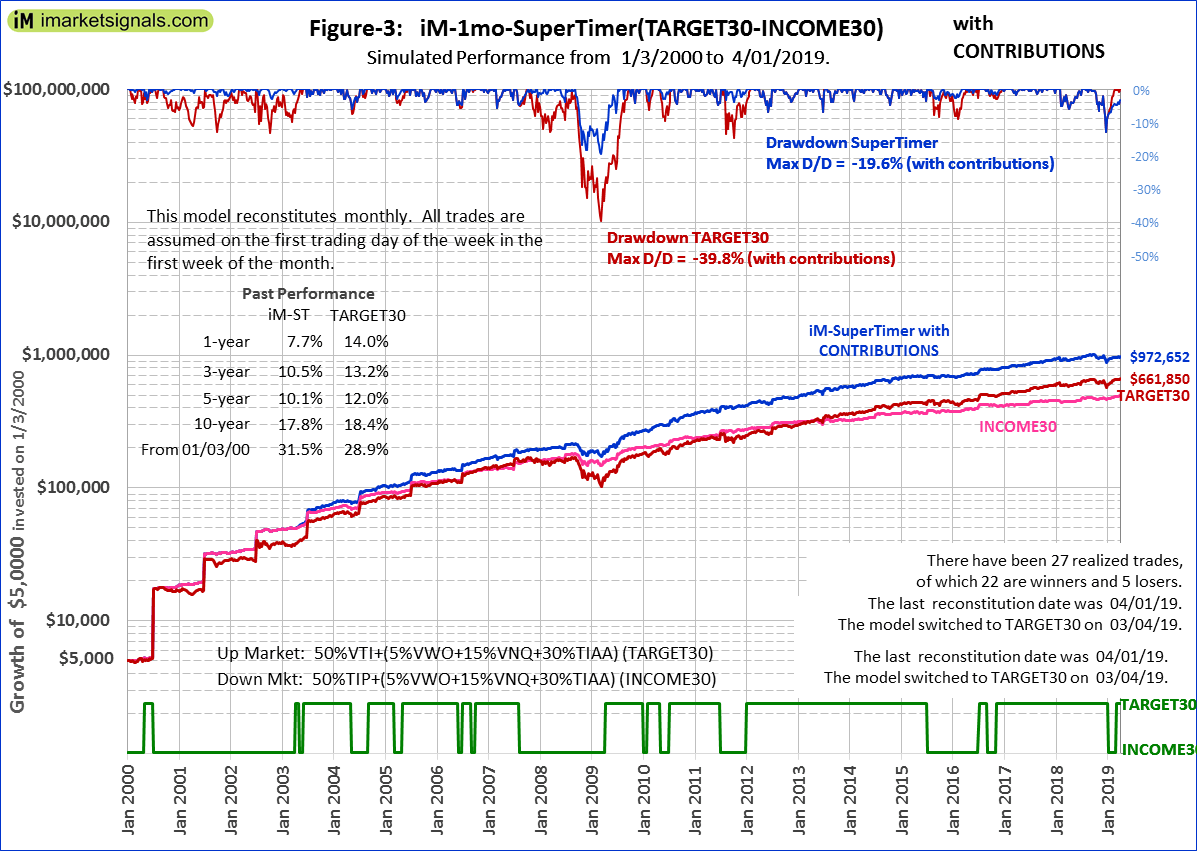
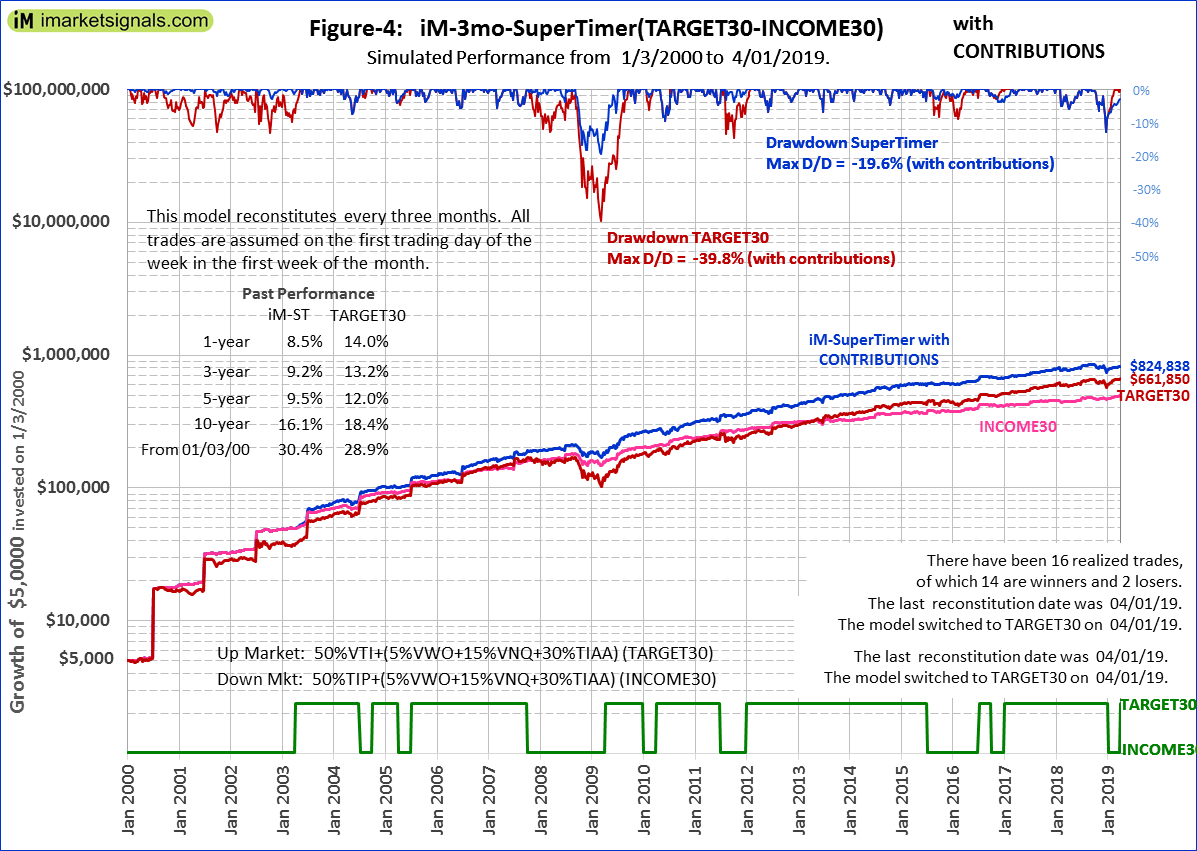
Terminal values emanating from investments TARGET30 and INCOME30 switched according to signals from the iM-SuperTimer models reconstituted monthly and quarterly are also listed in Table-6, and simulated performance over time is shown in Figures-3 and -4 in Appendix-1.
For example, if John wanted to only attend to his retirement account every three months he could follow the signals from the 3mo-iM-SuperTimer reconstituted quarterly. Switching the variable allocations accordingly, he would have had $824,838 in his retirement account by Mar-2019 as shown in Figure-4 and Table-6. This negligible management effort would have resulted in adding about $278,000 more to his savings than what the automated Glidepath 2035-2030-2025-2020 strategy would have provided; all of this with less risk as is apparent from the max drawdown figures listed in Table-5.
Note, that a 3-month reconstitution period of the iM-SuperTimer does not require switching of the variable allocations every 3 months; it only means that a position is held for a minimum period of 3 months. Over the 19 year long backtest period the 3mo-iM-SuperTimer would have generated only 17 switching signals.
Conclusion
Apart from this statement in the Yale brochure: “The Target-Date Plus model portfolios are designed to adjust automatically over time to manage your retirement savings for growth during your early career, gradually transition towards security for retirement….” the author is not aware of any other reason for specifying the Target-Date Plus Service as the default option of Yale’s retirement savings program, or why other organizations have adopted the same policy with other glide-path Target-Date models.
From the backtests it is obvious that glide-path strategies can produce poor returns if during the early saving periods the stock market experiences long bear-markets. As was shown, from 2000 to 2013 (which included two major stock market downturns), a more security orientated portfolio would have done better than a growth portfolio. Following a glide-path strategy during this period would have been a bad strategy for early career savers.
The simulations also show that for the backtest period Jan-2000 to Mar-2019 a traditional 60% stocks and 40% bonds constant allocation model would have produced 14% more savings than the Yale Glidepath strategy applicable to a person scheduled to retire in 2035. The higher return would have been achieved with similar risk. This is consistent with the findings of this research which indicate that constant allocation models tend to deliver superior risk-adjusted returns relative to the glide-path models during the accumulation phase towards retirement.
Further, it was shown that much better returns with similar risks can be obtained by selecting one’s own investment options from the few available in the Yale investment lineup and combining them in an allocation model with a certain percentage of the TIAA income annuity.
One should also be aware of research showing that a reverse glide-path strategy towards and in retirement can actually increase the probability of retirement success. This is confirmed by this study’s backtests, which is for a 19-year portion of the accumulation phase towards retirement.
Also some market timing doesn’t harm; one has to have a strategy to deal effectively with up- and down-market conditions. It was shown that in order to boost retirement savings, switching half of one’s retirement account value between fixed income and equity according to stock market climate can add a lot of additional value without adding investment risk. This requires robust indicators to signal stock market direction, such as the iM-SuperTimer models.
Disclaimer
The performance data shown represent past performance, which is not a guarantee of future results. Investment returns and portfolio value will fluctuate, and future returns from these models are unknown and may be much different.
Appendix-1
Below in Figures-3 and -4 the performance of the iM-SuperTimer models, reconstituted monthly and quarterly, by switching the variable allocation portion of the component models’ of TARGET30- INCOME30.
Appendix-2
The performance of the TIAA Traditional Guaranteed Annuity Account was modelled on the online simulation platform Portfolio 123 with a combination model, and is shown in Figure-5. The annualized return from 2000-2019 is 4.7% for both of the actual account and simulated account model.
The combination consists of eight ETFs, which are:
- iShares National Muni Bond ETF (MUB)
- iShares Short Treasury Bond ETF (SHV)
- Vanguard Dividend Appreciation ETF (VIG)
- iShares 1-3 Year Treasury Bond ETF (SHY)
- iShares 3-7 Year Treasury Bond ETF (IEI)
- Vanguard Mortgage-Backed Securities ETF (VMBS)
- Vanguard Short-Term Inflation-Protected Securities ETF (VTIP)
- Vanguard Dividend Appreciation ETF (VIG)
- Invesco DB US Dollar Index Bullish Fund ETF (UUP)
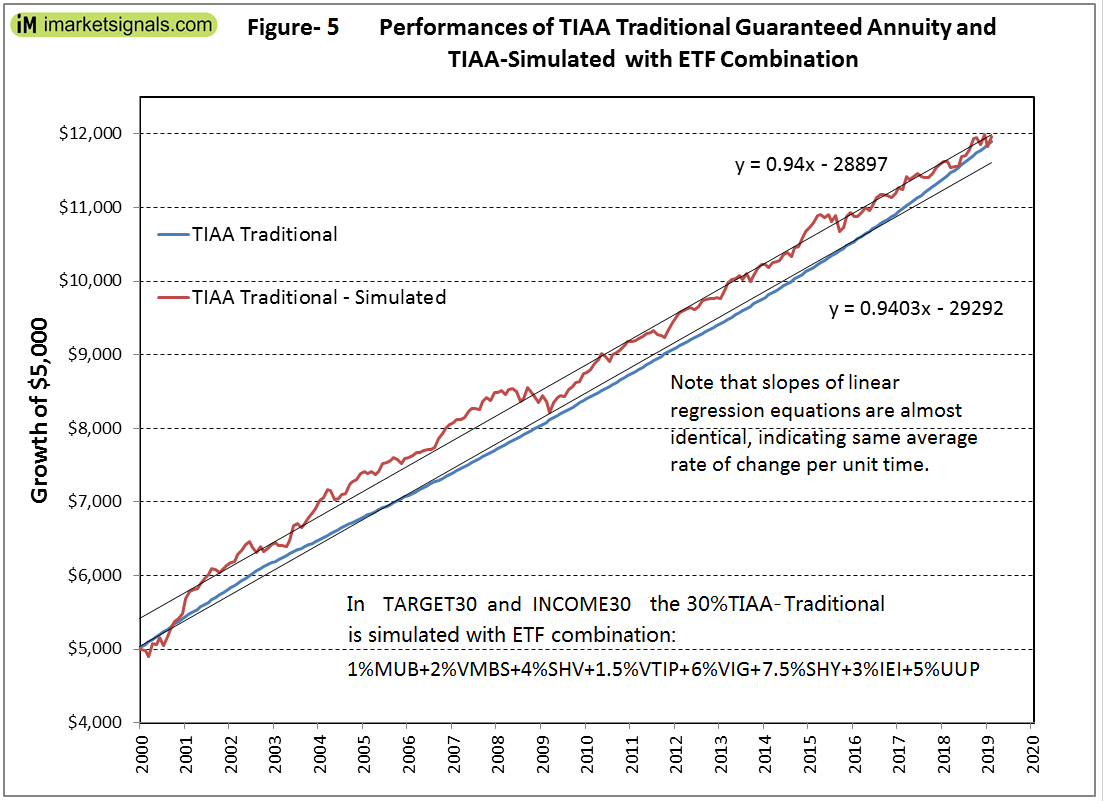
The simulation from 2000 to 2019 of TIAA-Traditional shows a higher annualized return and lower risk measurements than the iShares 3-7 Year Treasury Bond ETF (IEI), with risk statistics based on industry standard calendar monthly returns , using the 3-Month Treasury Bill return for the risk-free return.
Leave a Reply
You must be logged in to post a comment.