  |
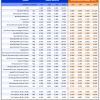
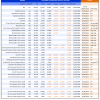
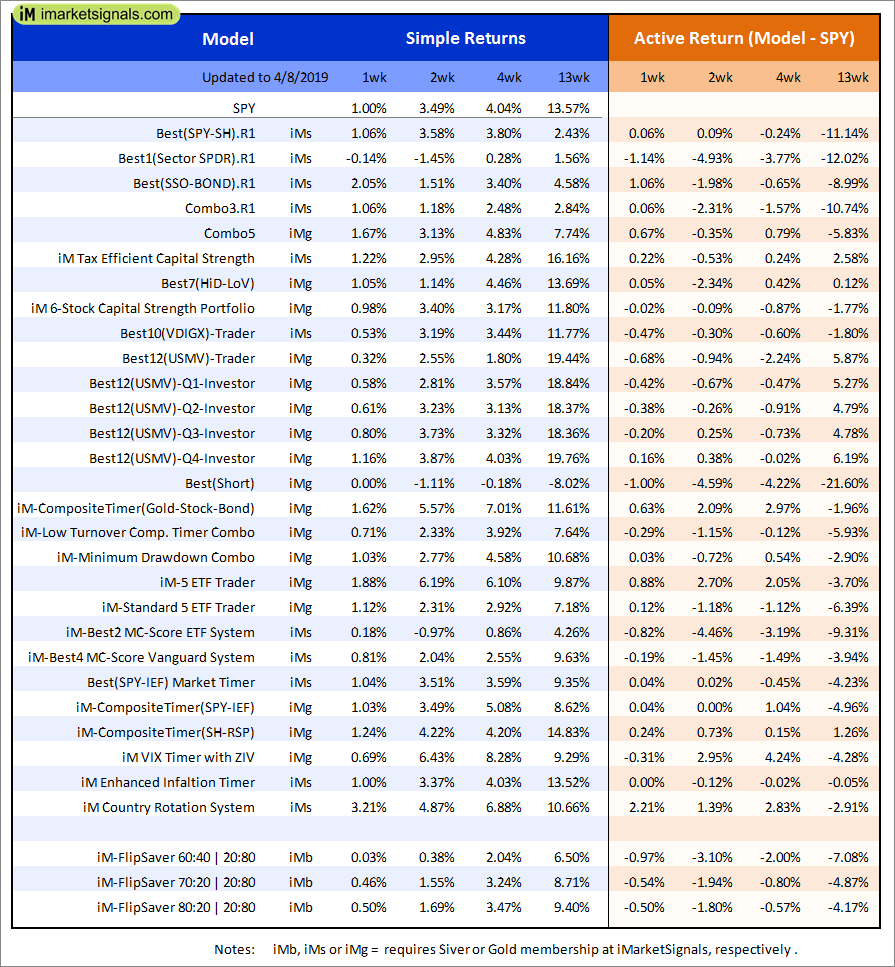
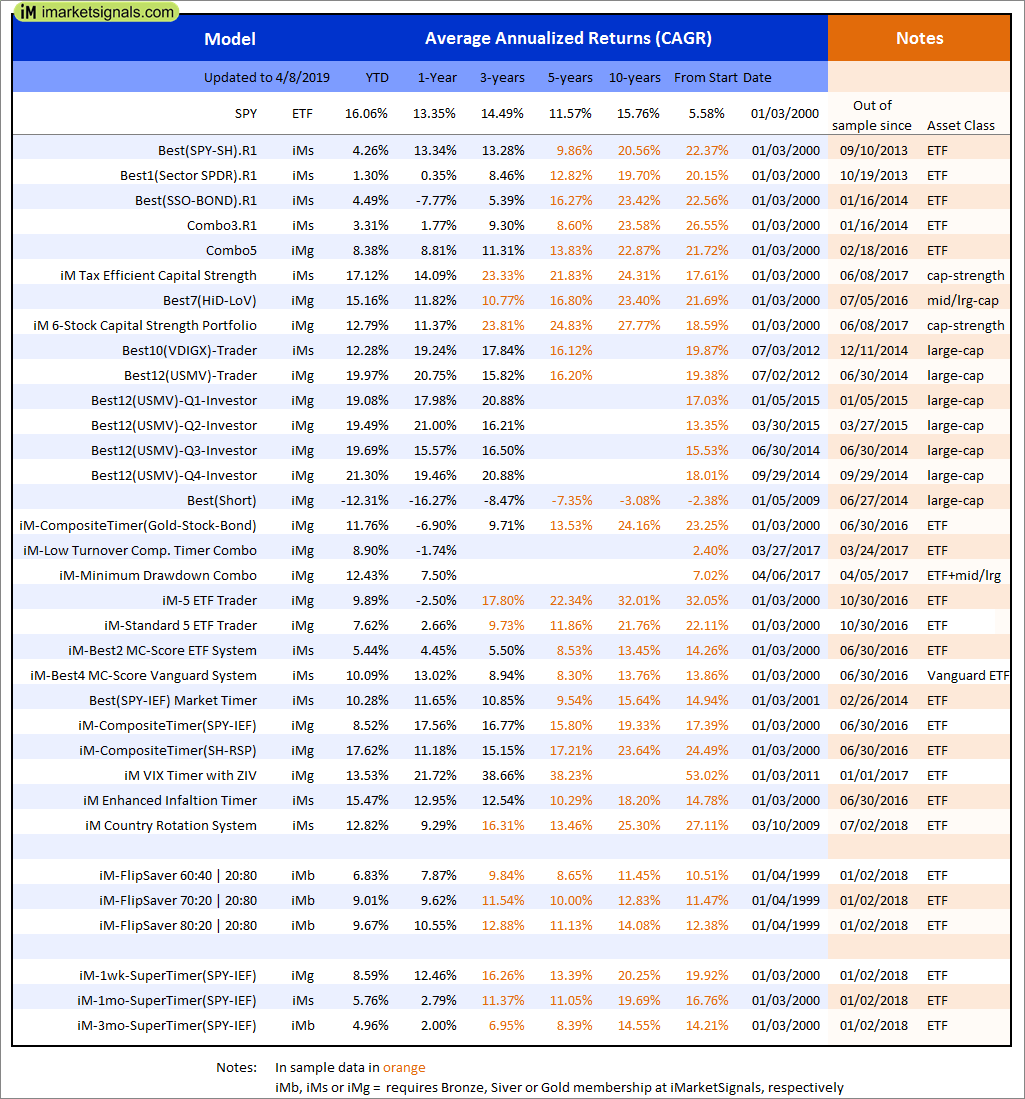
Out of sample performance summary of our models for the past 1, 2, 4 and 13 week periods. The active active return indicates how the models over- or underperformed the benchmark ETF SPY. Also the YTD, and the 1-, 3-, 5- and 10-year annualized returns are shown in the second table |
|
|
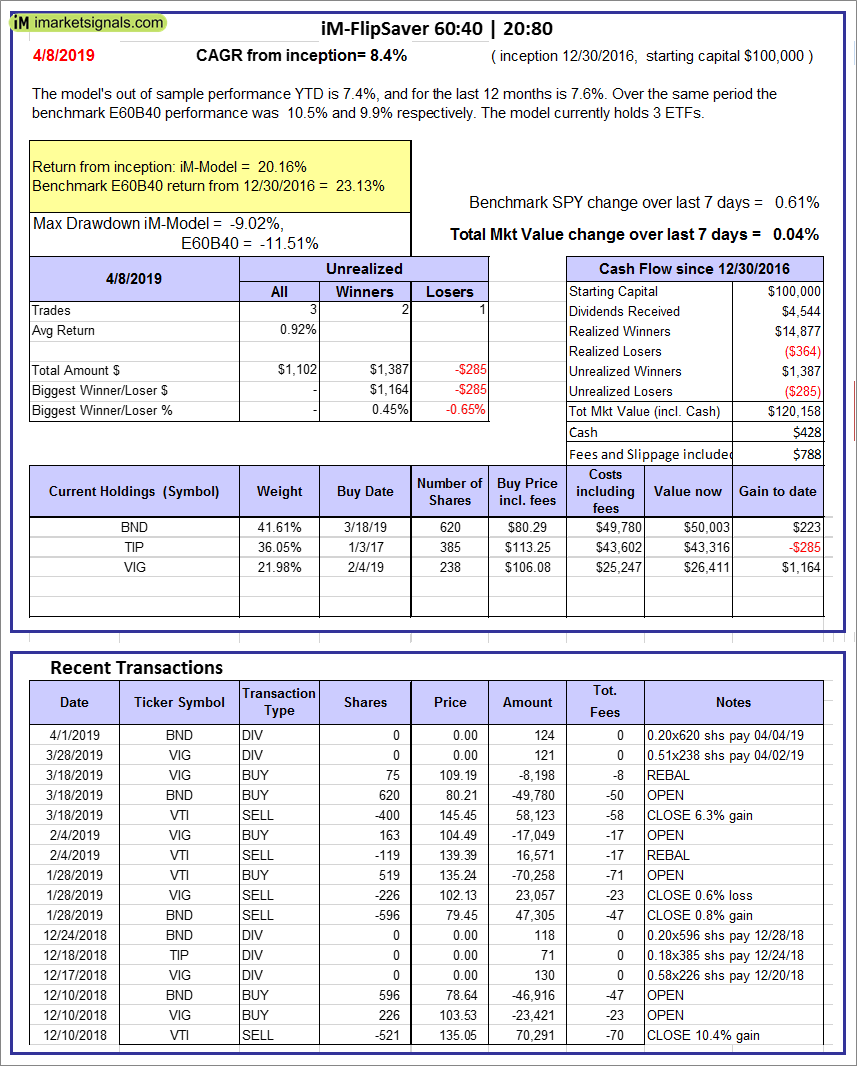
iM-FlipSaver 60:40 | 20:80 – 2017: The model’s out of sample performance YTD is 7.4%, and for the last 12 months is 7.6%. Over the same period the benchmark E60B40 performance was 10.5% and 9.9% respectively. Over the previous week the market value of iM-FlipSaver 80:20 | 20:80 gained 0.04% at a time when SPY gained 0.61%. A starting capital of $100,000 at inception on 7/16/2015 would have grown to $120,158 which includes $428 cash and excludes $788 spent on fees and slippage. |
|
|
iM-FlipSaver 70:30 | 20:80 – 2017: The model’s out of sample performance YTD is 7.9%, and for the last 12 months is 8.5%. Over the same period the benchmark E60B40 performance was 10.5% and 9.9% respectively. Over the previous week the market value of iM-FlipSaver 70:30 | 20:80 gained 0.04% at a time when SPY gained 0.61%. A starting capital of $100,000 at inception on 7/15/2015 would have grown to $122,950 which includes $586 cash and excludes $909 spent on fees and slippage. |
|
|
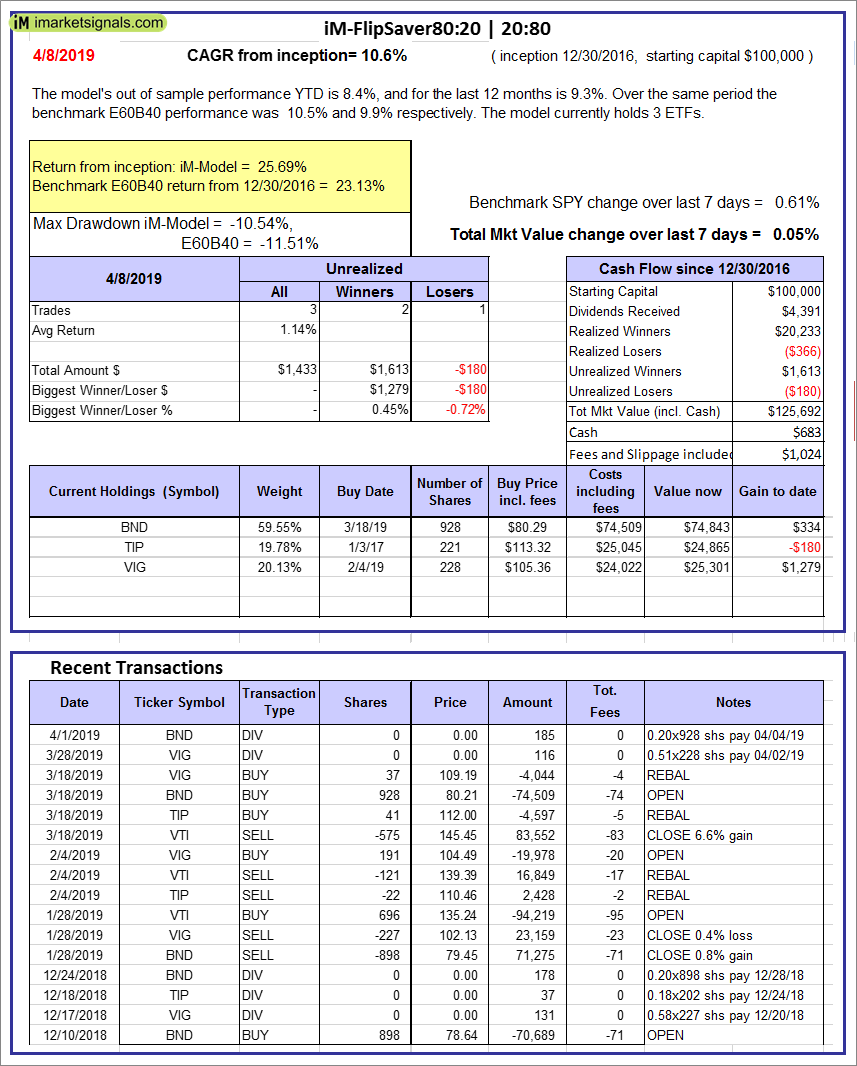
iM-FlipSaver 80:20 | 20:80 – 2017: The model’s out of sample performance YTD is 8.4%, and for the last 12 months is 9.3%. Over the same period the benchmark E60B40 performance was 10.5% and 9.9% respectively. Over the previous week the market value of iM-FlipSaver 80:20 | 20:80 gained 0.05% at a time when SPY gained 0.61%. A starting capital of $100,000 at inception on 1/2/2017 would have grown to $125,692 which includes $683 cash and excludes $1,024 spent on fees and slippage. |
|
|
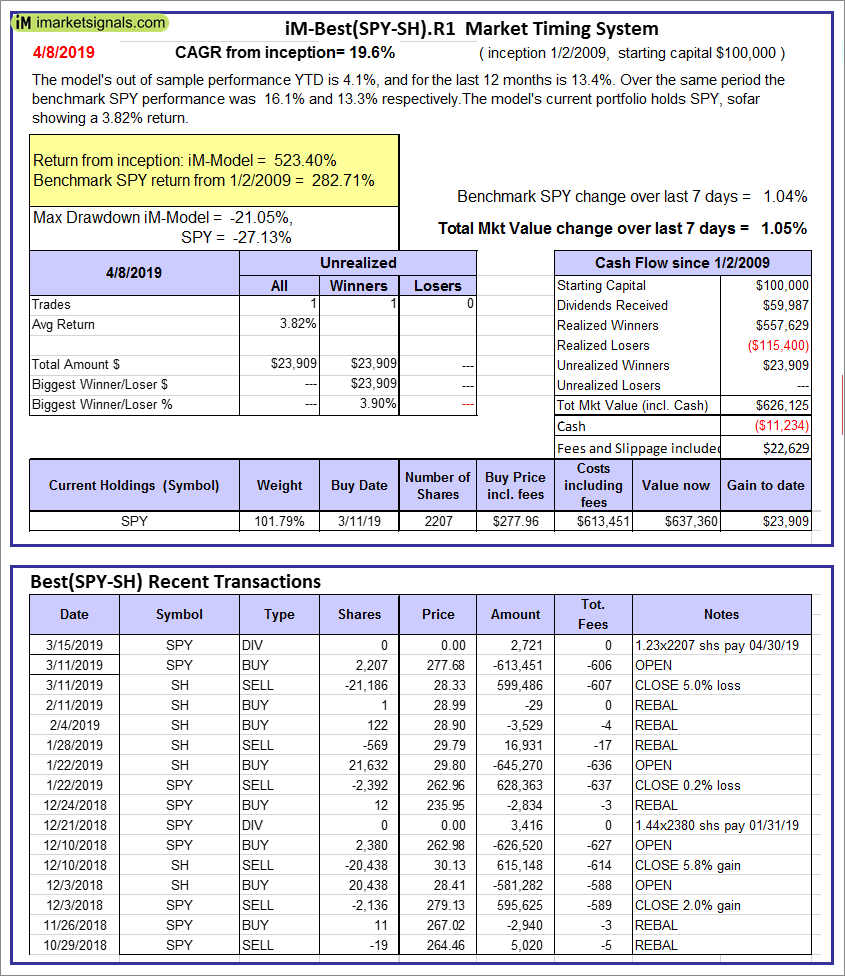
iM-Best(SPY-SH).R1: The model’s out of sample performance YTD is 4.1%, and for the last 12 months is 13.4%. Over the same period the benchmark SPY performance was 16.1% and 13.3% respectively. Over the previous week the market value of Best(SPY-SH) gained 1.05% at a time when SPY gained 1.04%. A starting capital of $100,000 at inception on 1/2/2009 would have grown to $626,125 which includes -$11,234 cash and excludes $22,629 spent on fees and slippage. |
|
|
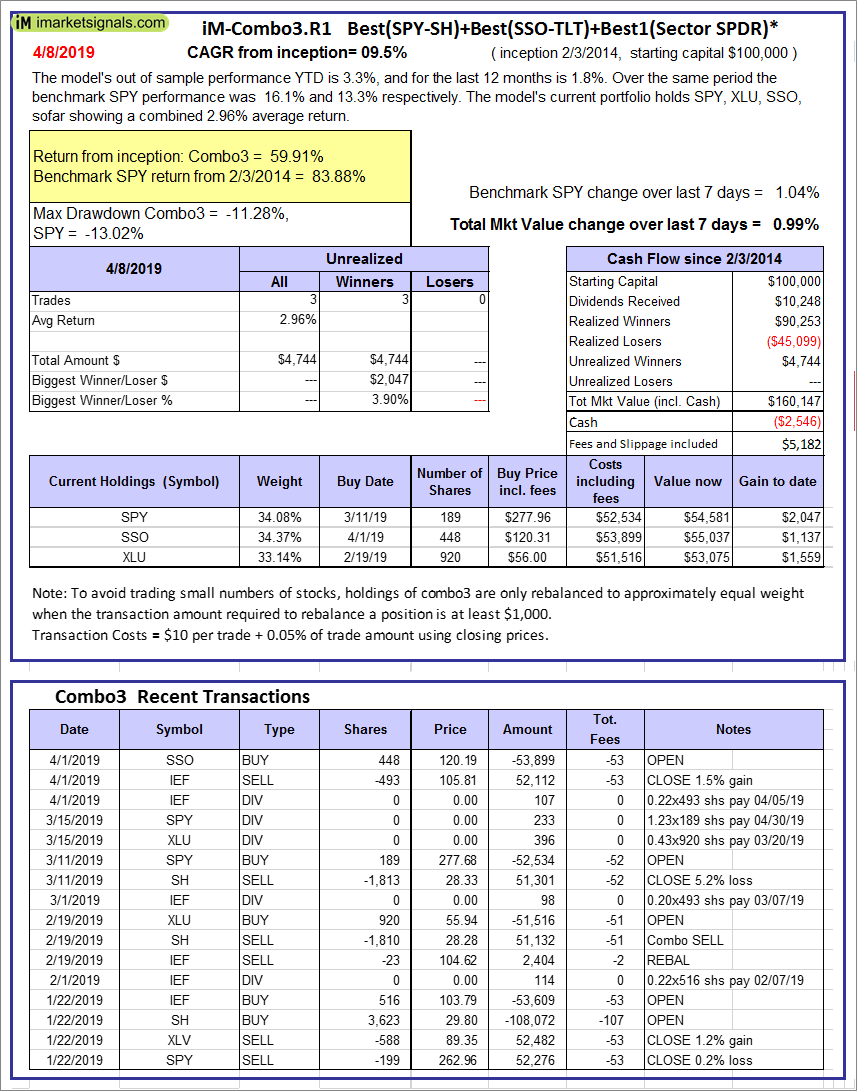
iM-Combo3.R1: The model’s out of sample performance YTD is 3.3%, and for the last 12 months is 1.8%. Over the same period the benchmark SPY performance was 16.1% and 13.3% respectively. Over the previous week the market value of iM-Combo3.R1 gained 0.99% at a time when SPY gained 1.04%. A starting capital of $100,000 at inception on 2/3/2014 would have grown to $160,147 which includes -$2,546 cash and excludes $5,182 spent on fees and slippage. |
|
|
iM-Combo5: The model’s out of sample performance YTD is 8.1%, and for the last 12 months is 8.6%. Over the same period the benchmark SPY performance was 16.1% and 13.3% respectively. Over the previous week the market value of iM-Combo5 gained 1.46% at a time when SPY gained 1.04%. A starting capital of $100,000 at inception on 2/22/2016 would have grown to $137,683 which includes $1,744 cash and excludes $0 spent on fees and slippage. |
|
|
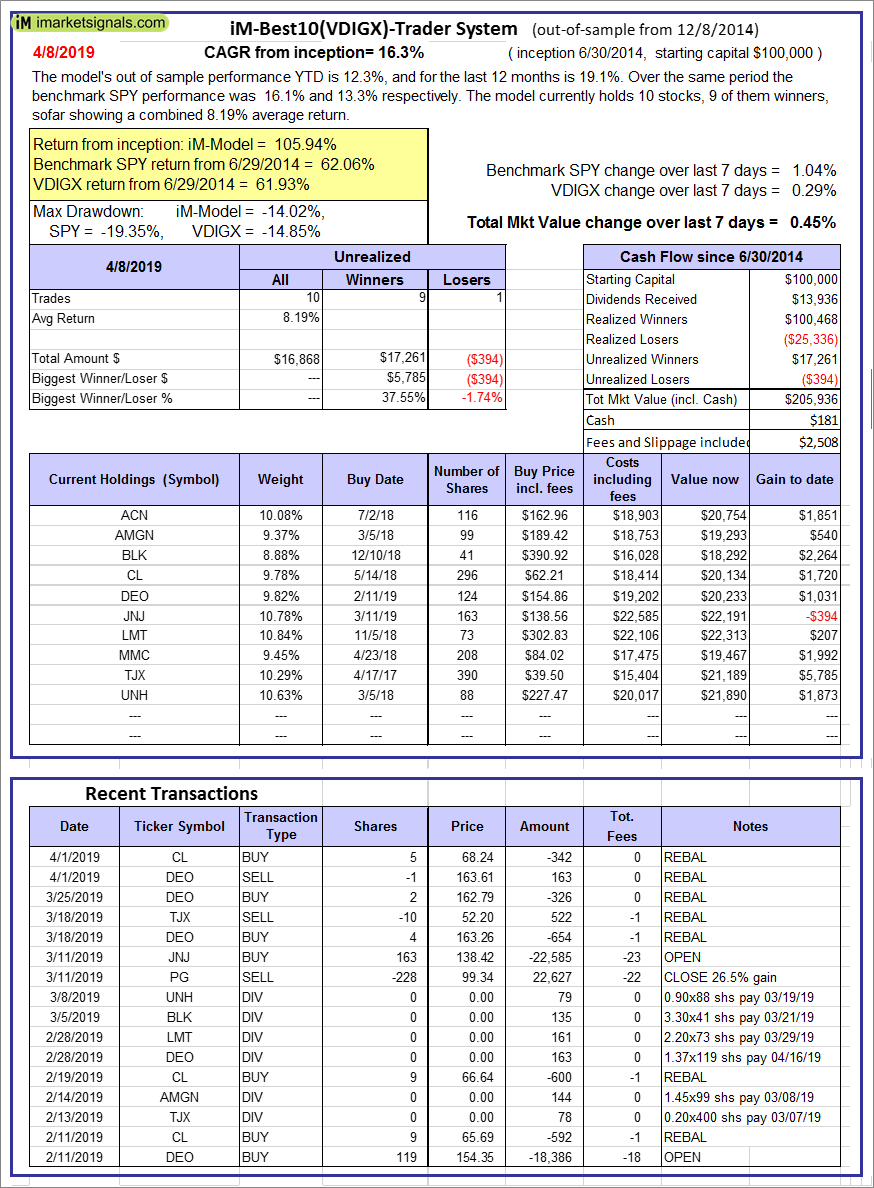
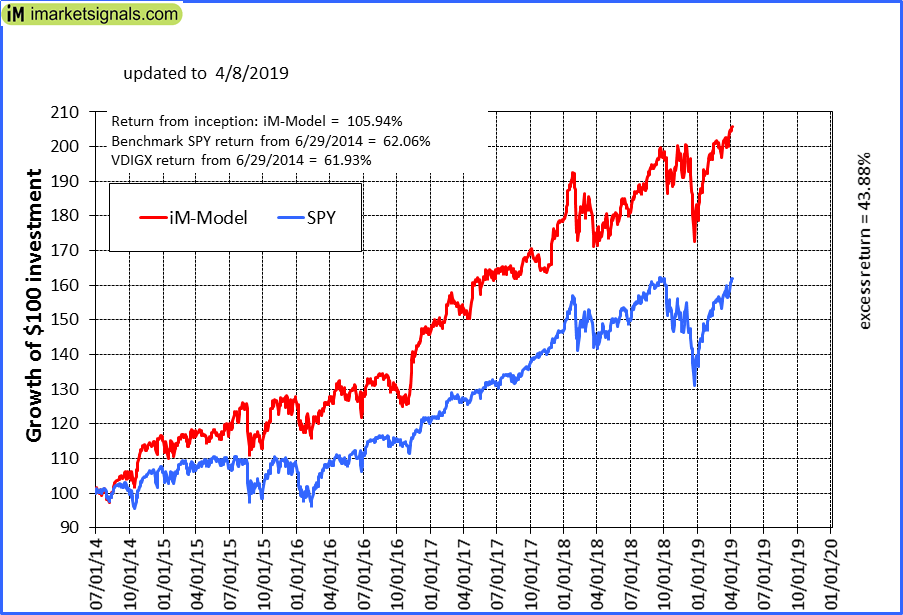
iM-Best10(VDIGX)-Trader: The model’s out of sample performance YTD is 12.3%, and for the last 12 months is 19.1%. Over the same period the benchmark SPY performance was 16.1% and 13.3% respectively. Since inception, on 7/1/2014, the model gained 105.94% while the benchmark SPY gained 62.06% and VDIGX gained 61.93% over the same period. Over the previous week the market value of iM-Best10(VDIGX) gained 0.45% at a time when SPY gained 1.04%. A starting capital of $100,000 at inception on 7/1/2014 would have grown to $205,936 which includes $181 cash and excludes $2,508 spent on fees and slippage. |
|
|
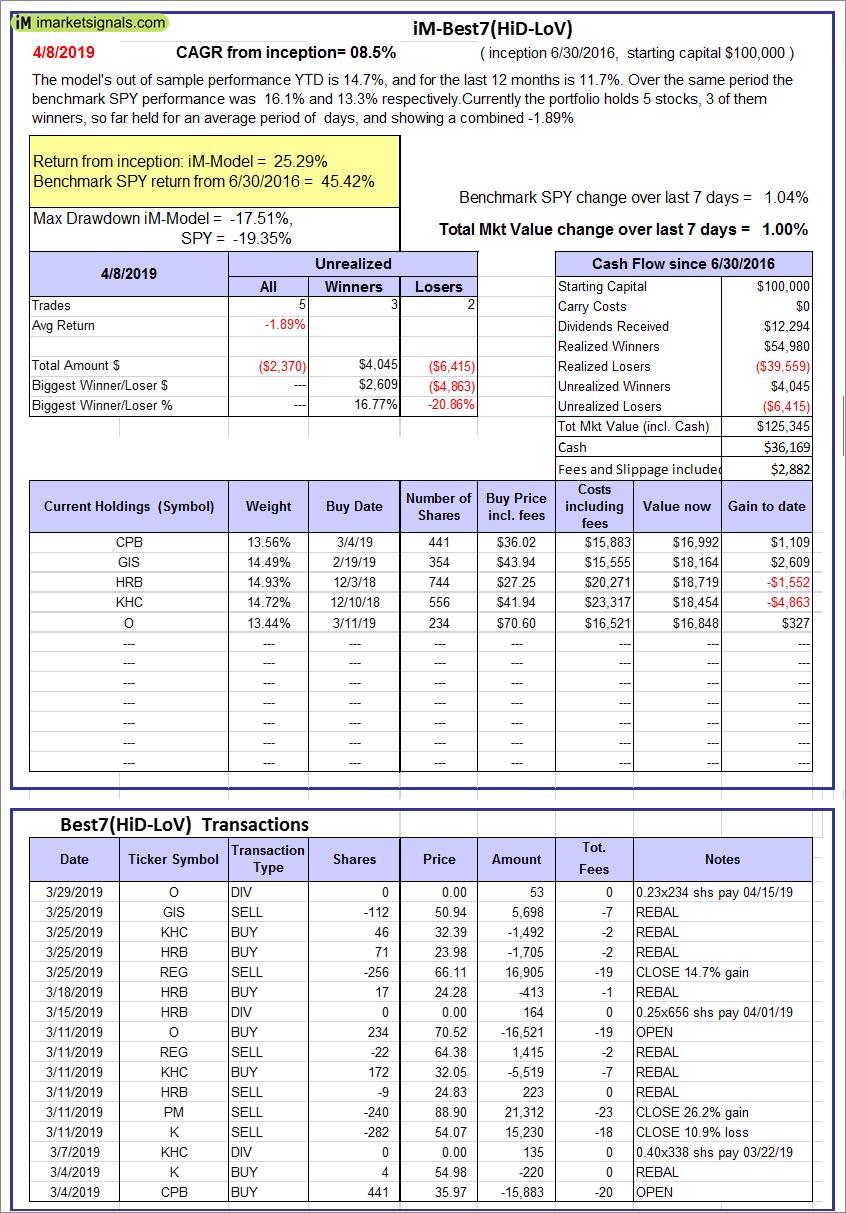
iM-Best7(HiD-LoV): The model’s out of sample performance YTD is 14.7%, and for the last 12 months is 11.7%. Over the same period the benchmark SPY performance was 16.1% and 13.3% respectively. Over the previous week the market value of iM-Best7(HiD-LoV) gained 1.00% at a time when SPY gained 1.04%. A starting capital of $100,000 at inception on 6/30/2016 would have grown to $125,345 which includes $36,169 cash and excludes $2,882 spent on fees and slippage. |
|
|
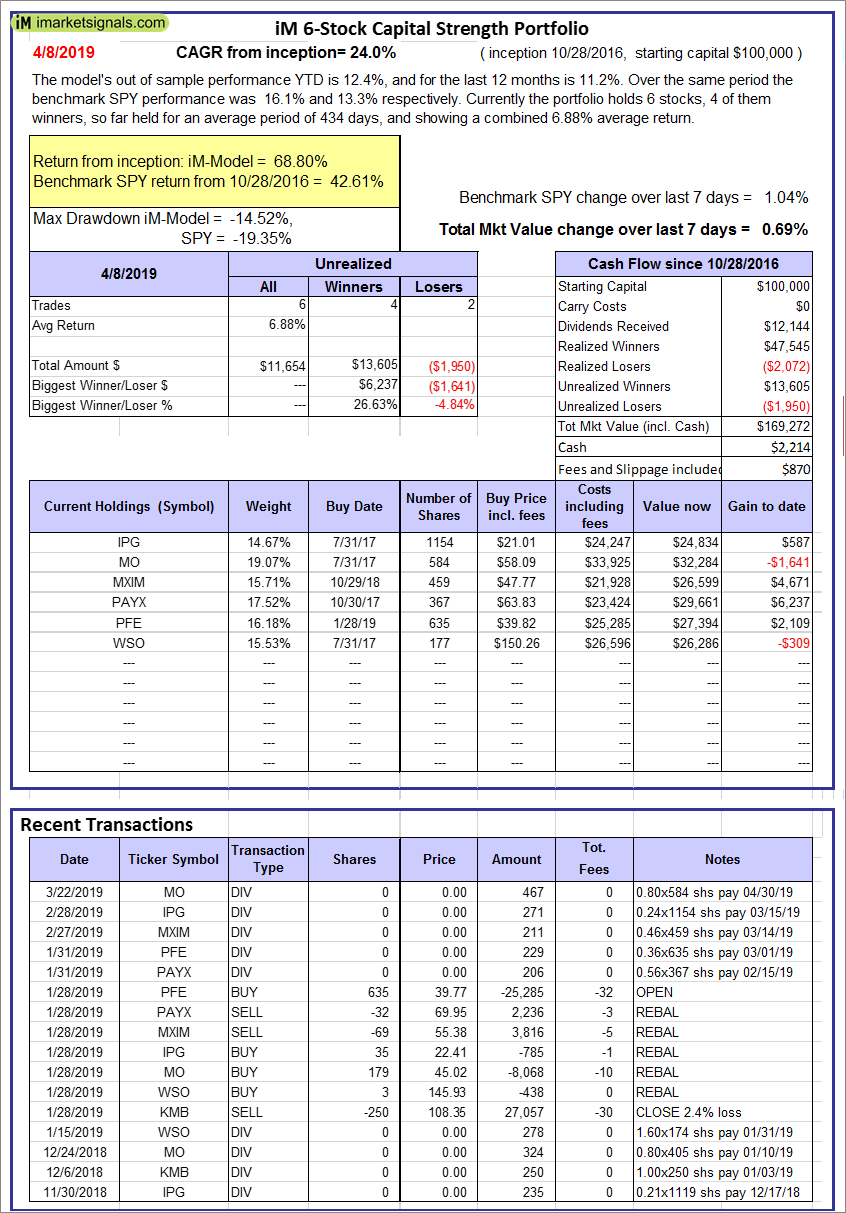
iM 6-Stock Capital Strength Portfolio: The model’s out of sample performance YTD is 12.4%, and for the last 12 months is 11.2%. Over the same period the benchmark SPY performance was 16.1% and 13.3% respectively. Over the previous week the market value of the iM 6-Stock Capital Strength Portfolio gained 0.69% at a time when SPY gained 1.04%. A starting capital of $100,000 at inception on 10/28/2016 would have grown to $169,272 which includes $2,214 cash and excludes $870 spent on fees and slippage. |
|
|
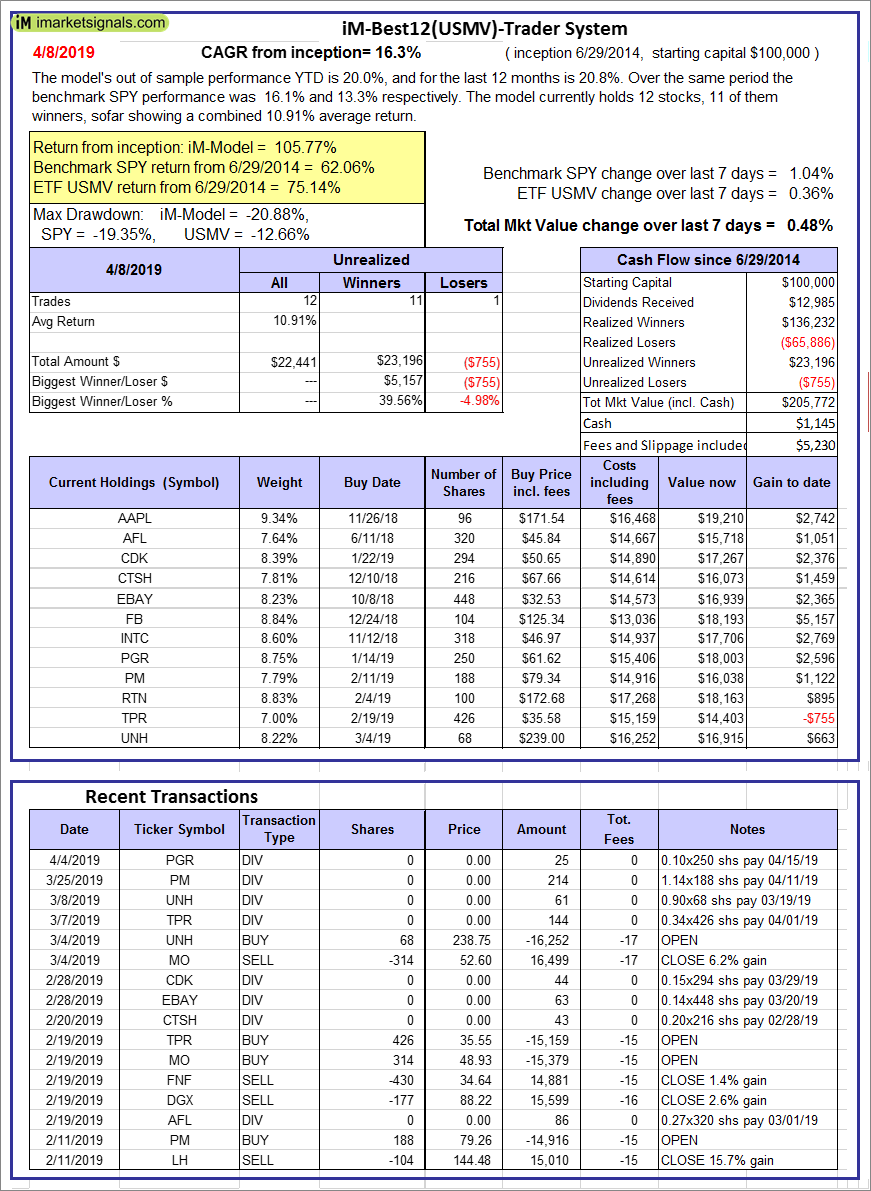
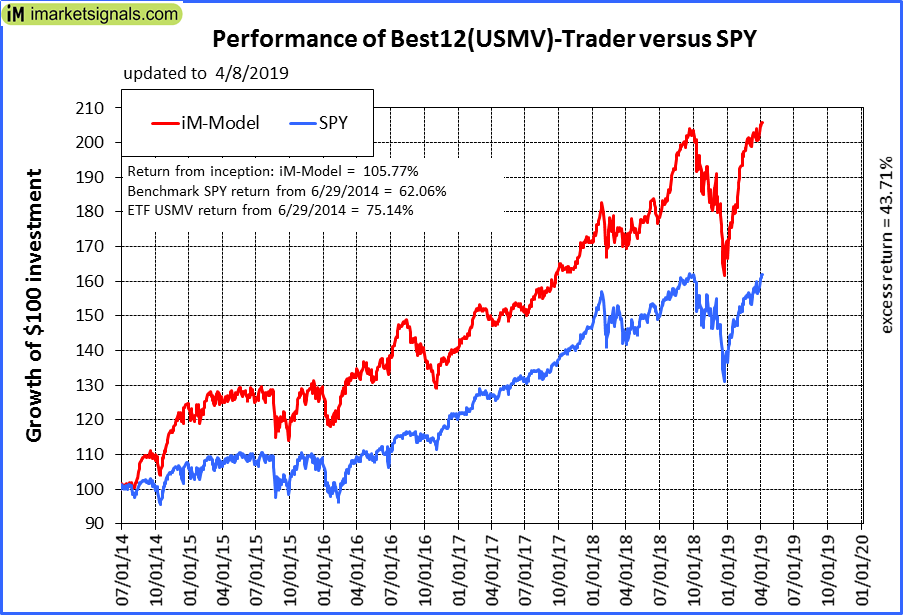
iM-Best12(USMV)-Trader: The model’s out of sample performance YTD is 20.0%, and for the last 12 months is 20.8%. Over the same period the benchmark SPY performance was 16.1% and 13.3% respectively. Since inception, on 6/30/2014, the model gained 105.77% while the benchmark SPY gained 62.06% and the ETF USMV gained 75.14% over the same period. Over the previous week the market value of iM-Best12(USMV)-Trader gained 0.48% at a time when SPY gained 1.04%. A starting capital of $100,000 at inception on 6/30/2014 would have grown to $205,772 which includes $1,145 cash and excludes $5,230 spent on fees and slippage. |
|
|
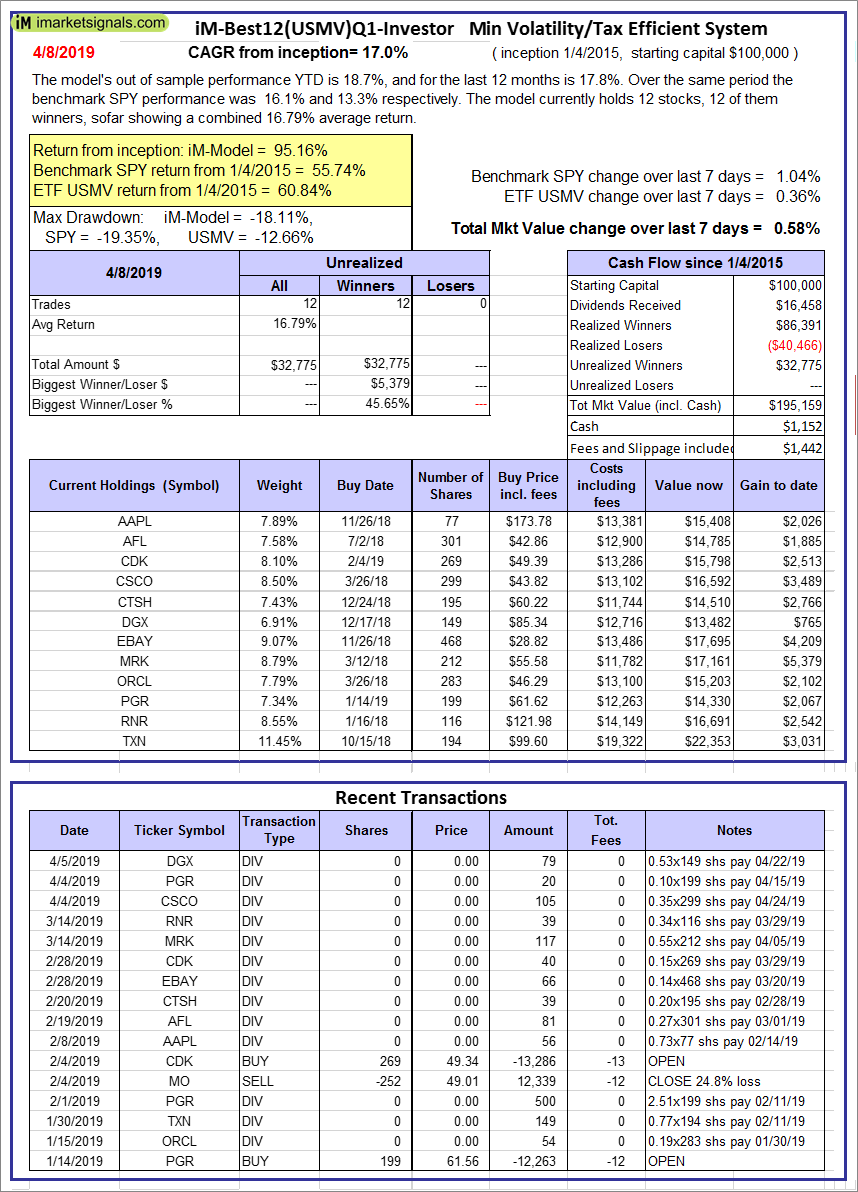
iM-Best12(USMV)Q1-Investor: The model’s out of sample performance YTD is 18.7%, and for the last 12 months is 17.8%. Over the same period the benchmark SPY performance was 16.1% and 13.3% respectively. Since inception, on 1/5/2015, the model gained 95.16% while the benchmark SPY gained 55.74% and the ETF USMV gained 60.84% over the same period. Over the previous week the market value of iM-Best12(USMV)Q1 gained 0.58% at a time when SPY gained 1.04%. A starting capital of $100,000 at inception on 1/5/2015 would have grown to $195,159 which includes $1,152 cash and excludes $1,442 spent on fees and slippage. |
|
|
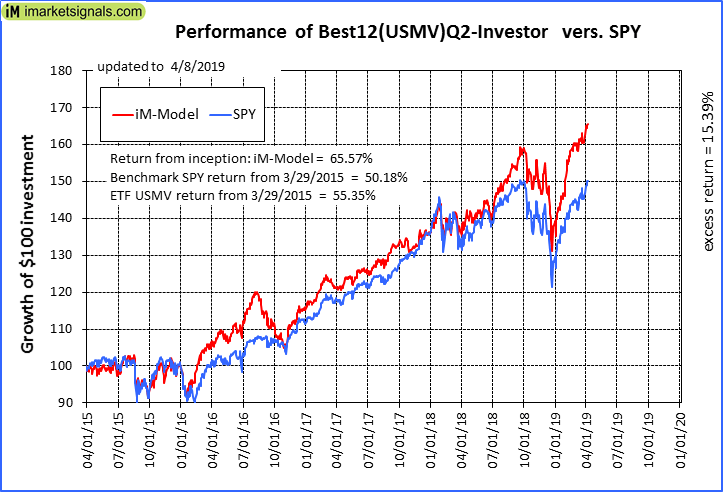
iM-Best12(USMV)Q2-Investor: The model’s out of sample performance YTD is 19.2%, and for the last 12 months is 21.0%. Over the same period the benchmark SPY performance was 16.1% and 13.3% respectively. Since inception, on 3/30/2015, the model gained 65.57% while the benchmark SPY gained 50.18% and the ETF USMV gained 55.35% over the same period. Over the previous week the market value of iM-Best12(USMV)Q2 gained 0.61% at a time when SPY gained 1.04%. A starting capital of $100,000 at inception on 3/30/2015 would have grown to $165,567 which includes -$83 cash and excludes $1,310 spent on fees and slippage. |
|
|
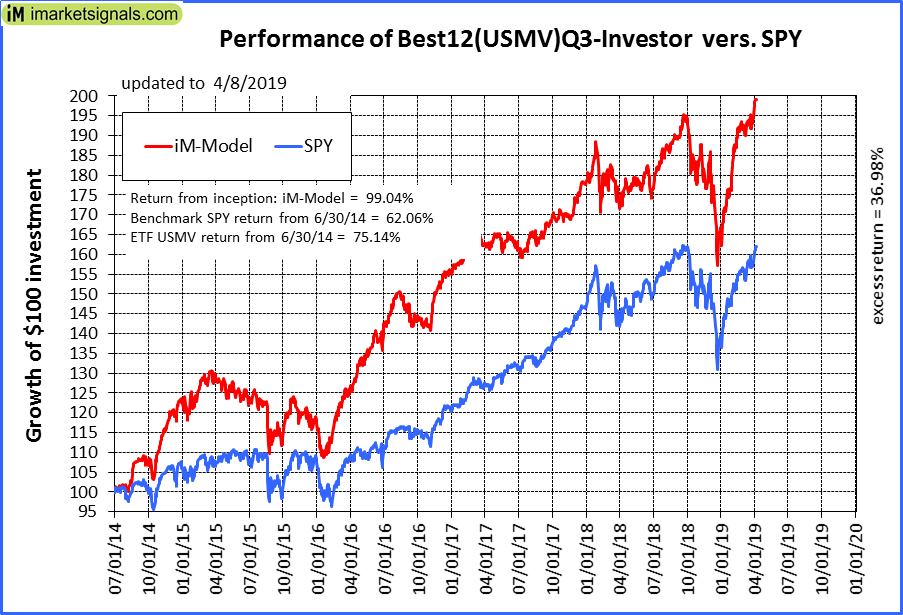
iM-Best12(USMV)Q3-Investor: The model’s out of sample performance YTD is 19.4%, and for the last 12 months is 15.5%. Over the same period the benchmark SPY performance was 16.1% and 13.3% respectively. Since inception, on 7/1/2014, the model gained 99.04% while the benchmark SPY gained 62.06% and the ETF USMV gained 75.14% over the same period. Over the previous week the market value of iM-Best12(USMV)Q3 gained 0.80% at a time when SPY gained 1.04%. A starting capital of $100,000 at inception on 7/1/2014 would have grown to $199,040 which includes $328 cash and excludes $1,917 spent on fees and slippage. |
|
|
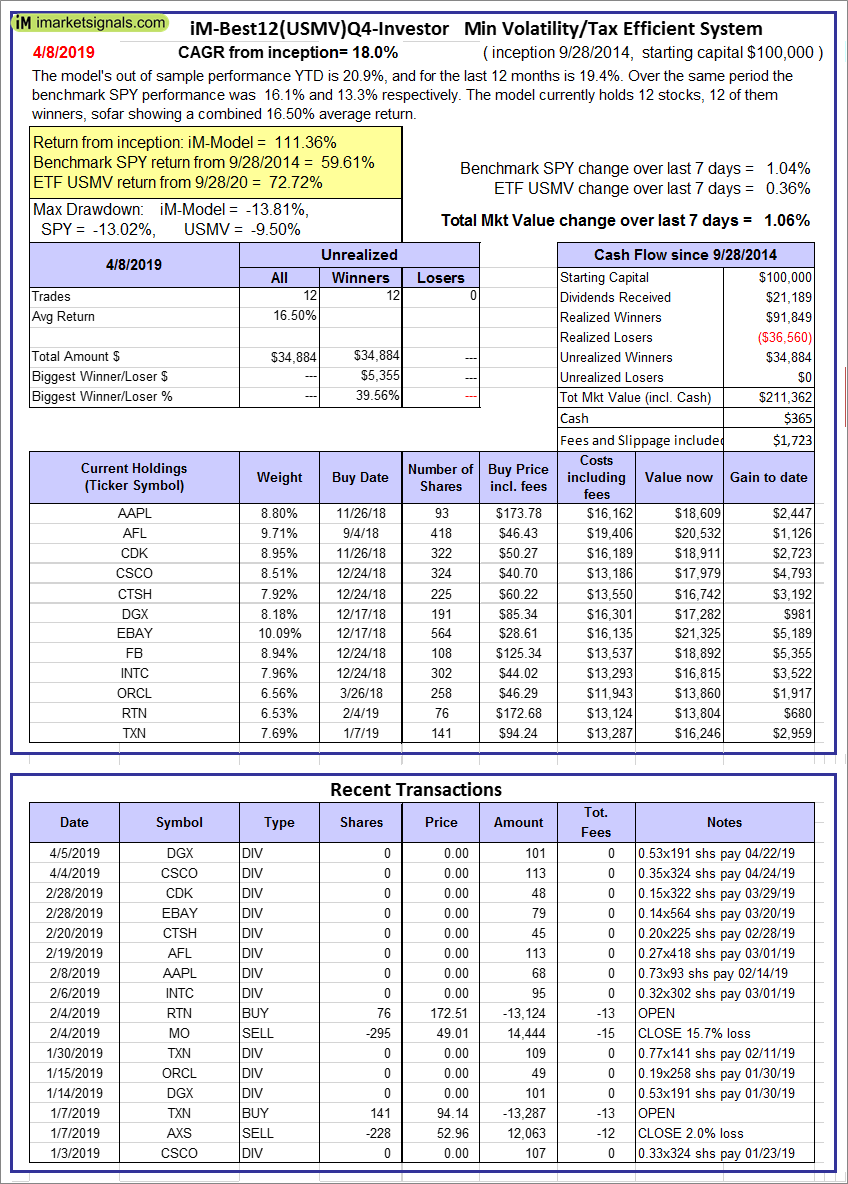
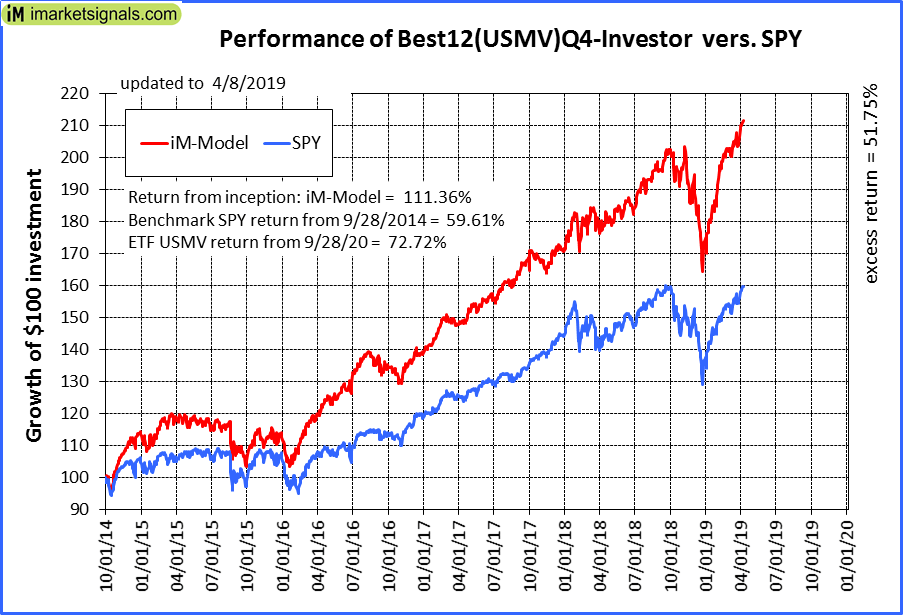
iM-Best12(USMV)Q4-Investor: Since inception, on 9/29/2014, the model gained 111.36% while the benchmark SPY gained 59.61% and the ETF USMV gained 72.72% over the same period. Over the previous week the market value of iM-Best12(USMV)Q4 gained 1.06% at a time when SPY gained 1.04%. A starting capital of $100,000 at inception on 9/29/2014 would have grown to $211,362 which includes $365 cash and excludes $1,723 spent on fees and slippage. |
|
|
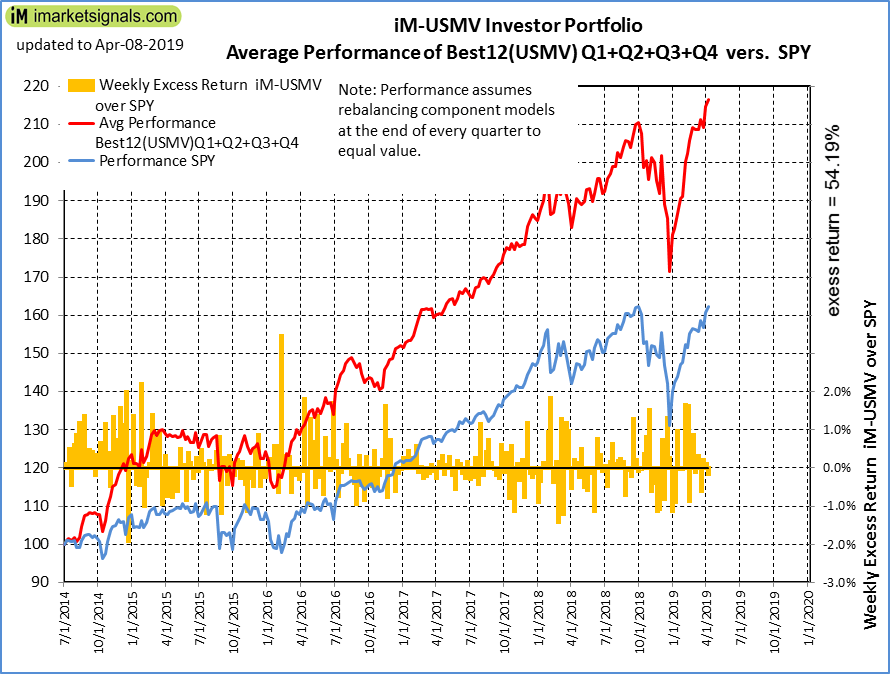
Average Performance of iM-Best12(USMV)Q1+Q2+Q3+Q4-Investor resulted in an excess return of 54.19% over SPY. (see iM-USMV Investor Portfolio) |
|
|
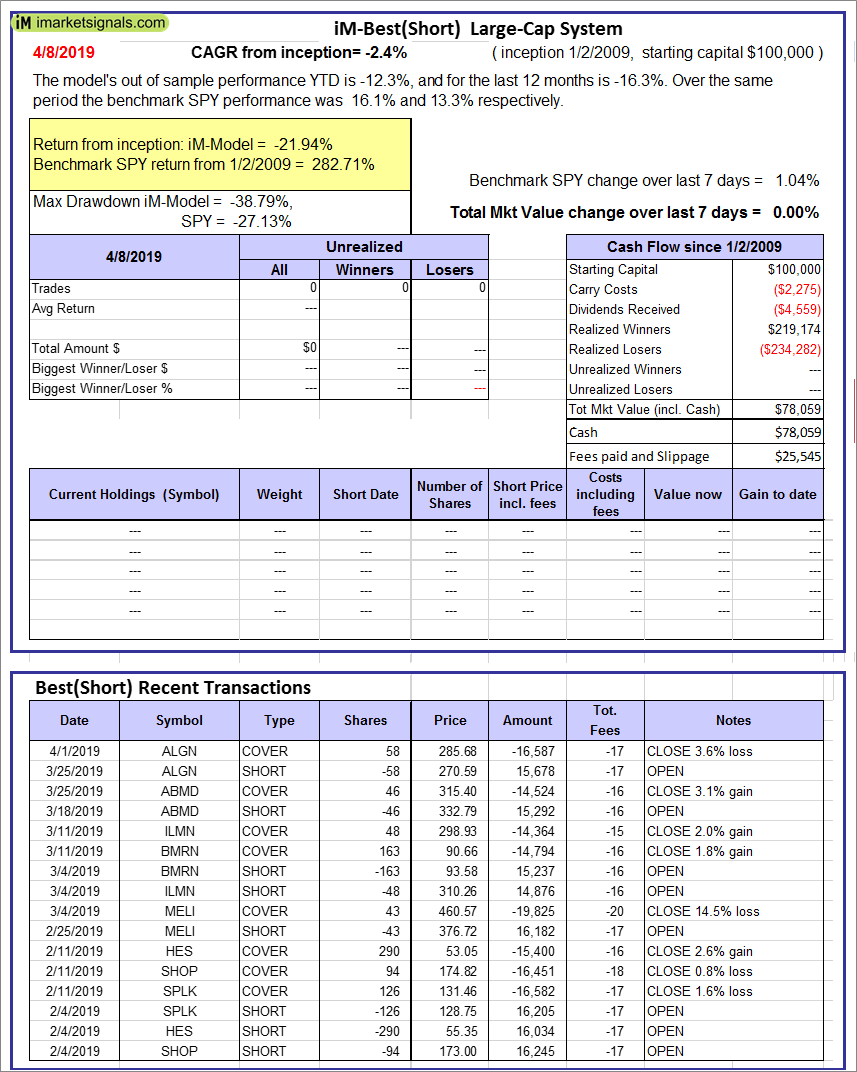
iM-Best(Short): The model’s out of sample performance YTD is -12.3%, and for the last 12 months is -16.3%. Over the same period the benchmark SPY performance was 16.1% and 13.3% respectively. Over the previous week the market value of iM-Best(Short) gained 0.00% at a time when SPY gained 1.04%. Over the period 1/2/2009 to 4/8/2019 the starting capital of $100,000 would have grown to $78,059 which includes $78,059 cash and excludes $25,545 spent on fees and slippage. |
|
|
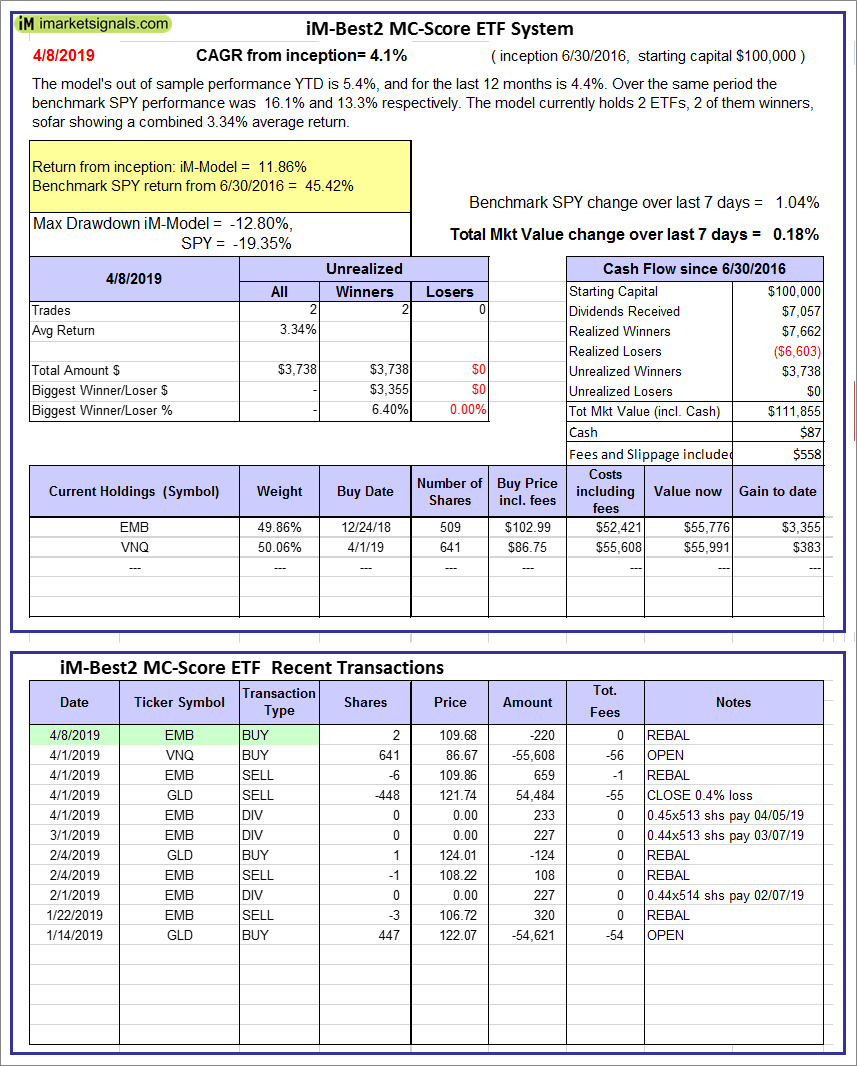
iM-Best2 MC-Score ETF System: The model’s out of sample performance YTD is 5.4%, and for the last 12 months is 4.4%. Over the same period the benchmark SPY performance was 16.1% and 13.3% respectively. Over the previous week the market value of the iM-Best2 MC-Score ETF System gained 0.18% at a time when SPY gained 1.04%. A starting capital of $100,000 at inception on 6/30/2016 would have grown to $111,855 which includes $87 cash and excludes $558 spent on fees and slippage. |
|
|
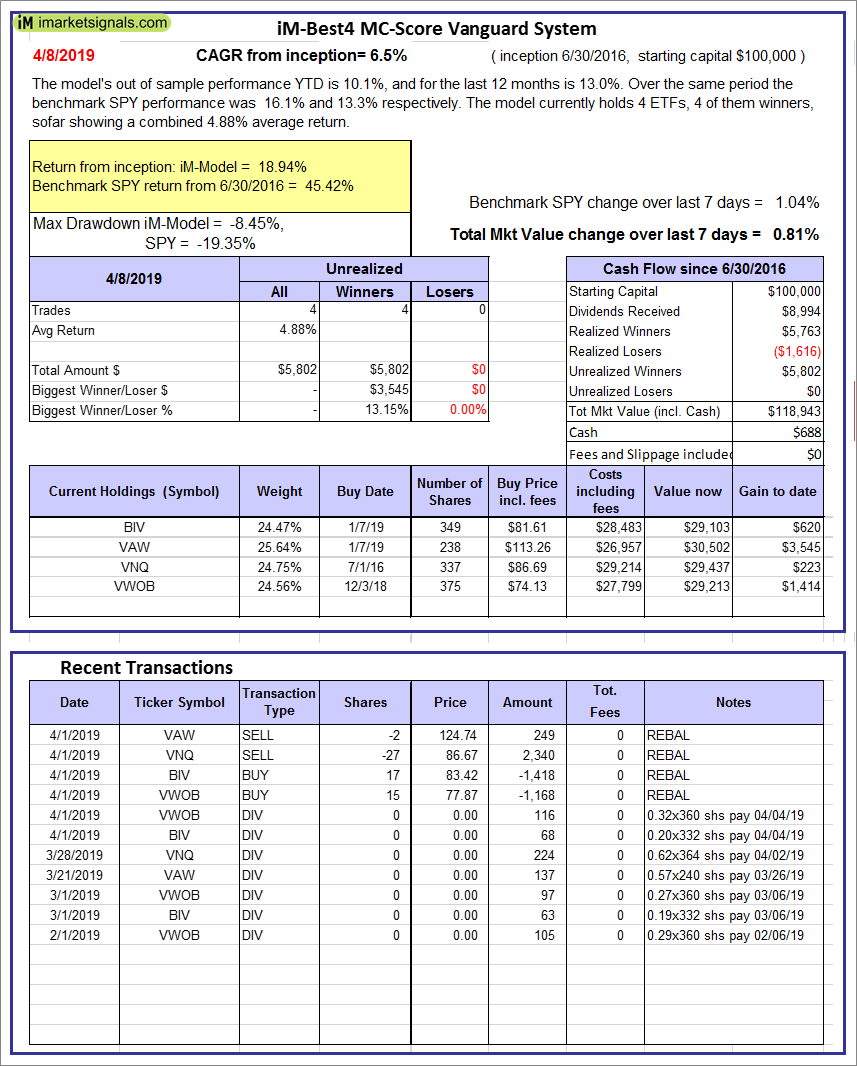
iM-Best4 MC-Score Vanguard System: The model’s out of sample performance YTD is 10.1%, and for the last 12 months is 13.0%. Over the same period the benchmark SPY performance was 16.1% and 13.3% respectively. Over the previous week the market value of the iM-Best4 MC-Score Vanguard System gained 0.81% at a time when SPY gained 1.04%. A starting capital of $100,000 at inception on 6/30/2016 would have grown to $118,943 which includes $688 cash and excludes $00 spent on fees and slippage. |
|
|
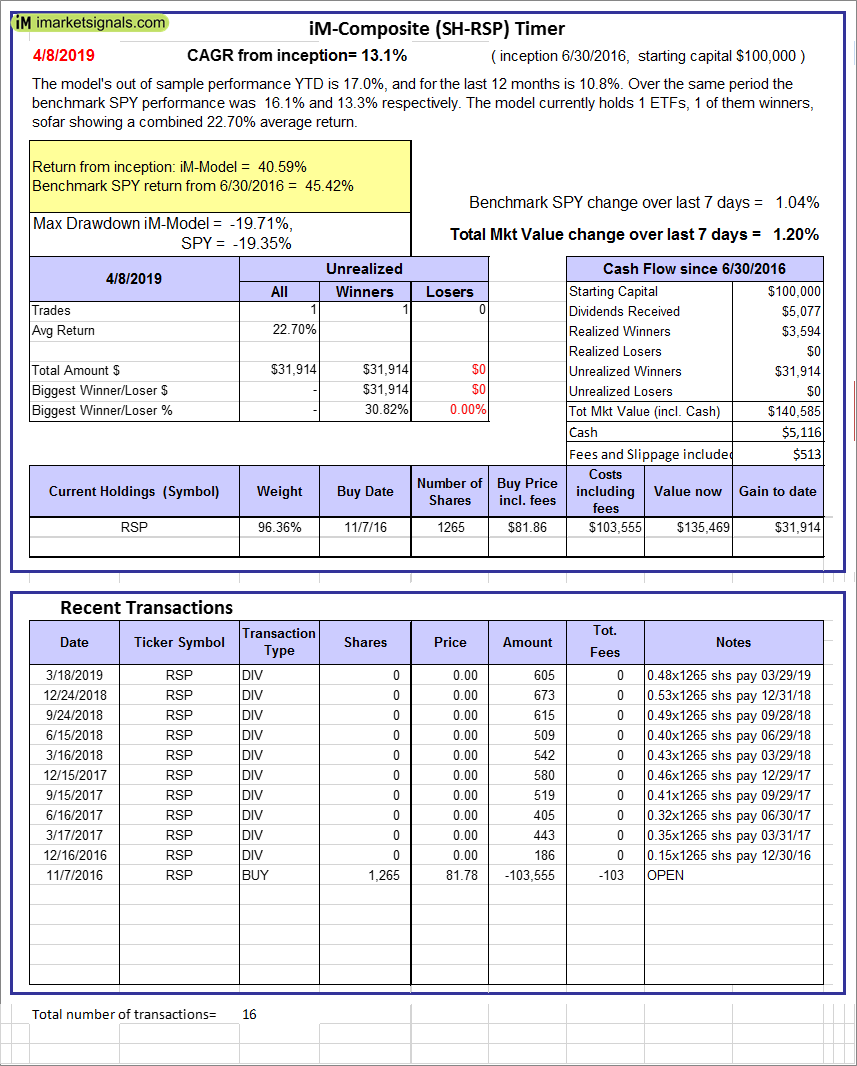
iM-Composite (SH-RSP) Timer: The model’s out of sample performance YTD is 17.0%, and for the last 12 months is 10.8%. Over the same period the benchmark SPY performance was 16.1% and 13.3% respectively. Over the previous week the market value of the iM-Composite (SH-RSP) Timer gained 1.20% at a time when SPY gained 1.04%. A starting capital of $100,000 at inception on 6/30/2016 would have grown to $140,585 which includes $5,116 cash and excludes $513 spent on fees and slippage. |
|
|
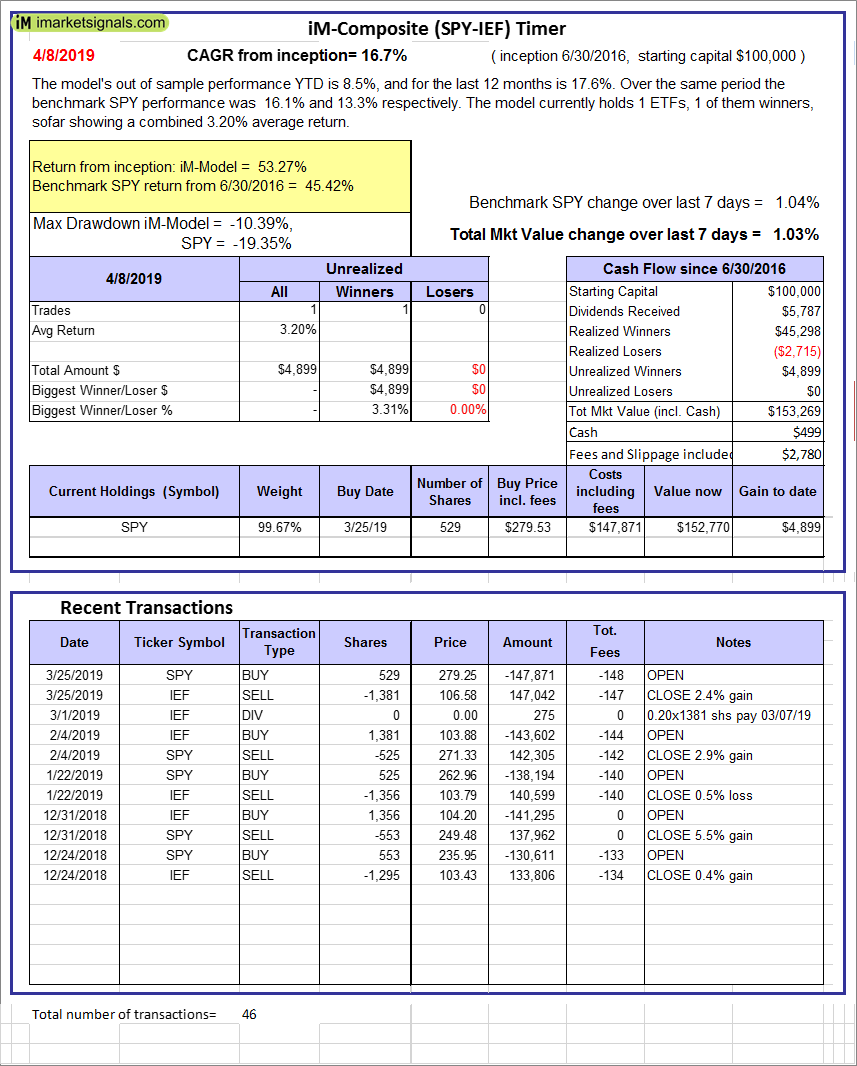
iM-Composite (SPY-IEF) Timer: The model’s out of sample performance YTD is 8.5%, and for the last 12 months is 17.6%. Over the same period the benchmark SPY performance was 16.1% and 13.3% respectively. Over the previous week the market value of the iM-Composite (SPY-IEF) Timer gained 1.03% at a time when SPY gained 1.04%. A starting capital of $100,000 at inception on 6/30/2016 would have grown to $153,269 which includes $499 cash and excludes $2,780 spent on fees and slippage. |
|
|
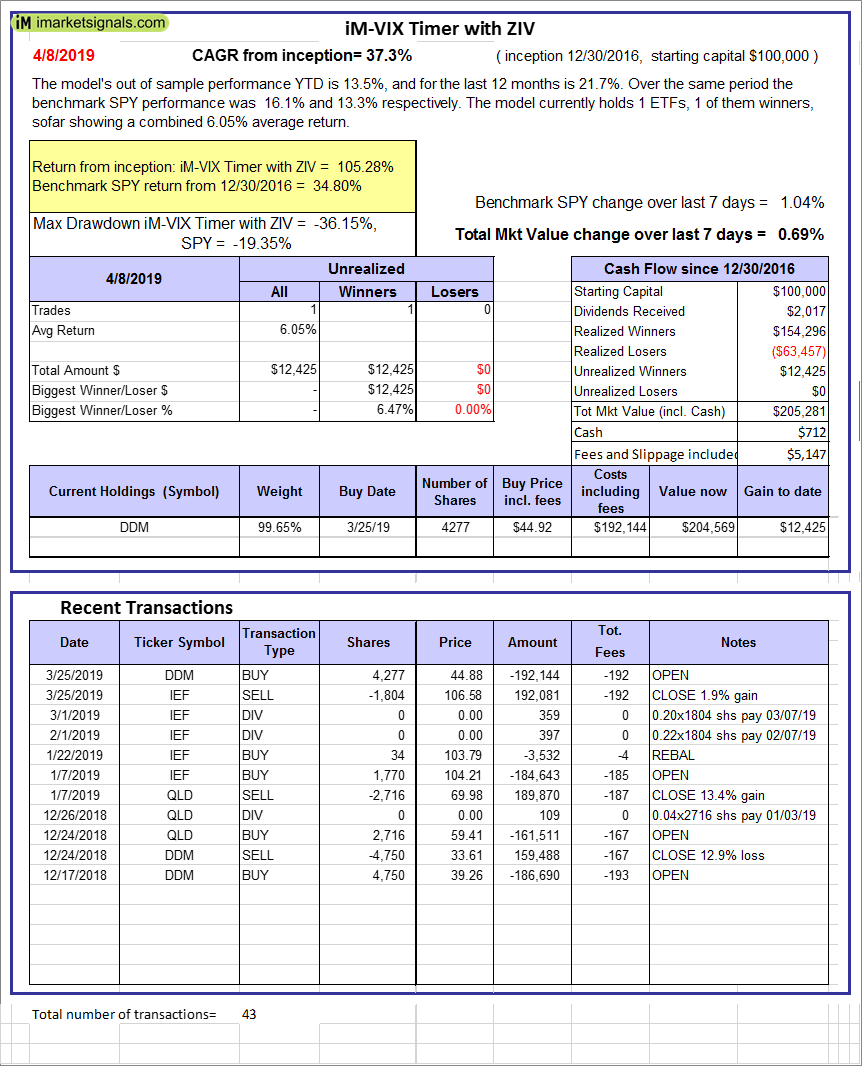
iM-VIX Timer with ZIV: The model’s out of sample performance YTD is 13.5%, and for the last 12 months is 21.7%. Over the same period the benchmark SPY performance was 16.1% and 13.3% respectively. Over the previous week the market value of the iM-VIX Timer with ZIV gained 0.69% at a time when SPY gained 1.04%. A starting capital of $100,000 at inception on 6/30/2016 would have grown to $205,281 which includes $712 cash and excludes $5,147 spent on fees and slippage. |
|
|
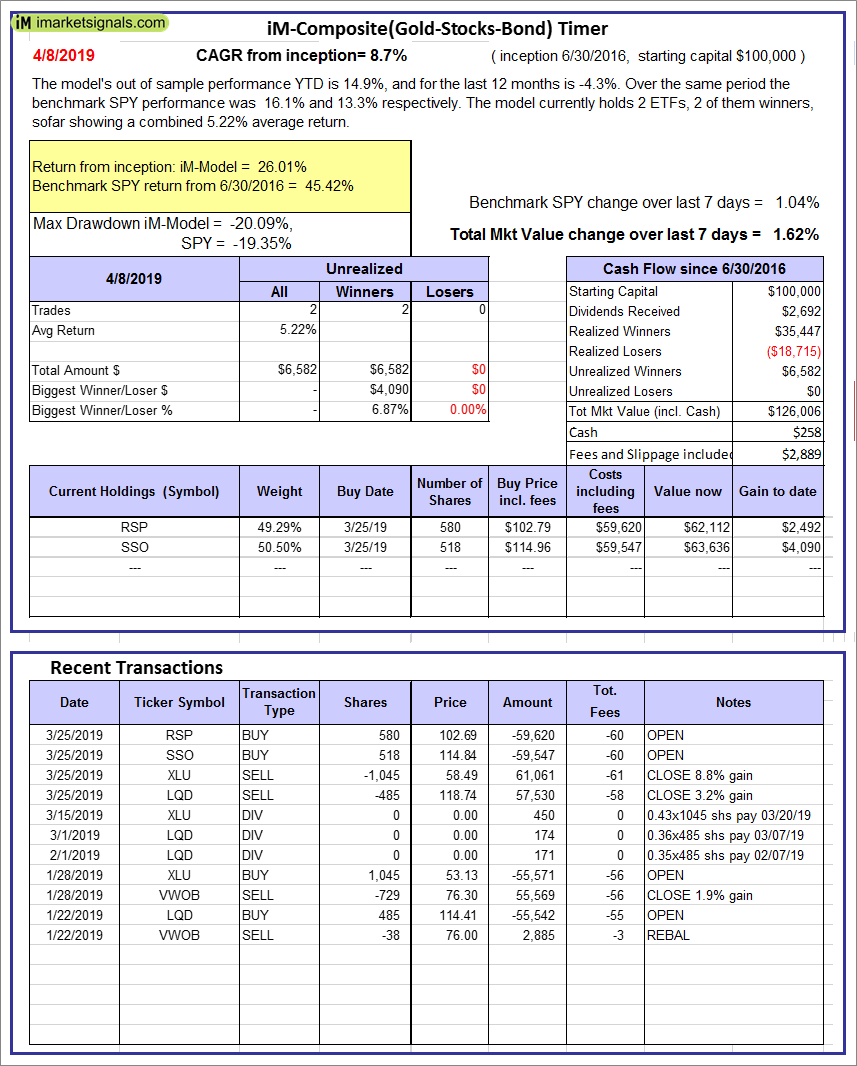
iM-Composite(Gold-Stocks-Bond) Timer: The model’s out of sample performance YTD is 14.9%, and for the last 12 months is -4.3%. Over the same period the benchmark SPY performance was 16.1% and 13.3% respectively. Over the previous week the market value of the iM-Composite(Gold-Stocks-Bond) Timer gained 1.62% at a time when SPY gained 1.04%. A starting capital of $100,000 at inception on 6/30/2016 would have grown to $126,006 which includes $258 cash and excludes $2,889 spent on fees and slippage. |
|
|
iM-Low Turnover Composite Timer Combo: The model’s out of sample performance YTD is 8.9%, and for the last 12 months is -1.7%. Over the same period the benchmark SPY performance was 16.1% and 13.3% respectively. Over the previous week the market value of the iM-Low Turnover Composite Timer Combo gained 0.71% at a time when SPY gained 1.04%. A starting capital of $100,000 at inception on 3/24/27 would have grown to $104,927 which includes $1,010 cash and excludes $675 spent on fees and slippage. |
|
|
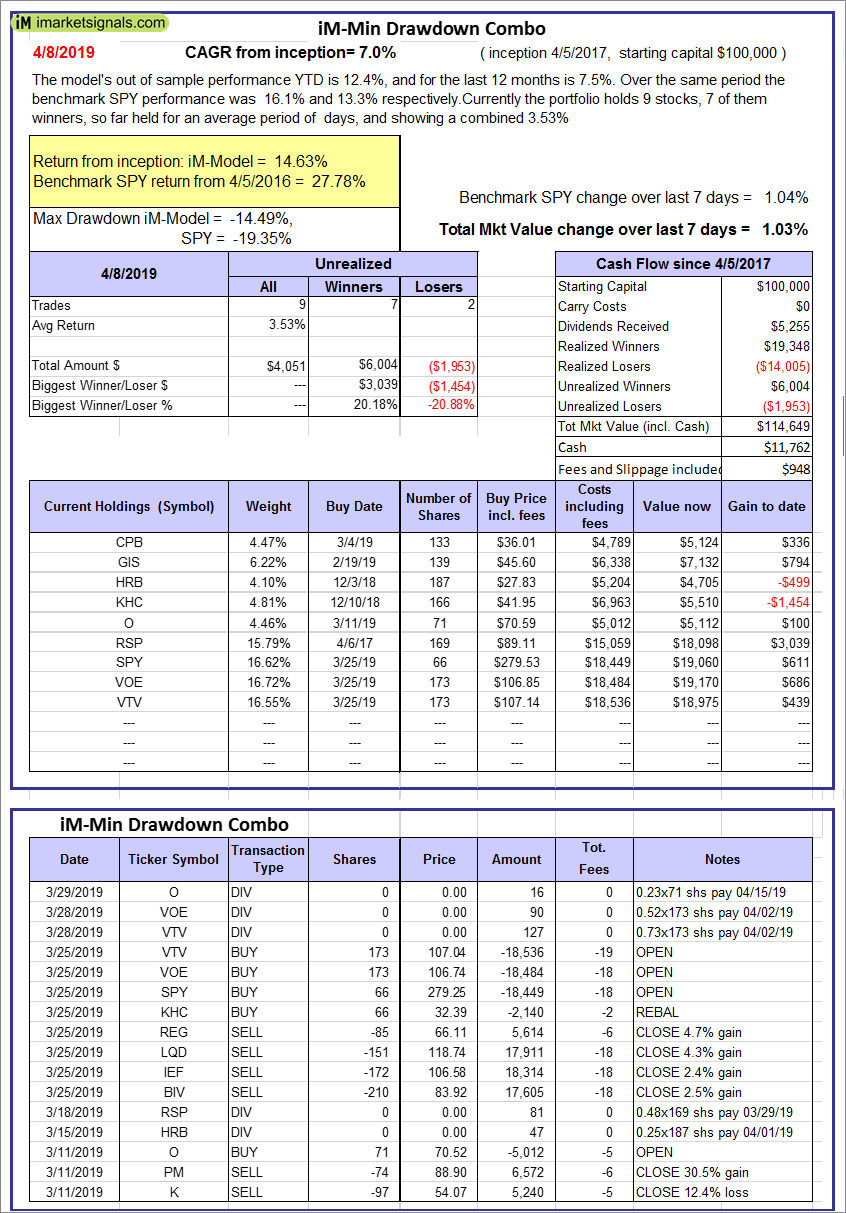
iM-Min Drawdown Combo: The model’s out of sample performance YTD is 12.4%, and for the last 12 months is 7.5%. Over the same period the benchmark SPY performance was 16.1% and 13.3% respectively. Over the previous week the market value of the iM-Min Drawdown Combo gained 1.03% at a time when SPY gained 1.04%. A starting capital of $100,000 at inception on 4/5/2017 would have grown to $114,649 which includes $11,762 cash and excludes $948 spent on fees and slippage. |
|
|
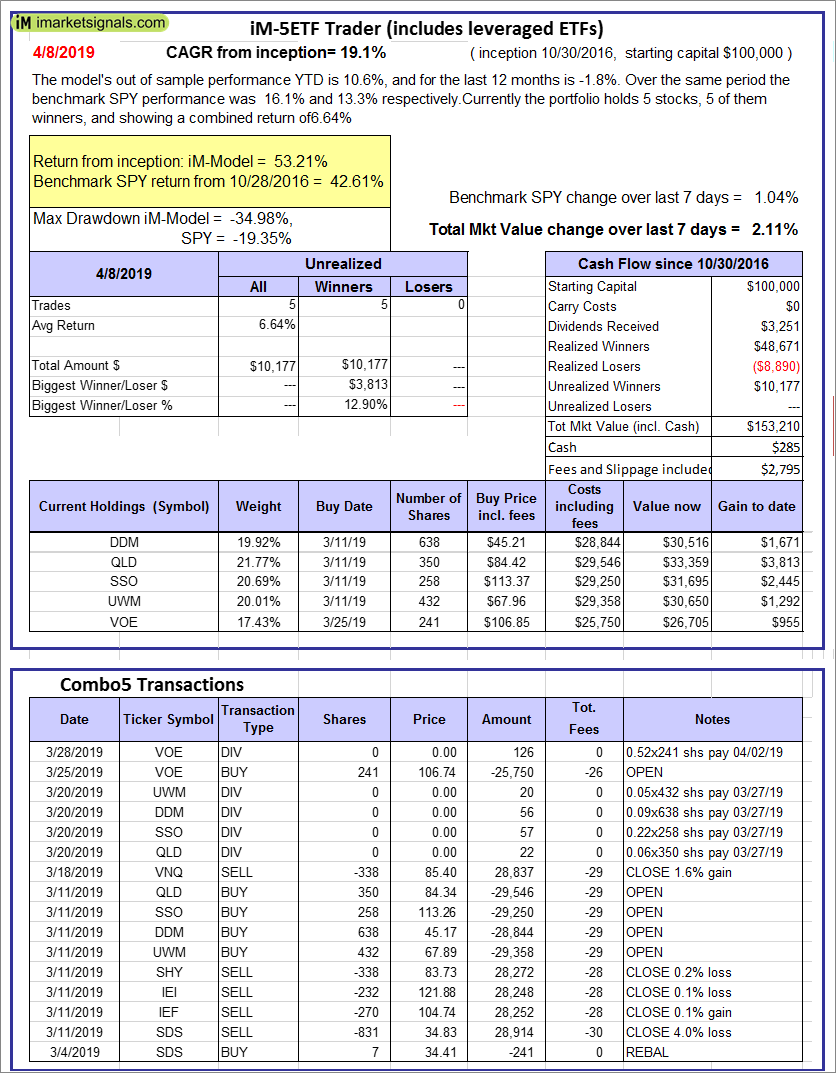
iM-5ETF Trader (includes leveraged ETFs): The model’s out of sample performance YTD is 10.6%, and for the last 12 months is -1.8%. Over the same period the benchmark SPY performance was 16.1% and 13.3% respectively. Over the previous week the market value of the iM-5ETF Trader (includes leveraged ETFs) gained 2.11% at a time when SPY gained 1.04%. A starting capital of $100,000 at inception on 10/30/2016 would have grown to $153,210 which includes $285 cash and excludes $2,795 spent on fees and slippage. |
|
|
iM-Standard 5ETF Trader (excludes leveraged ETFs): The model’s out of sample performance YTD is 7.6%, and for the last 12 months is 2.6%. Over the same period the benchmark SPY performance was 16.1% and 13.3% respectively. Over the previous week the market value of the iM-Standard 5ETF Trader (excludes leveraged ETFs) gained 1.12% at a time when SPY gained 1.04%. A starting capital of $100,000 at inception on 10/30/2016 would have grown to $126,180 which includes -$316 cash and excludes $2,670 spent on fees and slippage. |


Leave a Reply
You must be logged in to post a comment.