
  |
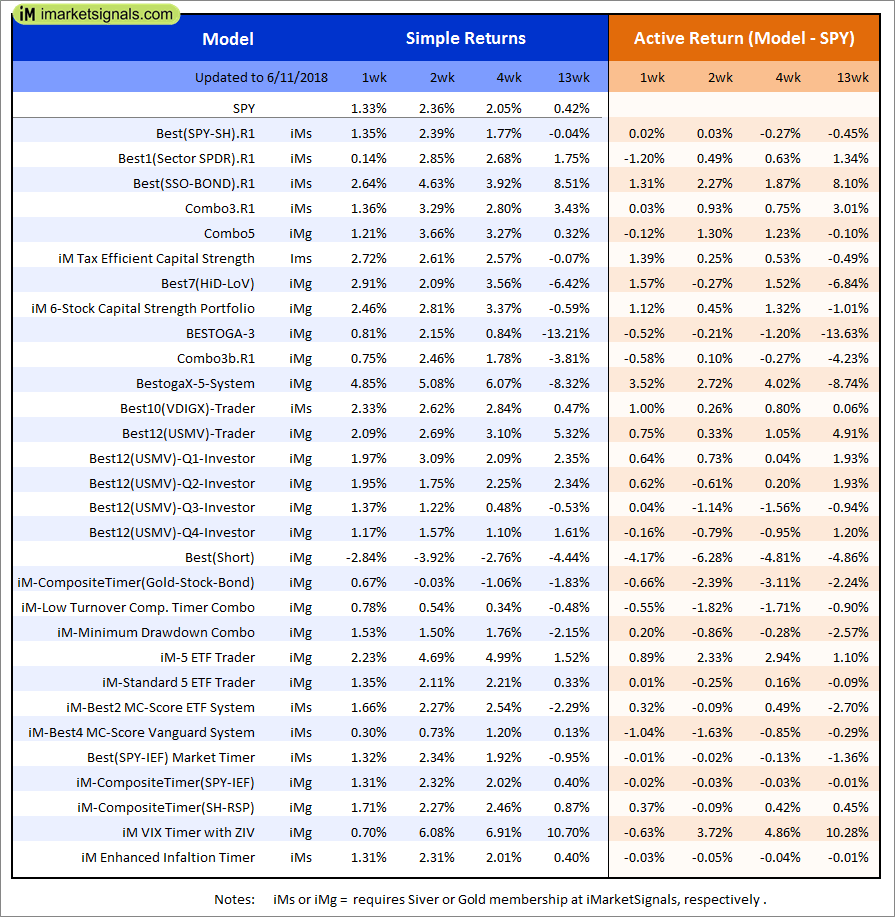
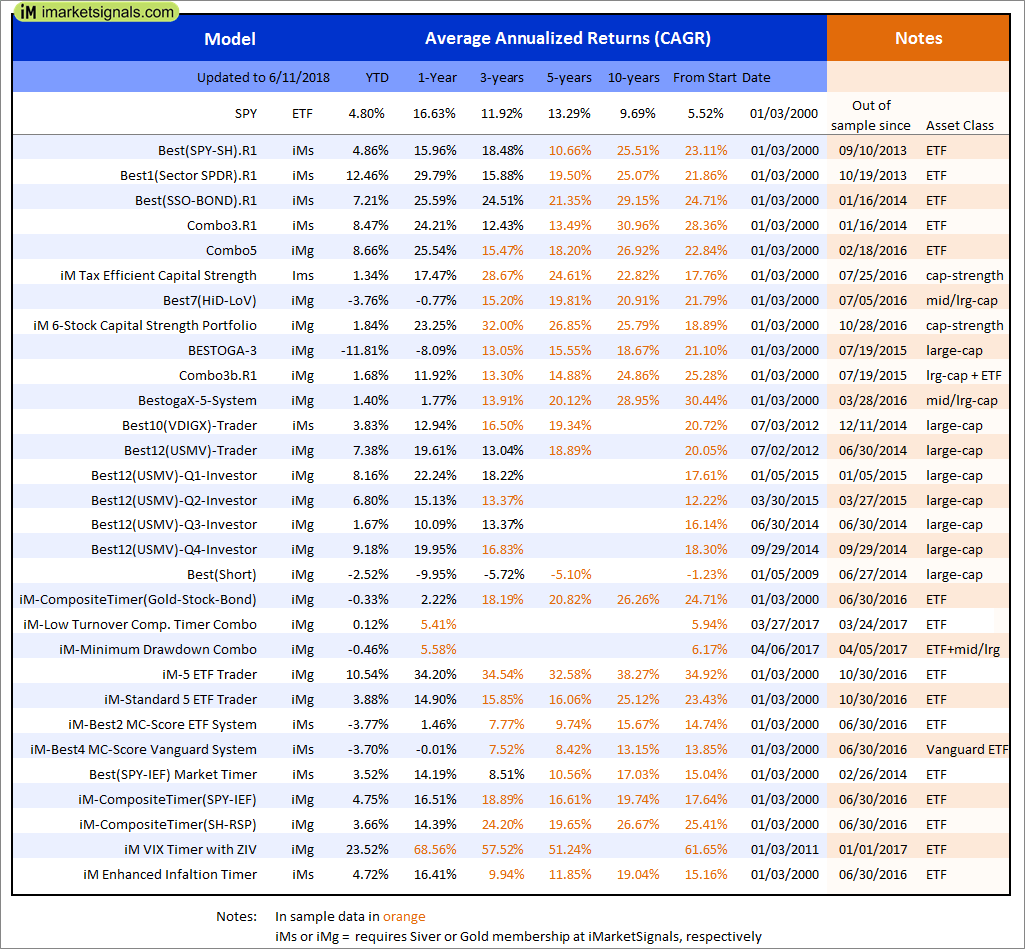
Out of sample performance summary of our models for the past 1, 2, 4 and 13 week periods. The active active return indicates how the models over- or underperformed the benchmark ETF SPY. Also the YTD, and the 1-, 3-, 5- and 10-year annualized returns are shown in the second table |
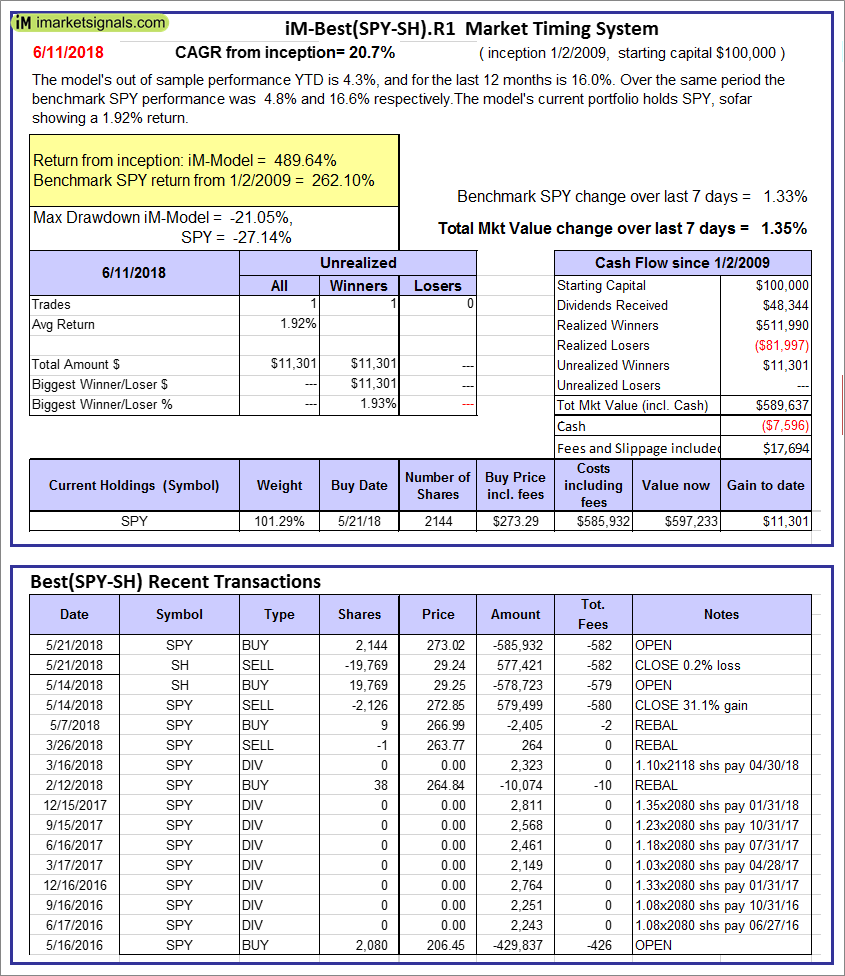 |
iM-Best(SPY-SH).R1: The model’s out of sample performance YTD is 4.3%, and for the last 12 months is 16.0%. Over the same period the benchmark SPY performance was 4.8% and 16.6% respectively. Over the previous week the market value of Best(SPY-SH) gained 1.35% at a time when SPY gained 1.33%. A starting capital of $100,000 at inception on 1/2/2009 would have grown to $589,637 which includes -$7,596 cash and excludes $17,694 spent on fees and slippage. |
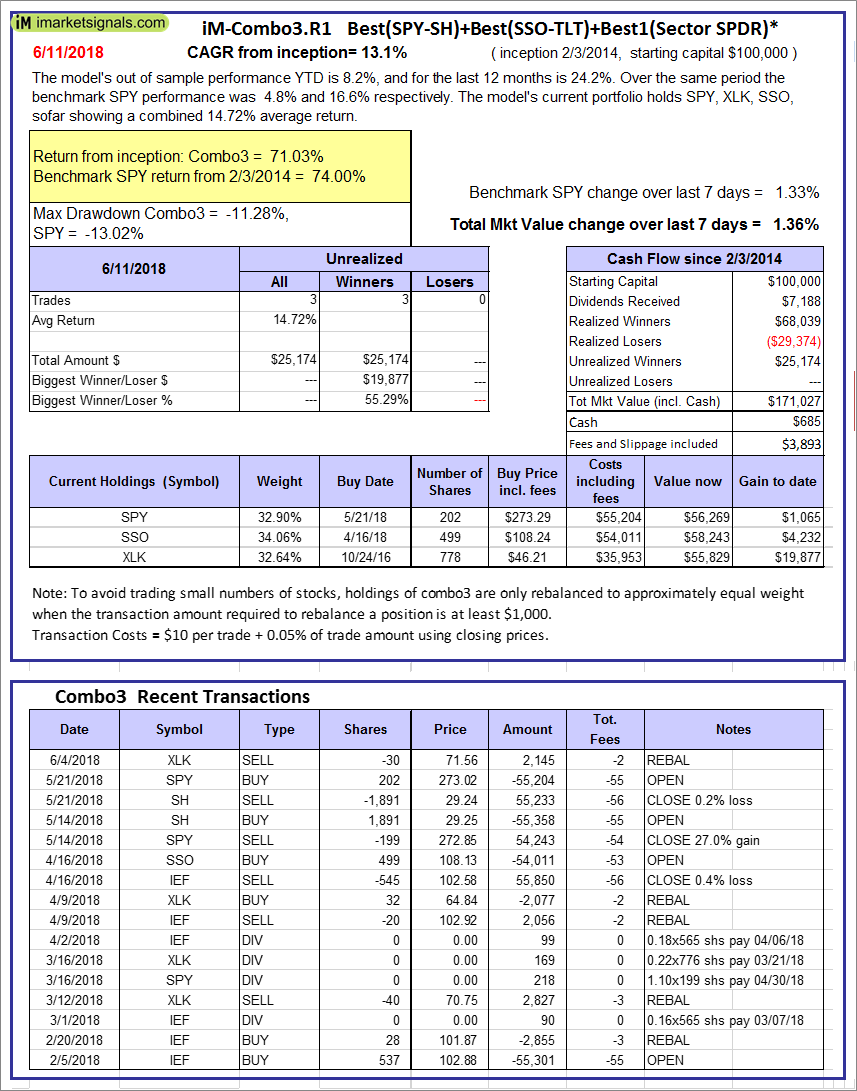 |
iM-Combo3.R1: The model’s out of sample performance YTD is 8.2%, and for the last 12 months is 24.2%. Over the same period the benchmark SPY performance was 4.8% and 16.6% respectively. Over the previous week the market value of iM-Combo3.R1 gained 1.36% at a time when SPY gained 1.33%. A starting capital of $100,000 at inception on 2/3/2014 would have grown to $171,027 which includes $685 cash and excludes $3,893 spent on fees and slippage. |
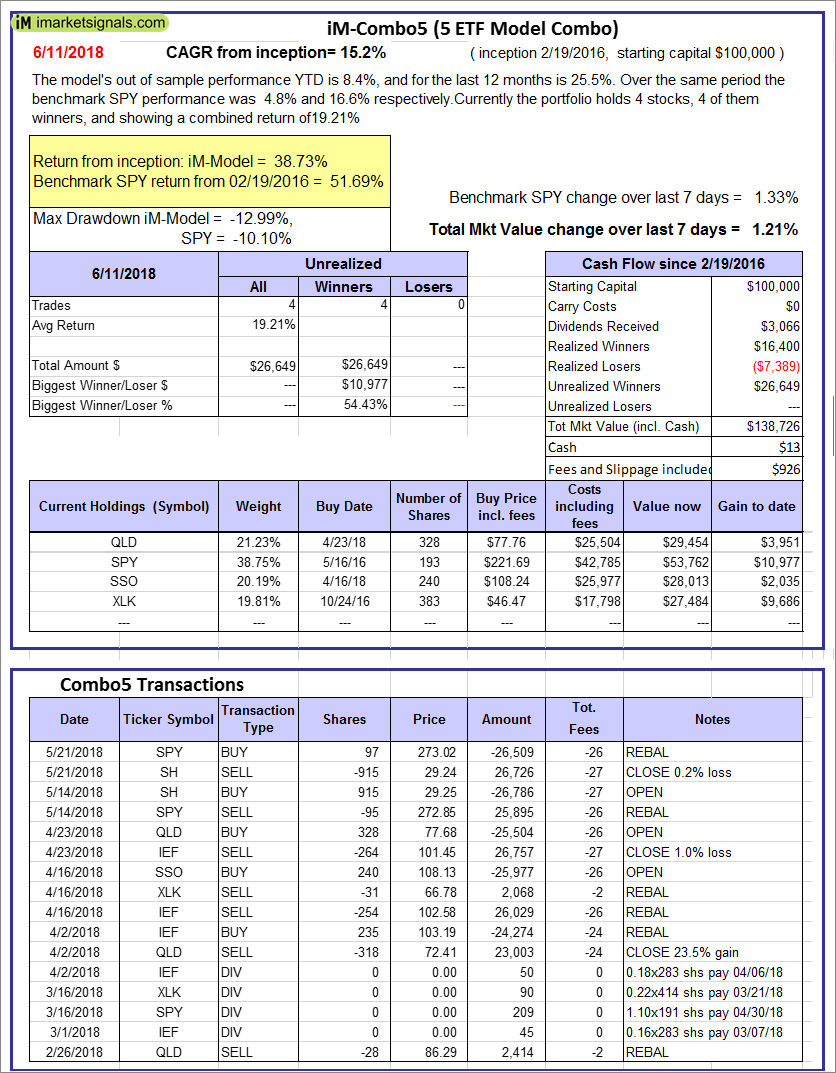 |
iM-Combo5: The model’s out of sample performance YTD is 8.4%, and for the last 12 months is 25.5%. Over the same period the benchmark SPY performance was 4.8% and 16.6% respectively. Over the previous week the market value of iM-Combo5 gained 1.21% at a time when SPY gained 1.33%. A starting capital of $100,000 at inception on 2/22/2016 would have grown to $138,726 which includes $13 cash and excludes $926 spent on fees and slippage. |
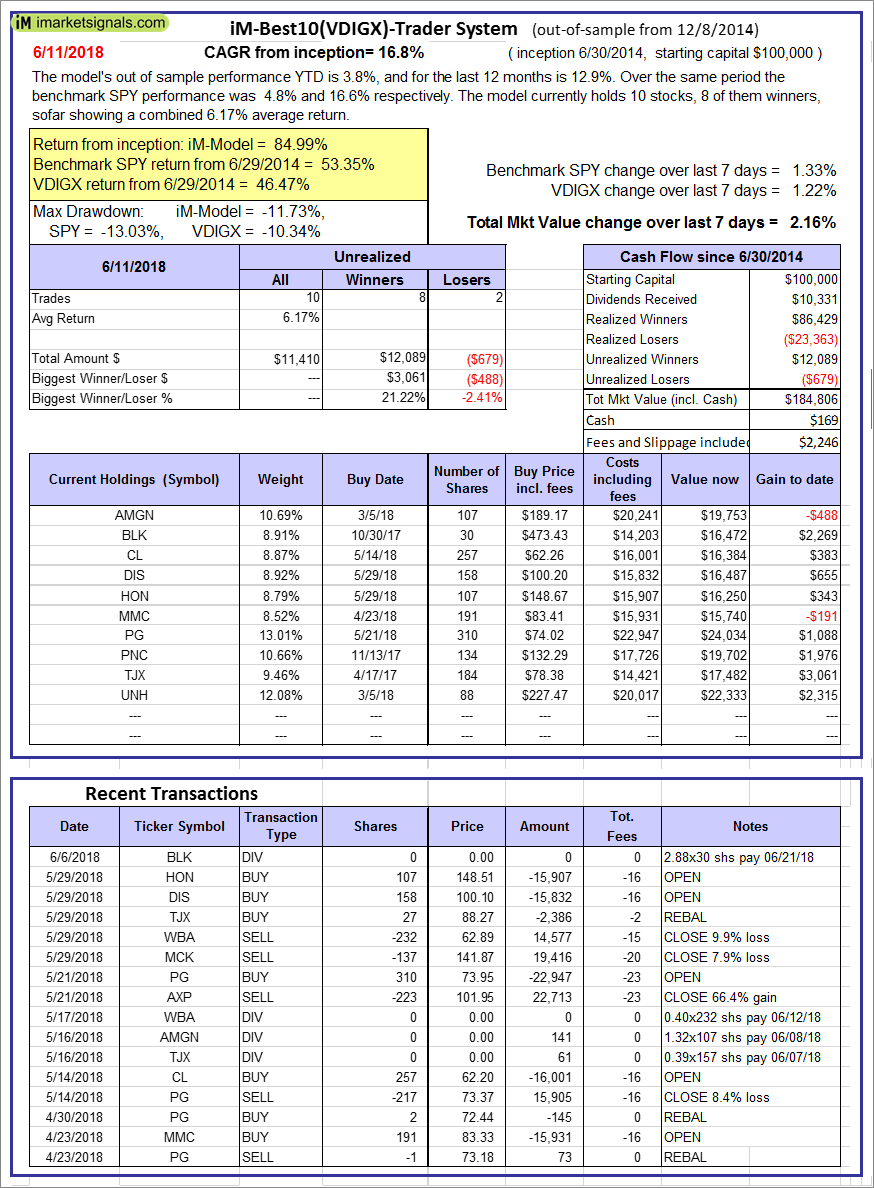 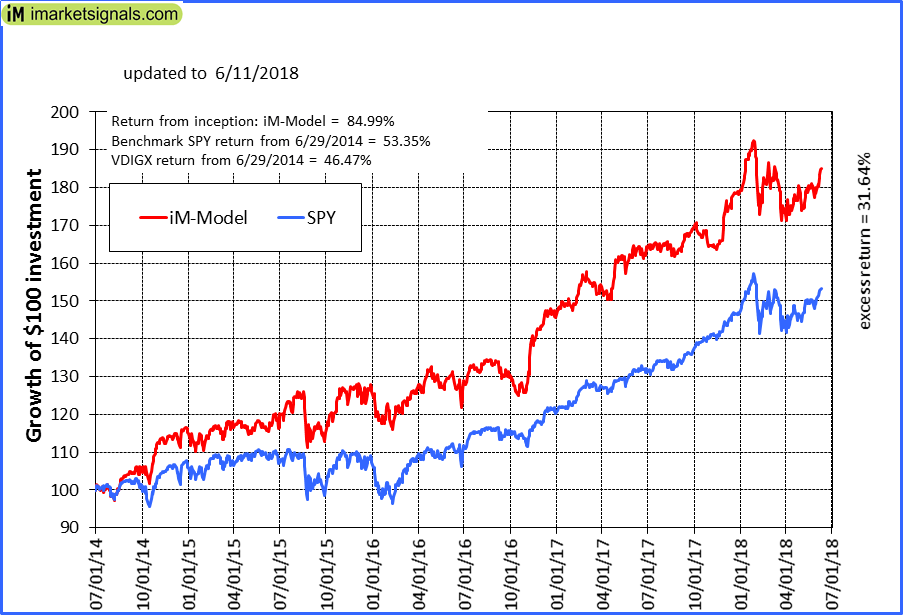 |
iM-Best10(VDIGX)-Trader: The model’s out of sample performance YTD is 3.8%, and for the last 12 months is 12.9%. Over the same period the benchmark SPY performance was 4.8% and 16.6% respectively. Since inception, on 7/1/2014, the model gained 84.99% while the benchmark SPY gained 53.35% and VDIGX gained 46.47% over the same period. Over the previous week the market value of iM-Best10(VDIGX) gained 2.16% at a time when SPY gained 1.33%. A starting capital of $100,000 at inception on 7/1/2014 would have grown to $184,806 which includes $169 cash and excludes $2,246 spent on fees and slippage. |
 |
iM-BESTOGA-3: The model’s out of sample performance YTD is -12.1%, and for the last 12 months is -8.1%. Over the same period the benchmark SPY performance was 4.8% and 16.6% respectively. Over the previous week the market value of iM-BESTOGA-3 gained 0.81% at a time when SPY gained 1.33%. A starting capital of $100,000 at inception on 2/3/2014 would have grown to $203,513 which includes $427 cash and excludes $2,787 spent on fees and slippage. |
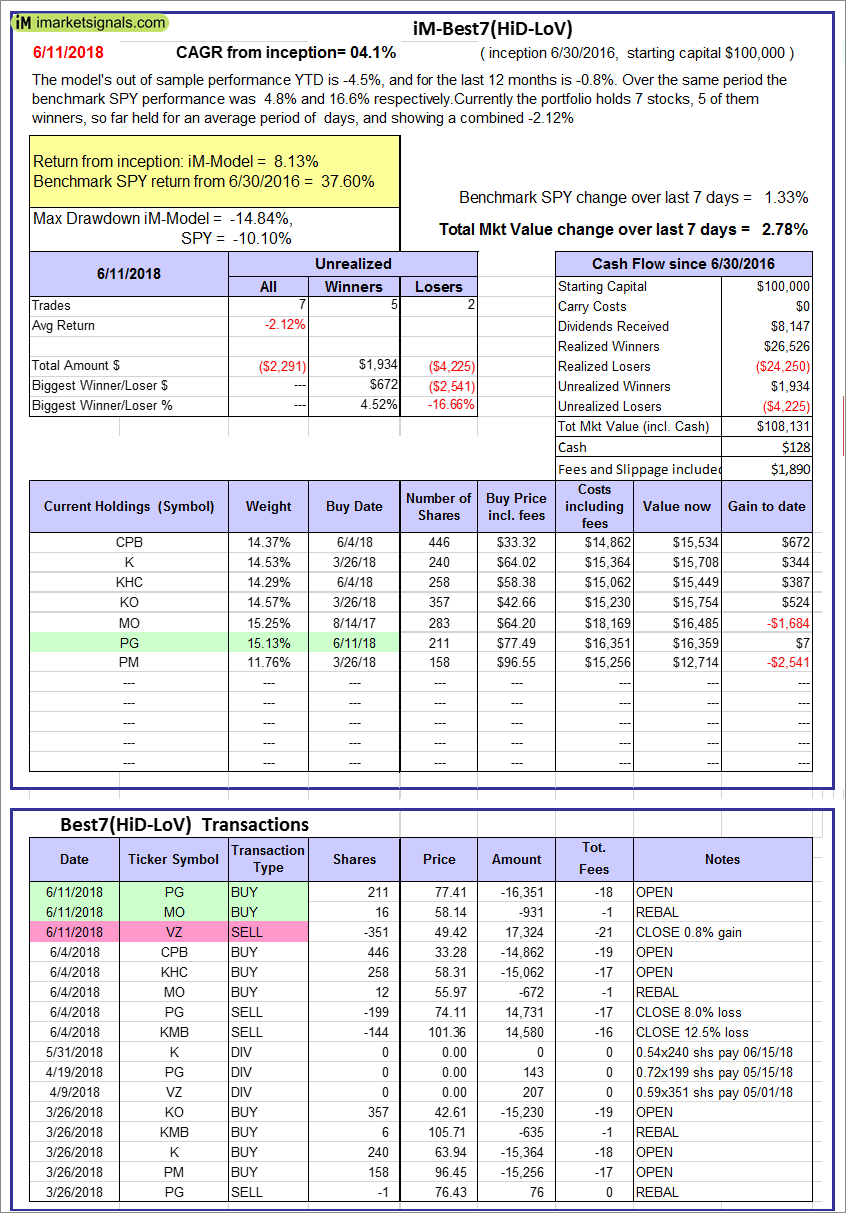 |
iM-Best7(HiD-LoV): The model’s out of sample performance YTD is -7.1%, and for the last 12 months is -3.6%. Over the same period the benchmark SPY performance was 3.4% and 14.7% respectively. Over the previous week the market value of iM-BESTOGA-3 gained -0.25% at a time when SPY gained 2.19%. A starting capital of $100,000 at inception on 6/30/2016 would have grown to $105,203 which includes $86 cash and excludes $1,850 spent on fees and slippage. |
 |
iM 6-Stock Capital Strength Portfolio: The model’s out of sample performance YTD is 1.5%, and for the last 12 months is 23.3%. Over the same period the benchmark SPY performance was 4.8% and 16.6% respectively. Over the previous week the market value of the iM 6-Stock Capital Strength Portfolio gained 2.31% at a time when SPY gained 1.33%. A starting capital of $100,000 at inception on 10/28/2016 would have grown to $153,566 which includes $1,019 cash and excludes $704 spent on fees and slippage. |
 |
iM-BestogaX5-System: The model’s out of sample performance YTD is 0.6%, and for the last 12 months is 1.8%. Over the same period the benchmark SPY performance was 4.8% and 16.6% respectively. Over the previous week the market value of iM-BestogaX5-System gained 4.25% at a time when SPY gained 1.33%. A starting capital of $100,000 at inception on 3/28/2016 would have grown to $112,508 which includes $456 cash and excludes $1,150 spent on fees and slippage. |
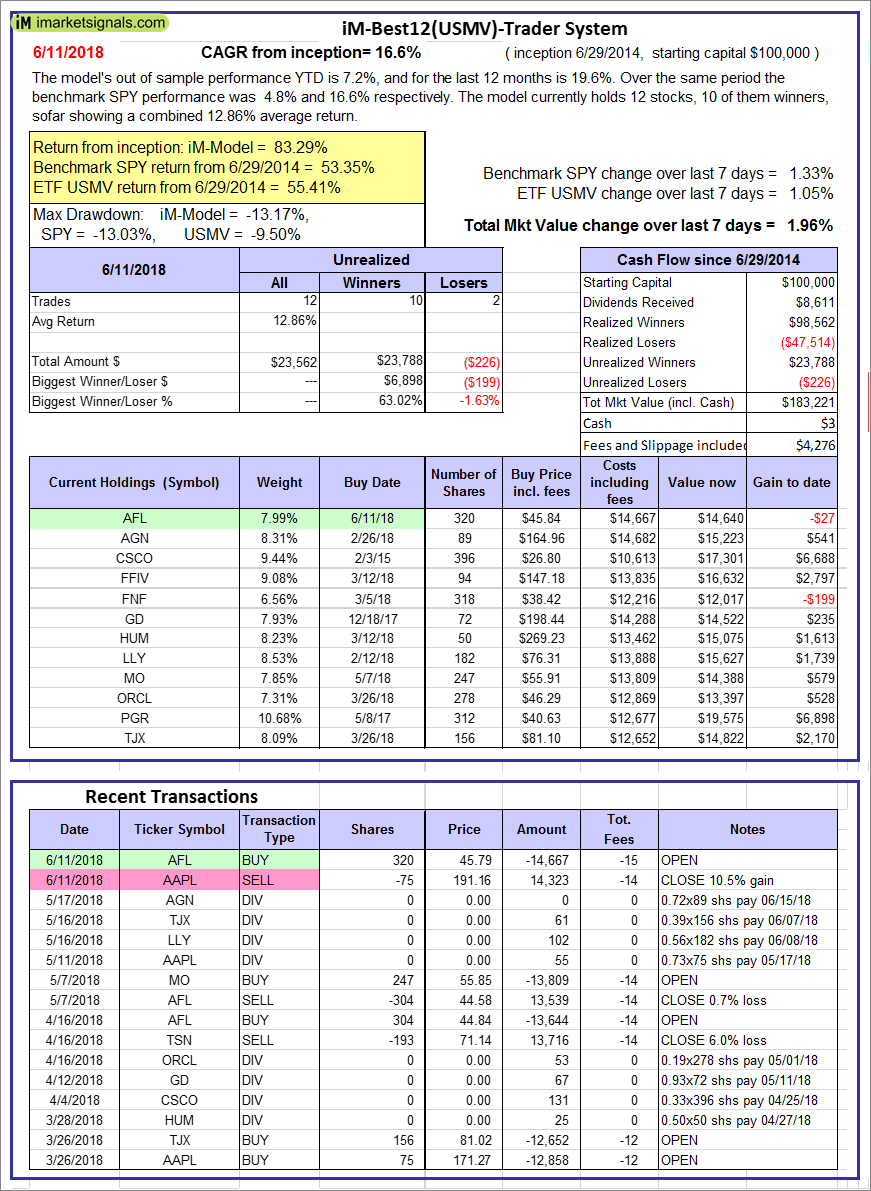 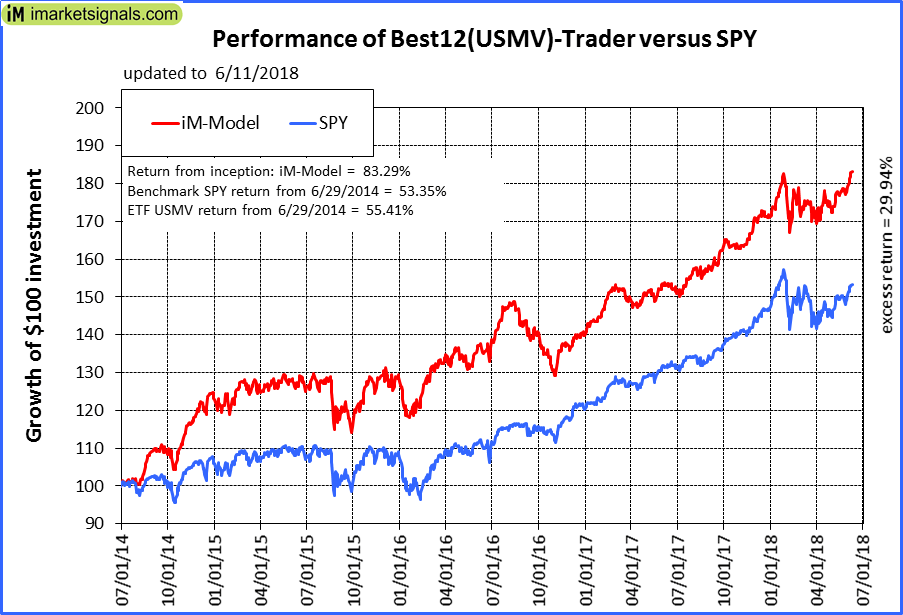 |
iM-Best12(USMV)-Trader: The model’s out of sample performance YTD is 7.2%, and for the last 12 months is 19.6%. Over the same period the benchmark SPY performance was 4.8% and 16.6% respectively. Since inception, on 6/30/2014, the model gained 83.29% while the benchmark SPY gained 53.35% and the ETF USMV gained 55.41% over the same period. Over the previous week the market value of iM-Best12(USMV)-Trader gained 1.96% at a time when SPY gained 1.33%. A starting capital of $100,000 at inception on 6/30/2014 would have grown to $183,221 which includes $3 cash and excludes $4,276 spent on fees and slippage. |
 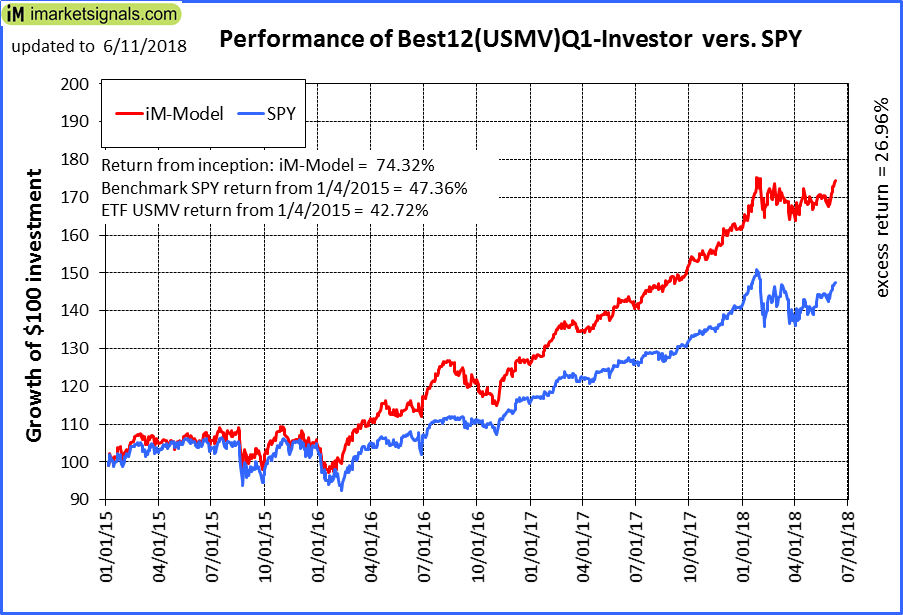 |
iM-Best12(USMV)Q1-Investor: The model’s out of sample performance YTD is 8.0%, and for the last 12 months is 22.2%. Over the same period the benchmark SPY performance was 4.8% and 16.6% respectively. Since inception, on 1/5/2015, the model gained 74.32% while the benchmark SPY gained 47.36% and the ETF USMV gained 42.72% over the same period. Over the previous week the market value of iM-Best12(USMV)Q1 gained 1.98% at a time when SPY gained 1.33%. A starting capital of $100,000 at inception on 1/5/2015 would have grown to $174,215 which includes $107 cash and excludes $1,170 spent on fees and slippage. |
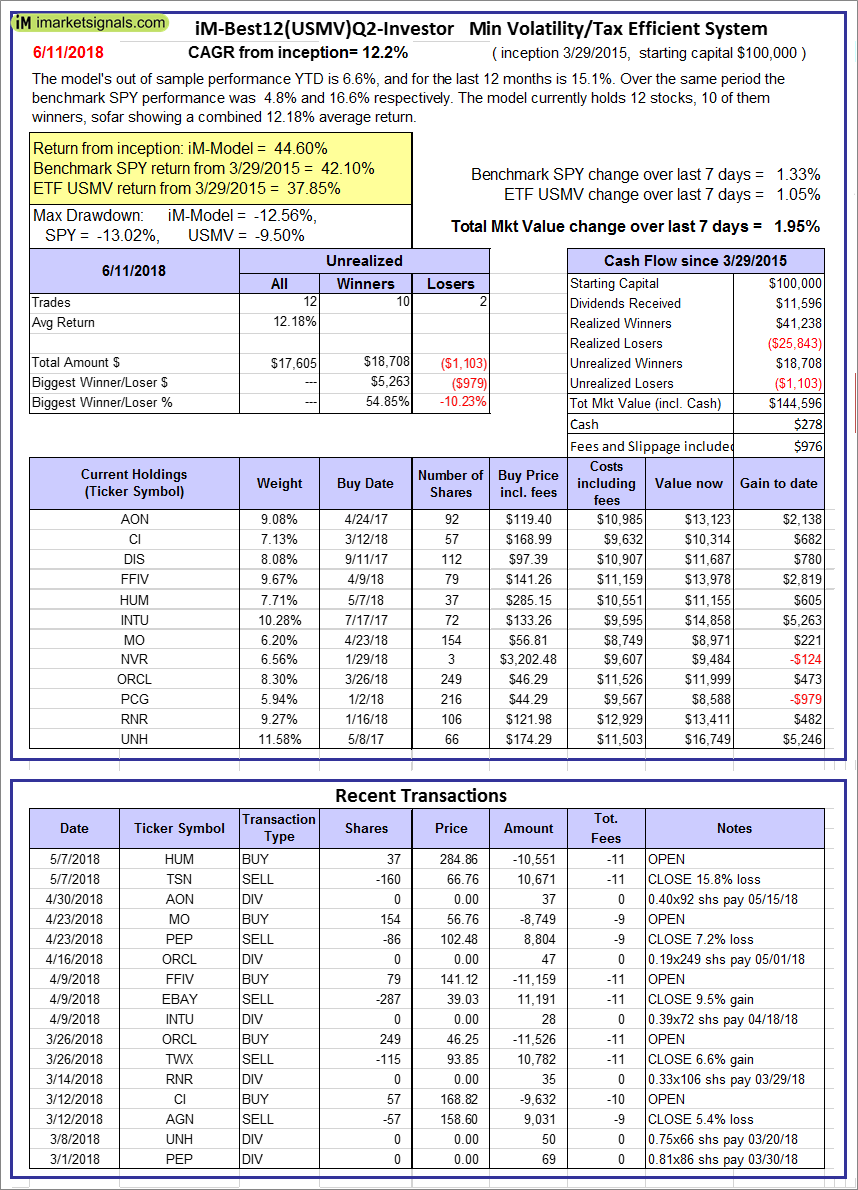 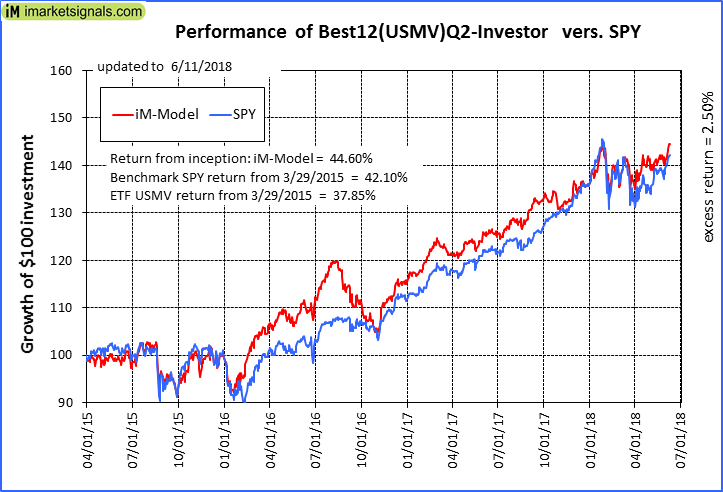 |
iM-Best12(USMV)Q2-Investor: The model’s out of sample performance YTD is 6.6%, and for the last 12 months is 15.1%. Over the same period the benchmark SPY performance was 4.8% and 16.6% respectively. Since inception, on 3/30/2015, the model gained 44.60% while the benchmark SPY gained 42.10% and the ETF USMV gained 37.85% over the same period. Over the previous week the market value of iM-Best12(USMV)Q2 gained 1.95% at a time when SPY gained 1.33%. A starting capital of $100,000 at inception on 3/30/2015 would have grown to $144,596 which includes $278 cash and excludes $976 spent on fees and slippage. |
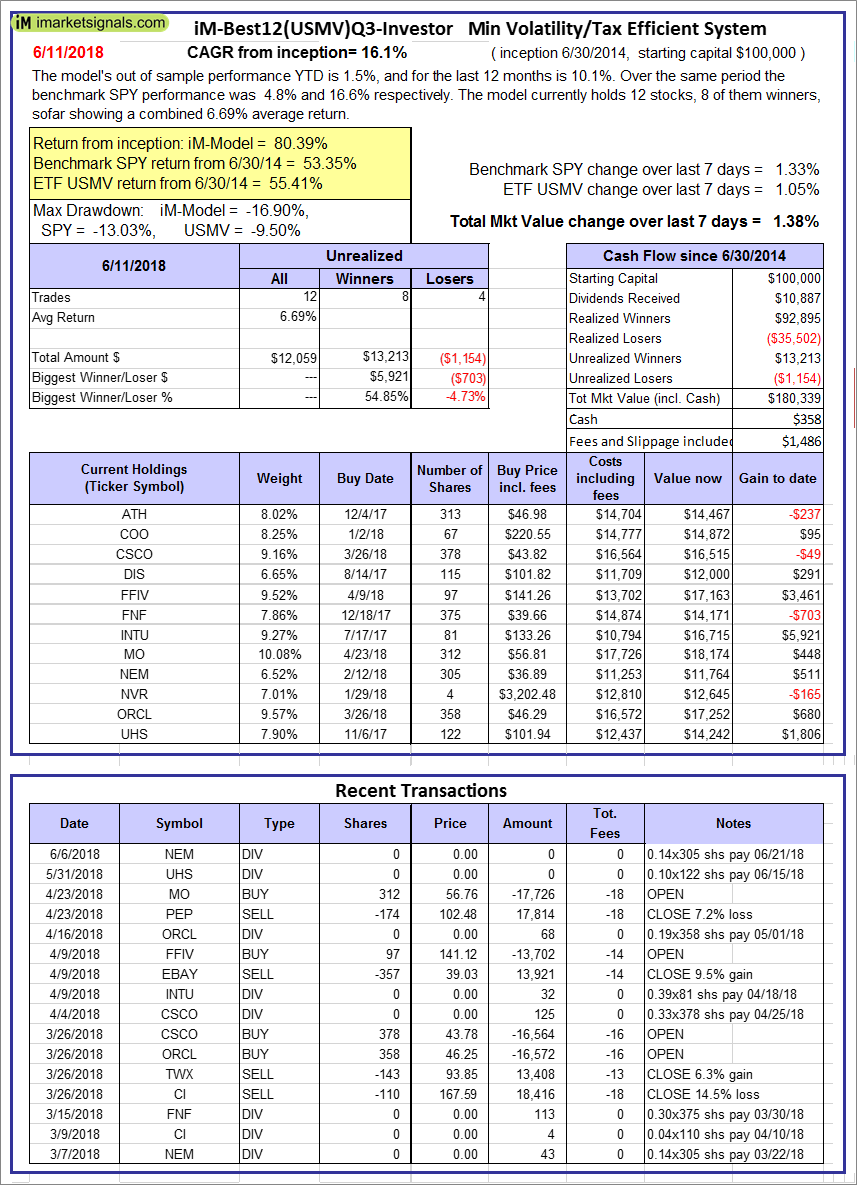 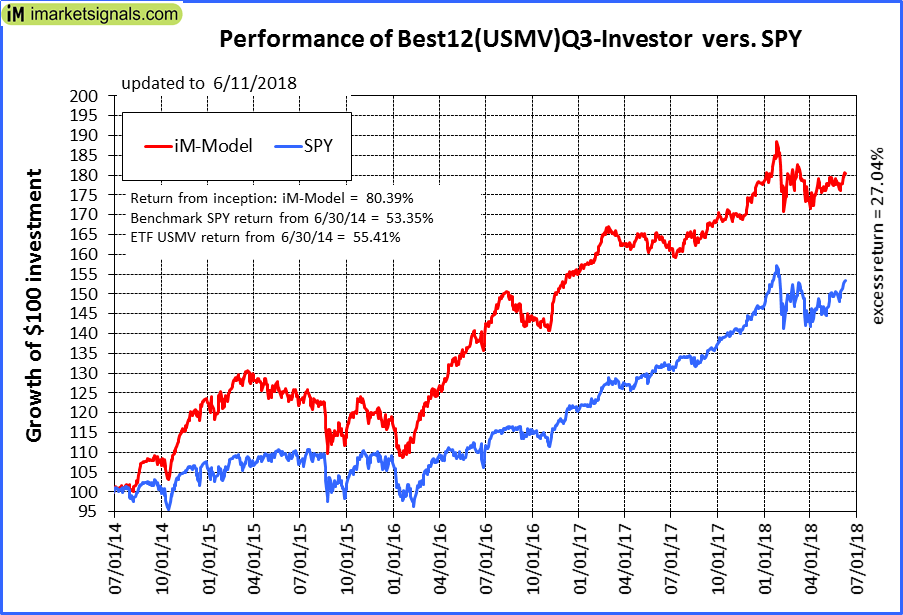 |
iM-Best12(USMV)Q3-Investor: The model’s out of sample performance YTD is 1.5%, and for the last 12 months is 10.1%. Over the same period the benchmark SPY performance was 4.8% and 16.6% respectively. Since inception, on 7/1/2014, the model gained 80.39% while the benchmark SPY gained 53.35% and the ETF USMV gained 55.41% over the same period. Over the previous week the market value of iM-Best12(USMV)Q3 gained 1.38% at a time when SPY gained 1.33%. A starting capital of $100,000 at inception on 7/1/2014 would have grown to $180,339 which includes $358 cash and excludes $1,486 spent on fees and slippage. |
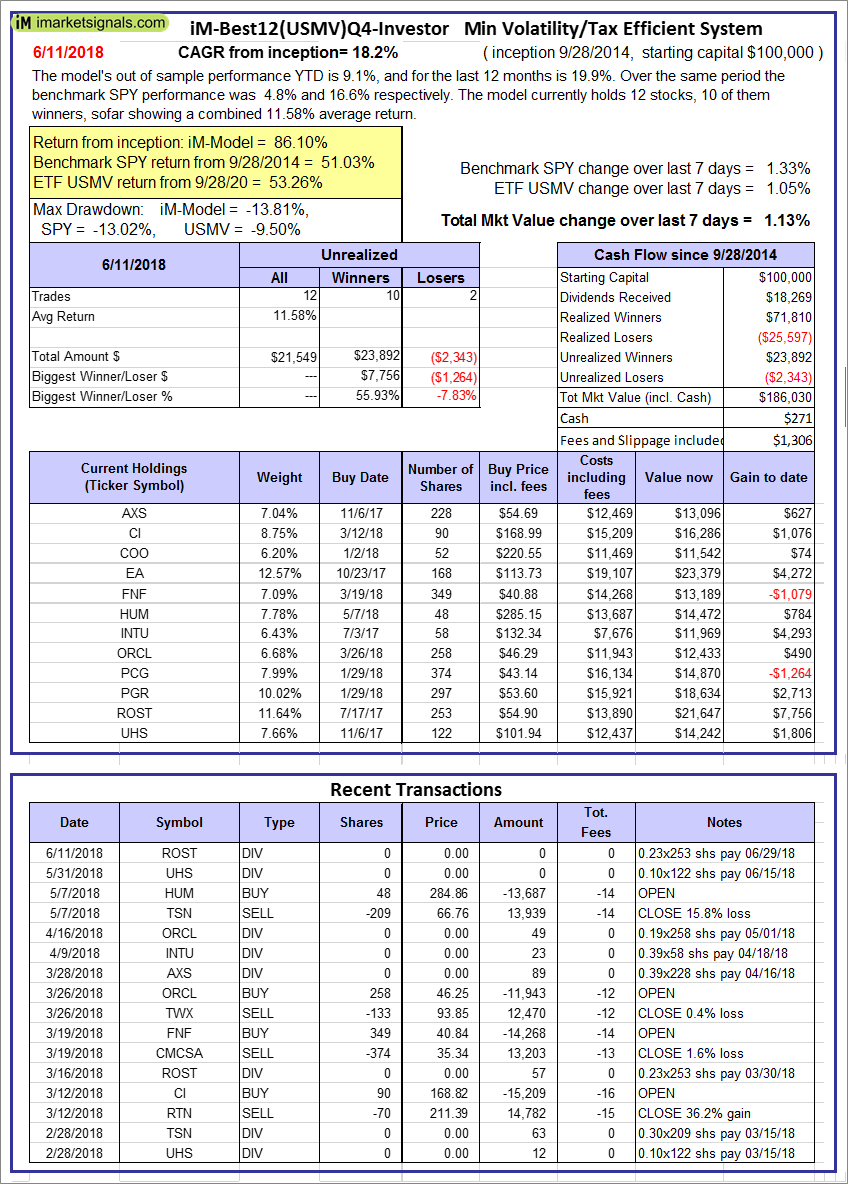 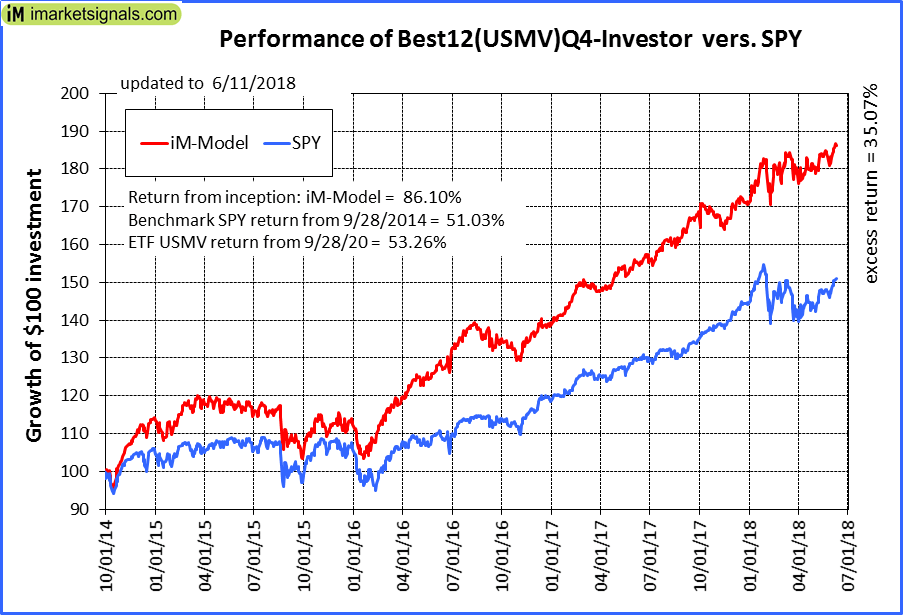 |
iM-Best12(USMV)Q4-Investor: Since inception, on 9/29/2014, the model gained 86.10% while the benchmark SPY gained 51.03% and the ETF USMV gained 53.26% over the same period. Over the previous week the market value of iM-Best12(USMV)Q4 gained 1.13% at a time when SPY gained 1.33%. A starting capital of $100,000 at inception on 9/29/2014 would have grown to $186,030 which includes $271 cash and excludes $1,306 spent on fees and slippage. |
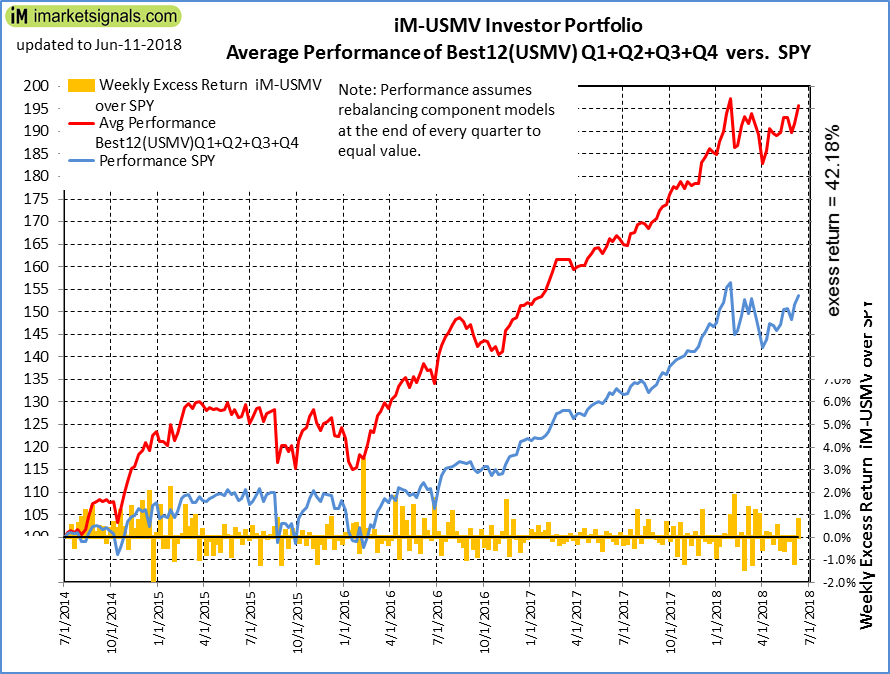 |
Average Performance of iM-Best12(USMV)Q1+Q2+Q3+Q4-Investor resulted in an excess return of 42.18% over SPY. (see iM-USMV Investor Portfolio) |
 |
iM-Best(Short): The model’s out of sample performance YTD is -2.5%, and for the last 12 months is -10.2%. Over the same period the benchmark SPY performance was 4.8% and 16.6% respectively. Over the previous week the market value of iM-Best(Short) gained -2.84% at a time when SPY gained 1.33%. Over the period 1/2/2009 to 6/11/2018 the starting capital of $100,000 would have grown to $88,930 which includes $107,046 cash and excludes $24,342 spent on fees and slippage. |
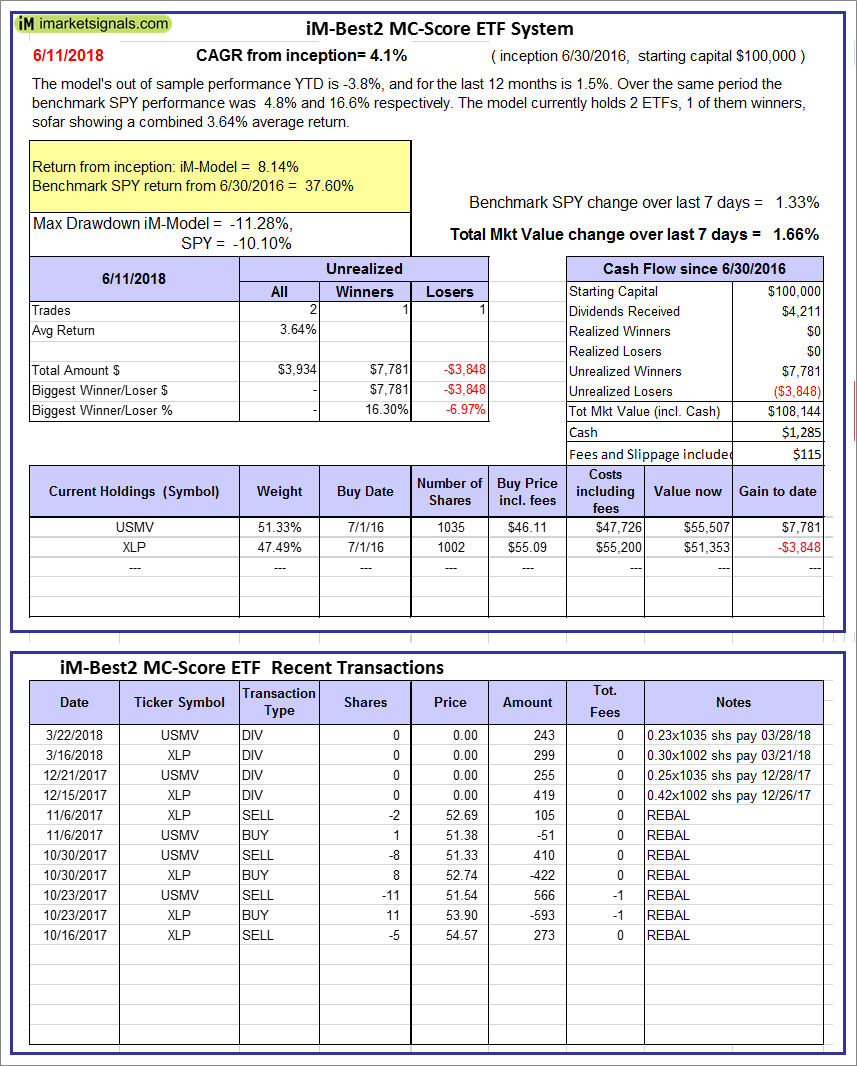 |
iM-Best2 MC-Score ETF System: The model’s out of sample performance YTD is -3.8%, and for the last 12 months is 1.5%. Over the same period the benchmark SPY performance was 4.8% and 16.6% respectively. Over the previous week the market value of the iM-Best2 MC-Score ETF System gained 1.66% at a time when SPY gained 1.33%. A starting capital of $100,000 at inception on 6/30/2016 would have grown to $108,144 which includes $1,285 cash and excludes $115 spent on fees and slippage. |
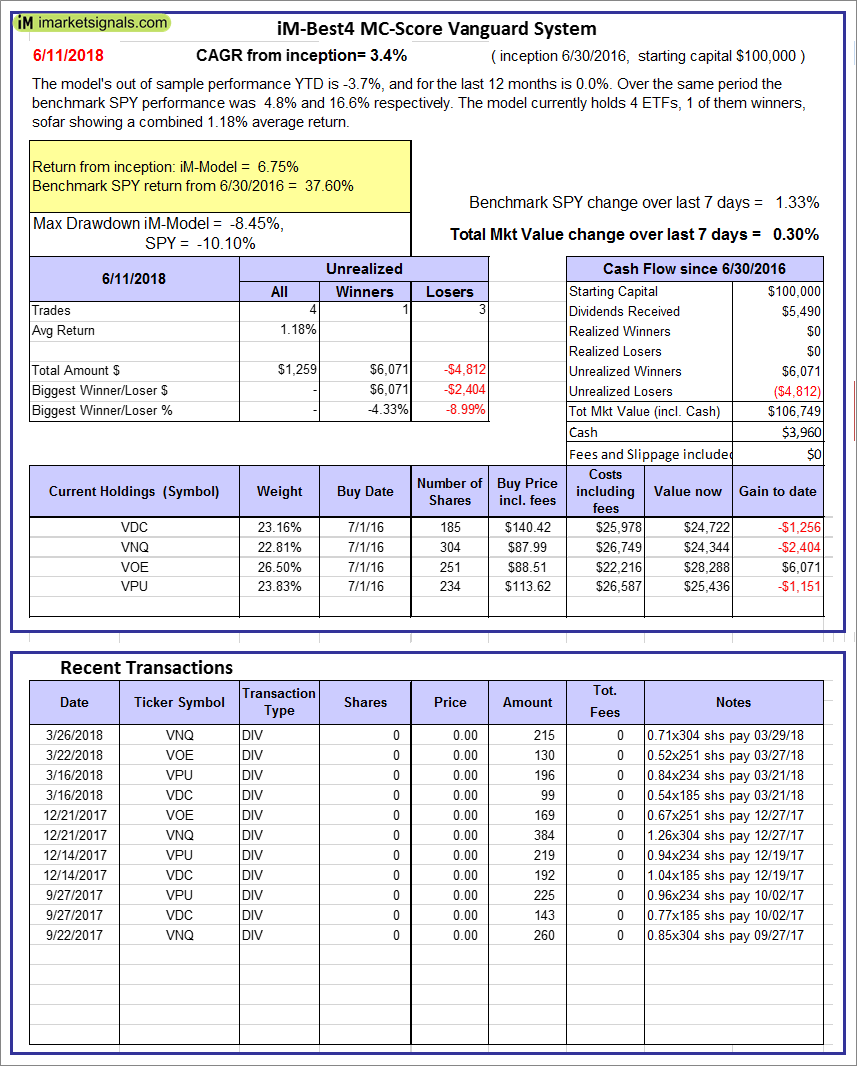 |
iM-Best4 MC-Score Vanguard System: The model’s out of sample performance YTD is -3.7%, and for the last 12 months is 0.0%. Over the same period the benchmark SPY performance was 4.8% and 16.6% respectively. Over the previous week the market value of the iM-Best4 MC-Score Vanguard System gained 0.30% at a time when SPY gained 1.33%. A starting capital of $100,000 at inception on 6/30/2016 would have grown to $106,749 which includes $3,960 cash and excludes $00 spent on fees and slippage. |
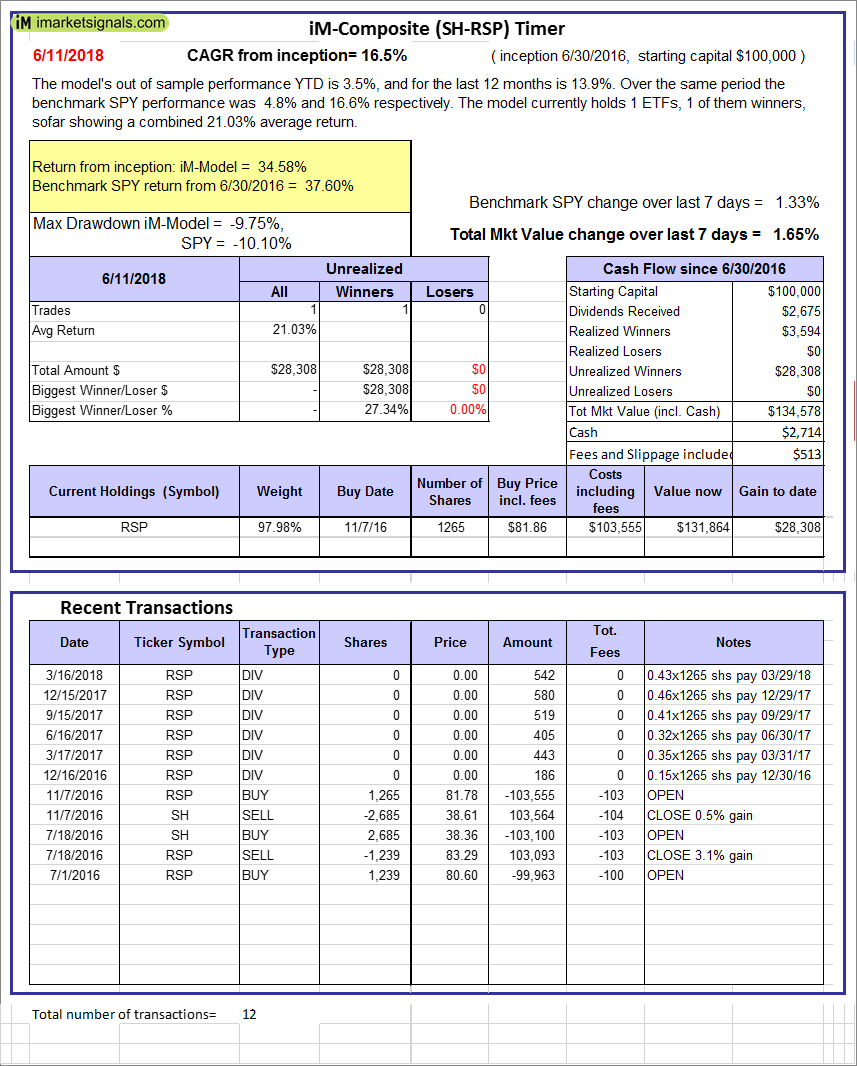 |
iM-Composite (SH-RSP) Timer: The model’s out of sample performance YTD is 3.5%, and for the last 12 months is 13.9%. Over the same period the benchmark SPY performance was 4.8% and 16.6% respectively. Over the previous week the market value of the iM-Composite (SH-RSP) Timer gained 1.65% at a time when SPY gained 1.33%. A starting capital of $100,000 at inception on 6/30/2016 would have grown to $134,578 which includes $2,714 cash and excludes $513 spent on fees and slippage. |
 |
iM-Composite (SPY-IEF) Timer: The model’s out of sample performance YTD is 4.7%, and for the last 12 months is 16.5%. Over the same period the benchmark SPY performance was 4.8% and 16.6% respectively. Over the previous week the market value of the iM-Composite (SPY-IEF) Timer gained 1.31% at a time when SPY gained 1.33%. A starting capital of $100,000 at inception on 6/30/2016 would have grown to $139,651 which includes $2,042 cash and excludes $1,390 spent on fees and slippage. |
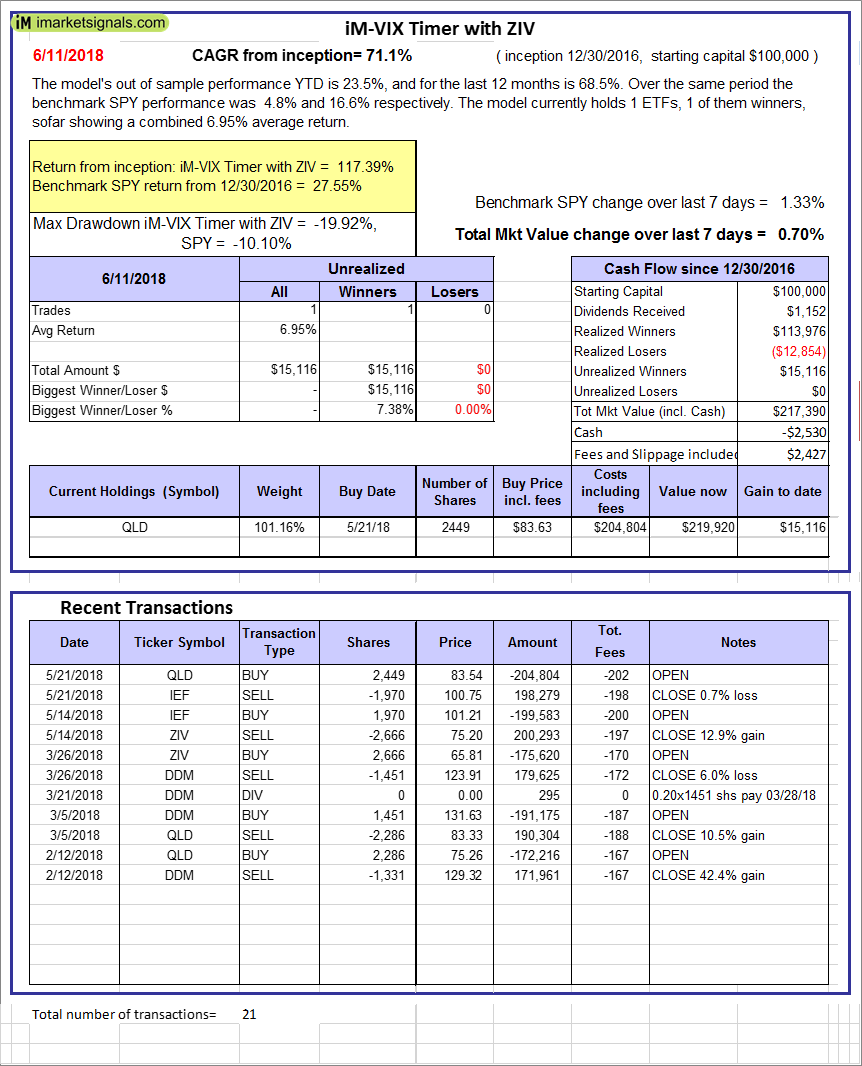 |
iM-VIX Timer with ZIV: The model’s out of sample performance YTD is 23.5%, and for the last 12 months is 68.5%. Over the same period the benchmark SPY performance was 4.8% and 16.6% respectively. Over the previous week the market value of the iM-VIX Timer with ZIV gained 0.70% at a time when SPY gained 1.33%. A starting capital of $100,000 at inception on 6/30/2016 would have grown to $217,390 which includes -$2,530 cash and excludes $2,427 spent on fees and slippage. |
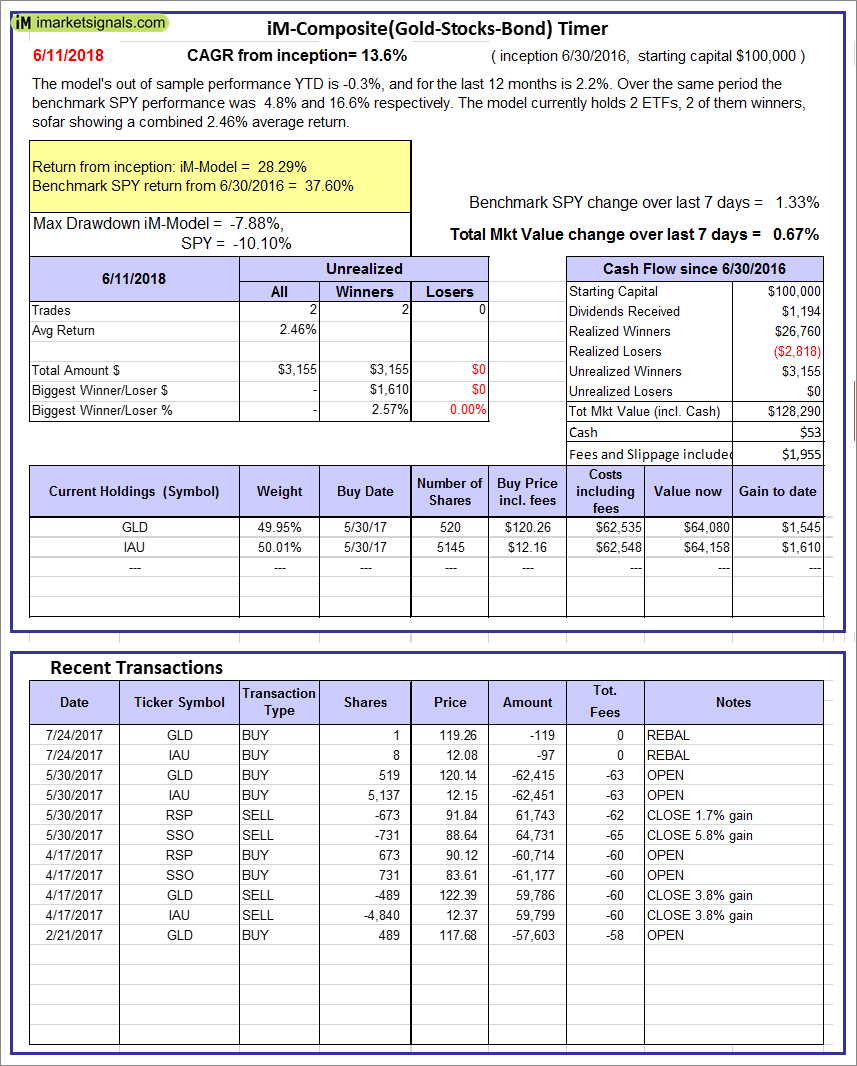 |
iM-Composite(Gold-Stocks-Bond) Timer: The model’s out of sample performance YTD is -0.3%, and for the last 12 months is 2.2%. Over the same period the benchmark SPY performance was 4.8% and 16.6% respectively. Over the previous week the market value of the iM-Composite(Gold-Stocks-Bond) Timer gained 0.67% at a time when SPY gained 1.33%. A starting capital of $100,000 at inception on 6/30/2016 would have grown to $128,290 which includes $53 cash and excludes $1,955 spent on fees and slippage. |
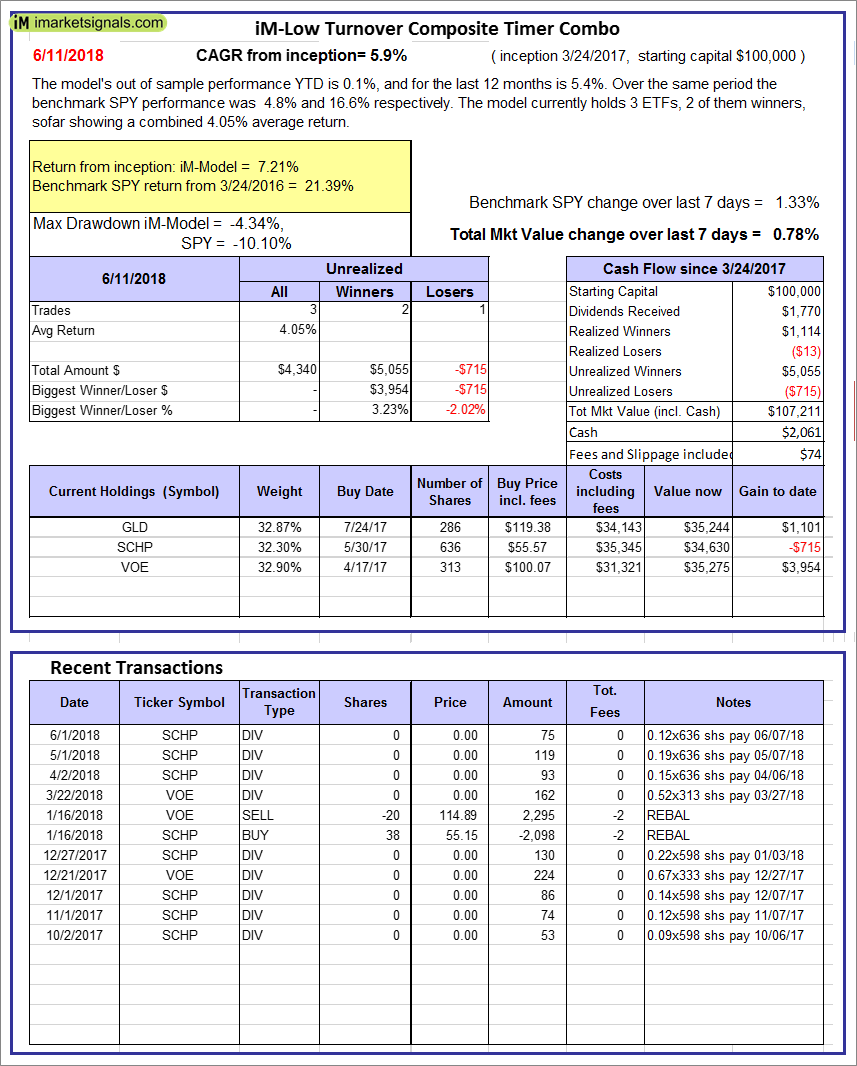 |
iM-Low Turnover Composite Timer Combo: The model’s out of sample performance YTD is 0.1%, and for the last 12 months is 5.4%. Over the same period the benchmark SPY performance was 4.8% and 16.6% respectively. Over the previous week the market value of the iM-Low Turnover Composite Timer Combo gained 0.78% at a time when SPY gained 1.33%. A starting capital of $100,000 at inception on 3/24/27 would have grown to $107,211 which includes $2,061 cash and excludes $74 spent on fees and slippage. |
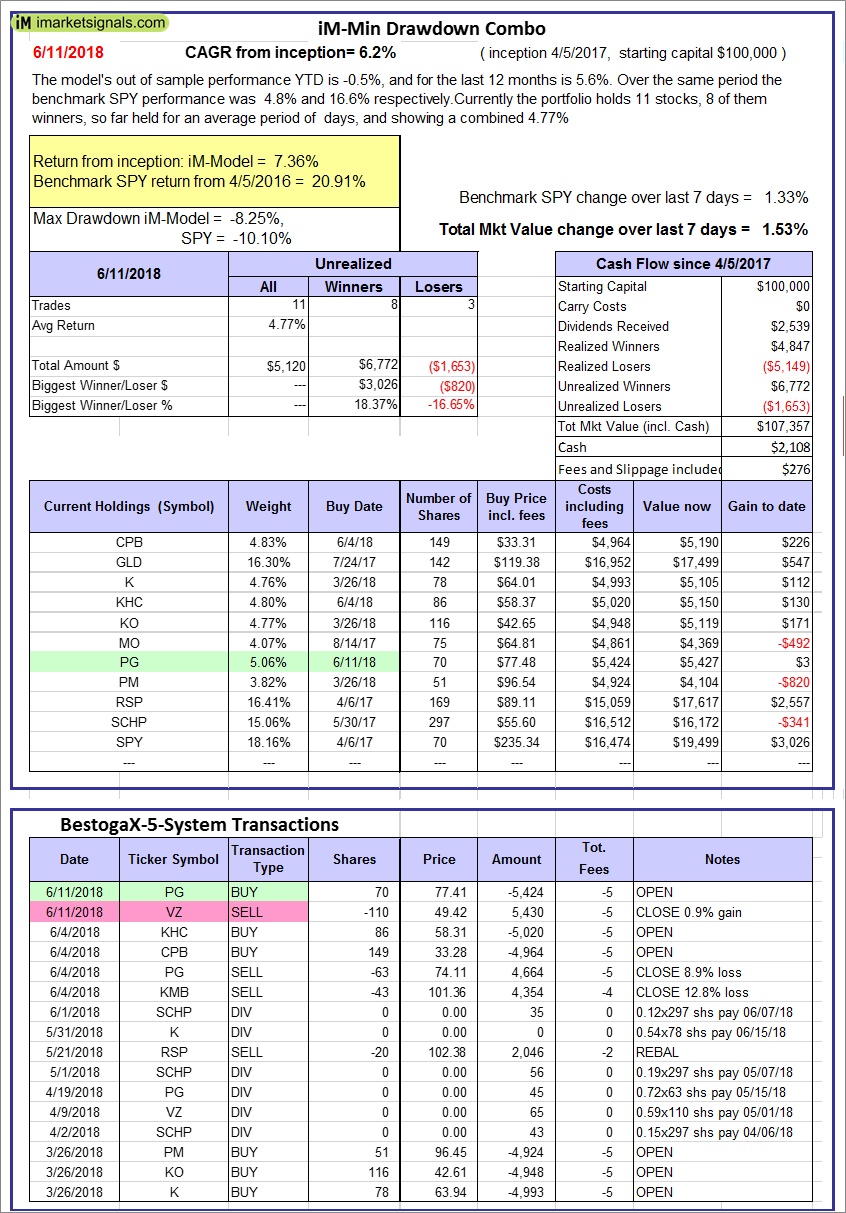 |
iM-Min Drawdown Combo: The model’s out of sample performance YTD is -0.5%, and for the last 12 months is 5.6%. Over the same period the benchmark SPY performance was 4.8% and 16.6% respectively. Over the previous week the market value of the iM-Min Drawdown Combo gained 1.53% at a time when SPY gained 1.33%. A starting capital of $100,000 at inception on 4/5/2017 would have grown to $107,357 which includes $2,108 cash and excludes $276 spent on fees and slippage. |
 |
iM-5ETF Trader (includes leveraged ETFs): The model’s out of sample performance YTD is 10.5%, and for the last 12 months is 34.1%. Over the same period the benchmark SPY performance was 4.8% and 16.6% respectively. Over the previous week the market value of the iM-5ETF Trader (includes leveraged ETFs) gained 2.22% at a time when SPY gained 1.33%. A starting capital of $100,000 at inception on 10/30/2016 would have grown to $179,904 which includes $1,298 cash and excludes $1,030 spent on fees and slippage. |
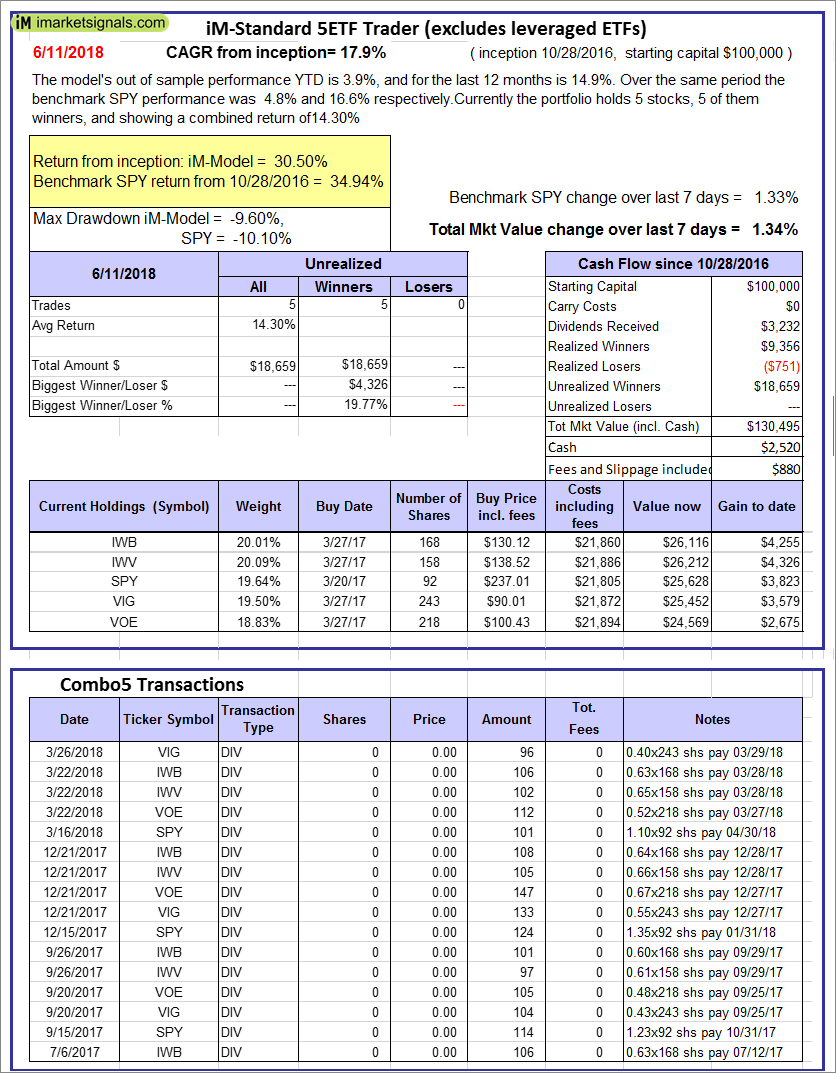 |
iM-Standard 5ETF Trader (excludes leveraged ETFs): The model’s out of sample performance YTD is 3.9%, and for the last 12 months is 14.9%. Over the same period the benchmark SPY performance was 4.8% and 16.6% respectively. Over the previous week the market value of the iM-Standard 5ETF Trader (excludes leveraged ETFs) gained 1.34% at a time when SPY gained 1.33%. A starting capital of $100,000 at inception on 10/30/2016 would have grown to $130,495 which includes $2,520 cash and excludes $880 spent on fees and slippage. |
iM-Best Reports – 6/11/2018
Posted in pmp SPY-SH
Leave a Reply
You must be logged in to post a comment.