
  |
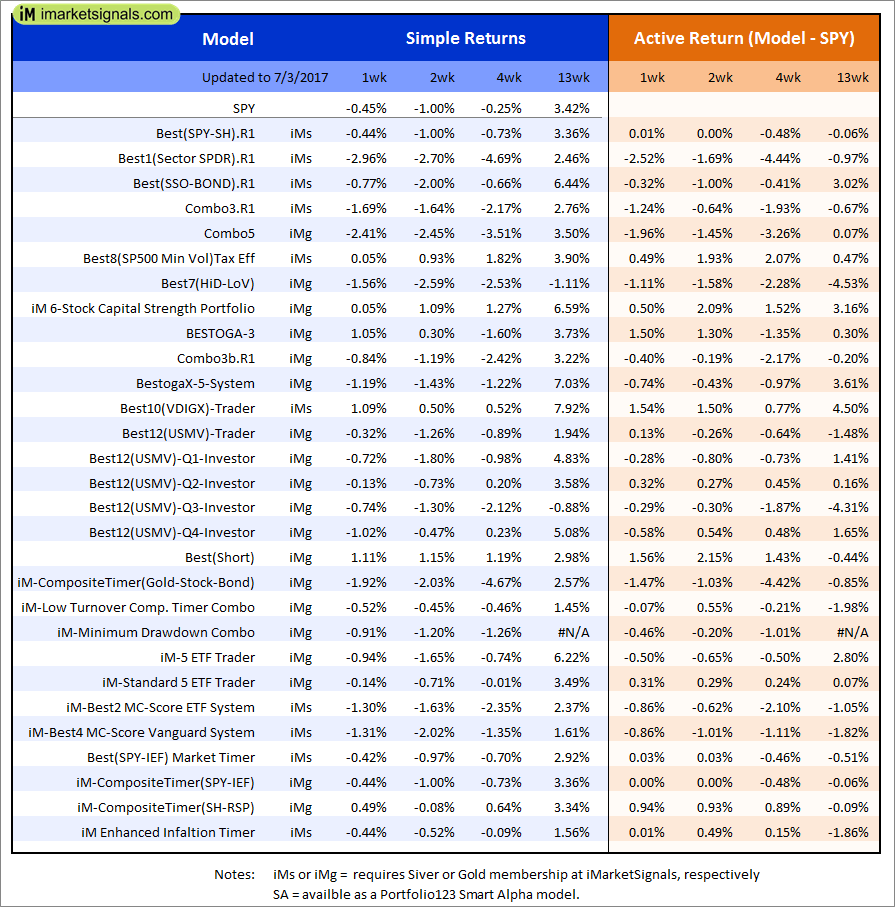
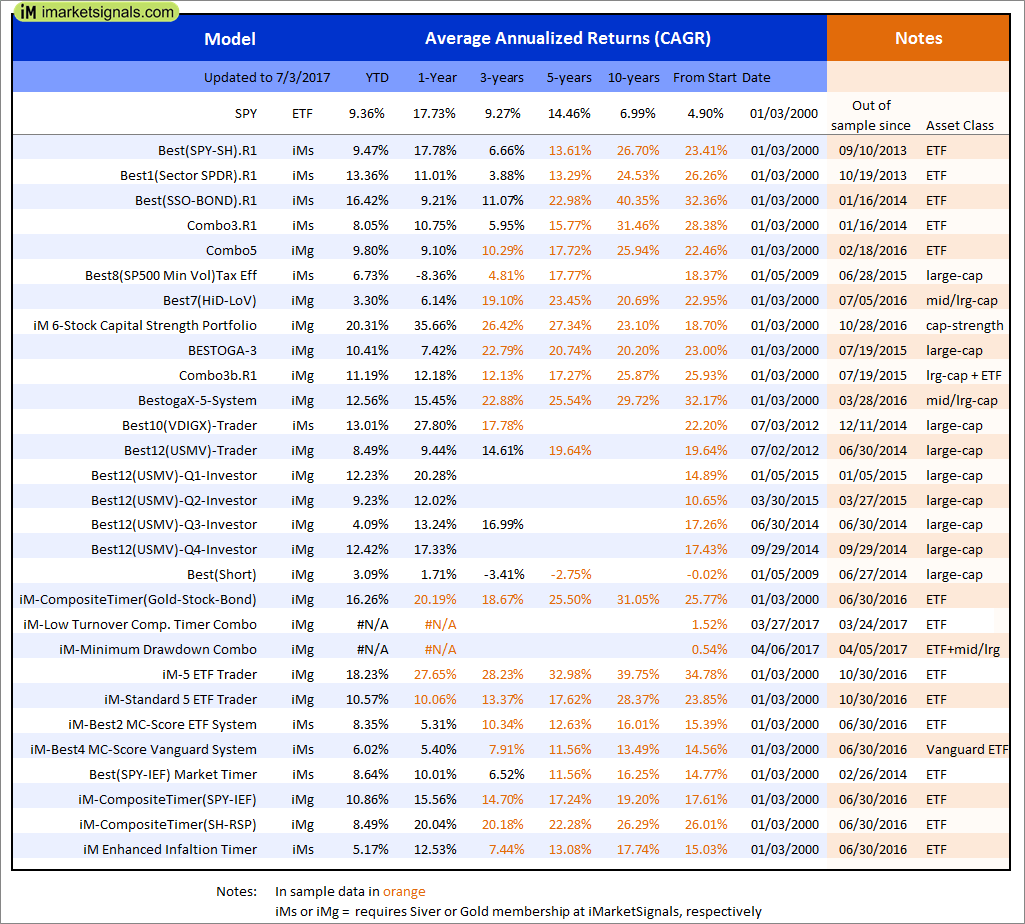
Out of sample performance summary of our models for the past 1, 2, 4 and 13 week periods. The active active return indicates how the models over- or underperformed the benchmark ETF SPY. Also the YTD, and the 1-, 3-, 5- and 10-year annualized returns are shown in the second table |
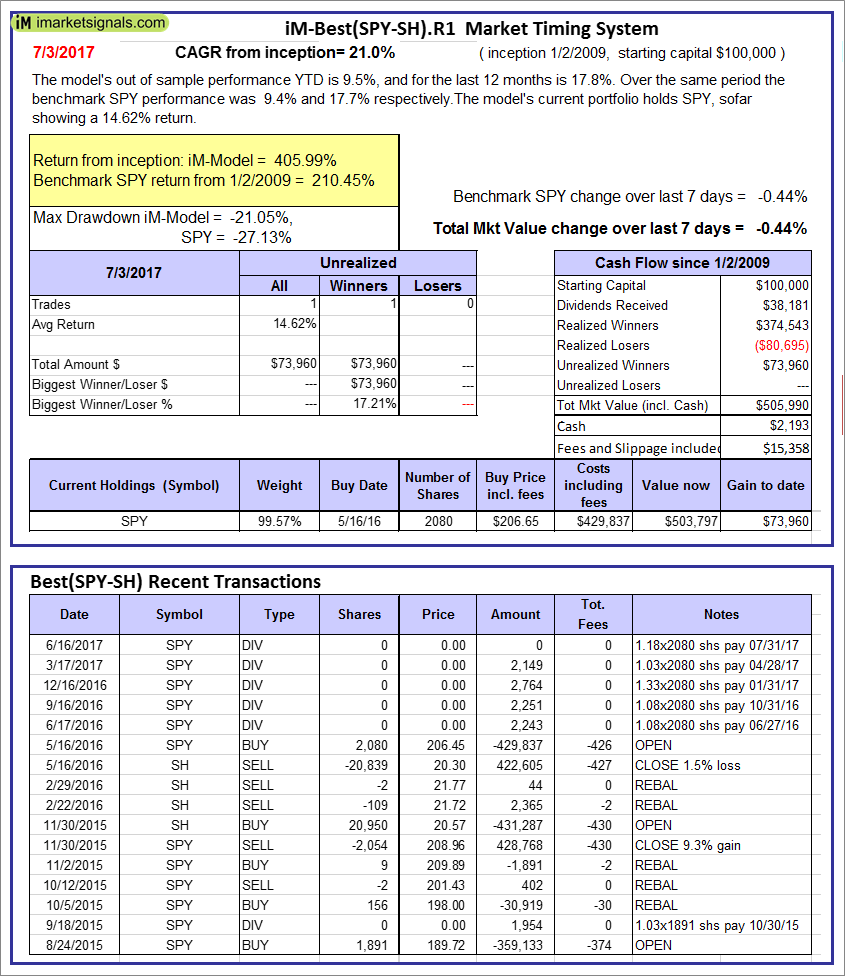 |
iM-Best(SPY-SH).R1: The model’s out of sample performance YTD is 9.5%, and for the last 12 months is 17.8%. Over the same period the benchmark SPY performance was 9.4% and 17.7% respectively. Over the previous week the market value of Best(SPY-SH) gained -0.44% at a time when SPY gained -0.44%. A starting capital of $100,000 at inception on 1/2/2009 would have grown to $505,990 which includes $2,193 cash and excludes $15,358 spent on fees and slippage. |
 |
iM-Combo3.R1: The model’s out of sample performance YTD is 8.1%, and for the last 12 months is 10.8%. Over the same period the benchmark SPY performance was 9.4% and 17.7% respectively. Over the previous week the market value of iM-Combo3.R1 gained -1.69% at a time when SPY gained -0.44%. A starting capital of $100,000 at inception on 2/3/2014 would have grown to $135,768 which includes $271 cash and excludes $3,345 spent on fees and slippage. |
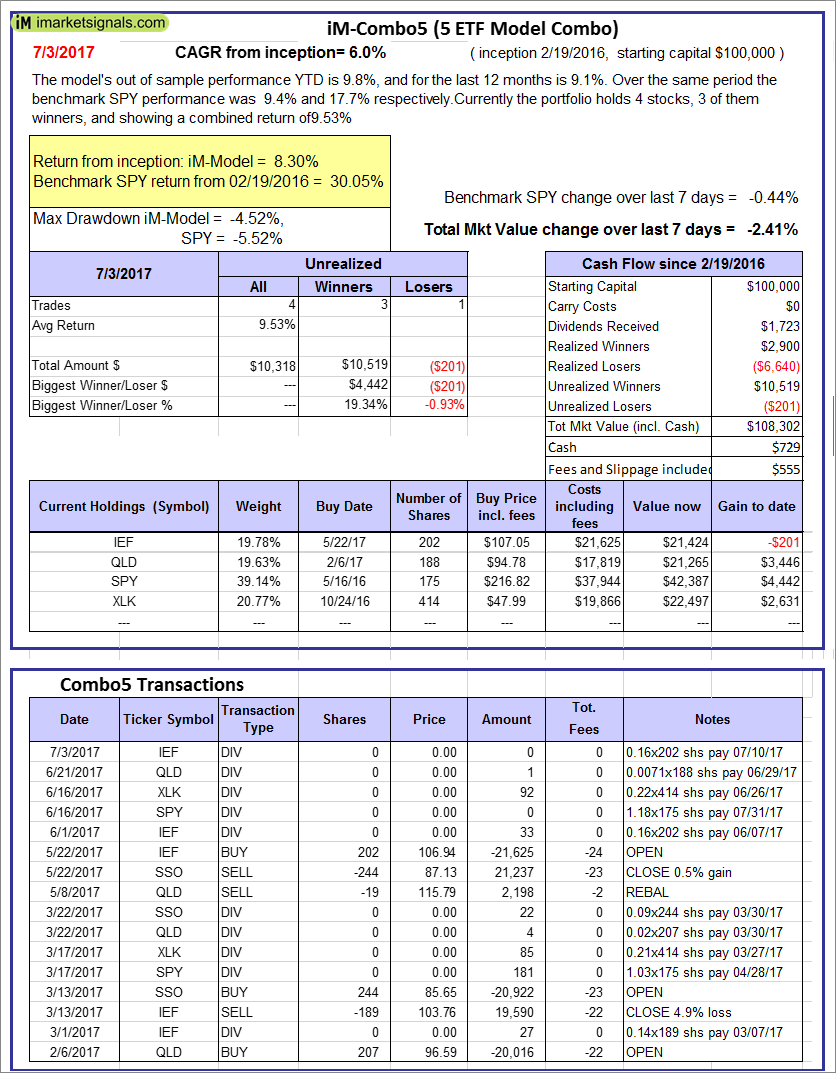 |
iM-Combo5: The model’s out of sample performance YTD is 9.8%, and for the last 12 months is 9.1%. Over the same period the benchmark SPY performance was 9.4% and 17.7% respectively. Over the previous week the market value of iM-Combo5 gained -2.41% at a time when SPY gained -0.44%. A starting capital of $100,000 at inception on 2/22/2016 would have grown to $108,302 which includes $729 cash and excludes $555 spent on fees and slippage. |
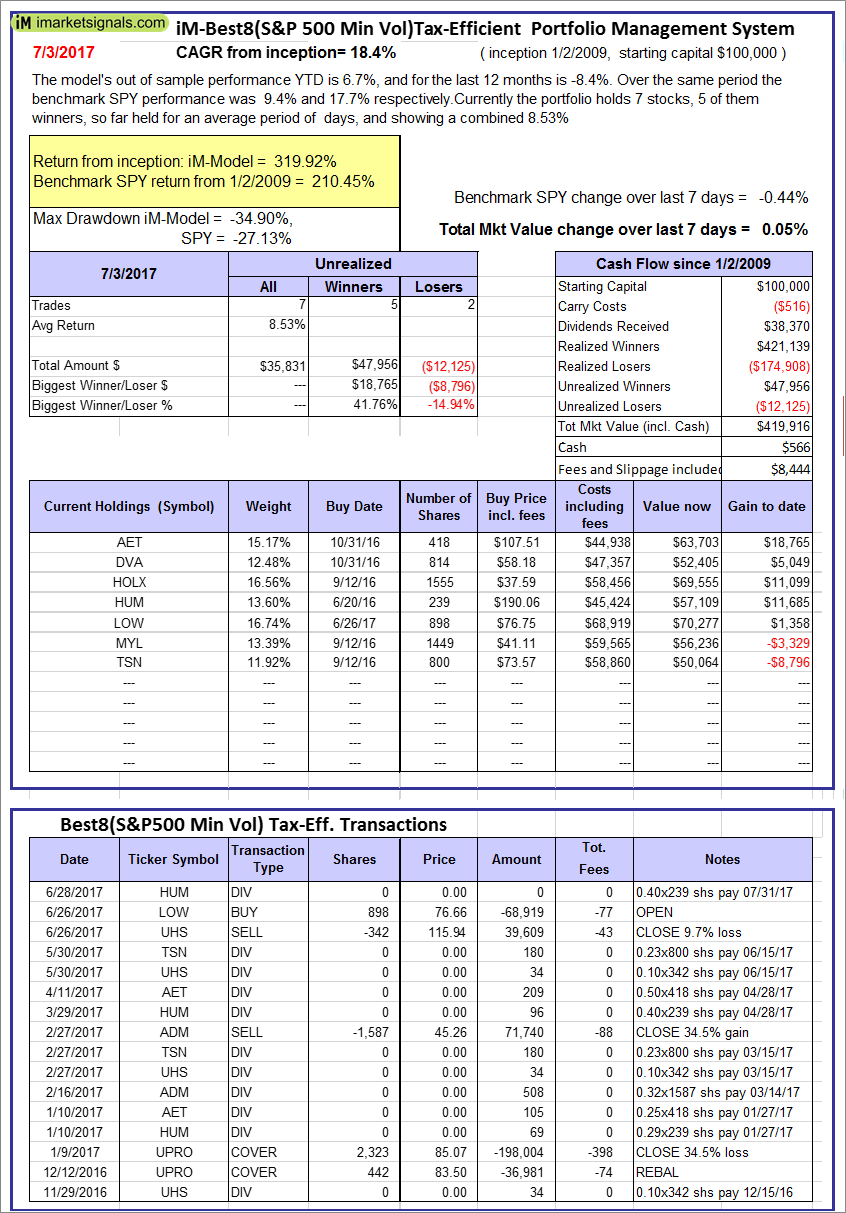 |
The iM-Best8(S&P500 Min Vol)Tax-Efficient The model’s out of sample performance YTD is 6.7%, and for the last 12 months is -8.4%. Over the same period the benchmark SPY performance was 9.4% and 17.7% respectively. Over the previous week the market value of iM-Best8(S&P 500)Tax-Eff. gained 0.05% at a time when SPY gained -0.44%. A starting capital of $100,000 at inception on 1/2/2009 would have grown to $419,916 which includes $566 cash and excludes $8,444 spent on fees and slippage. |
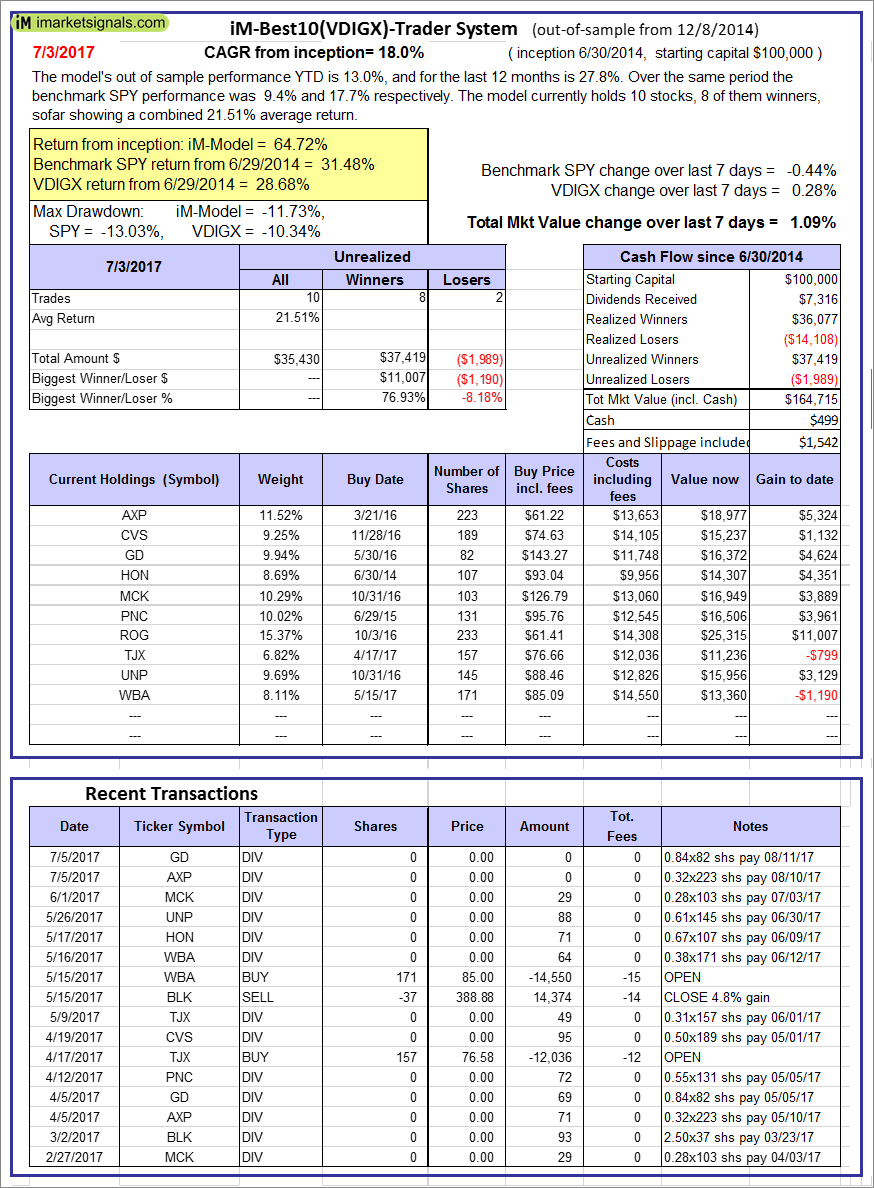 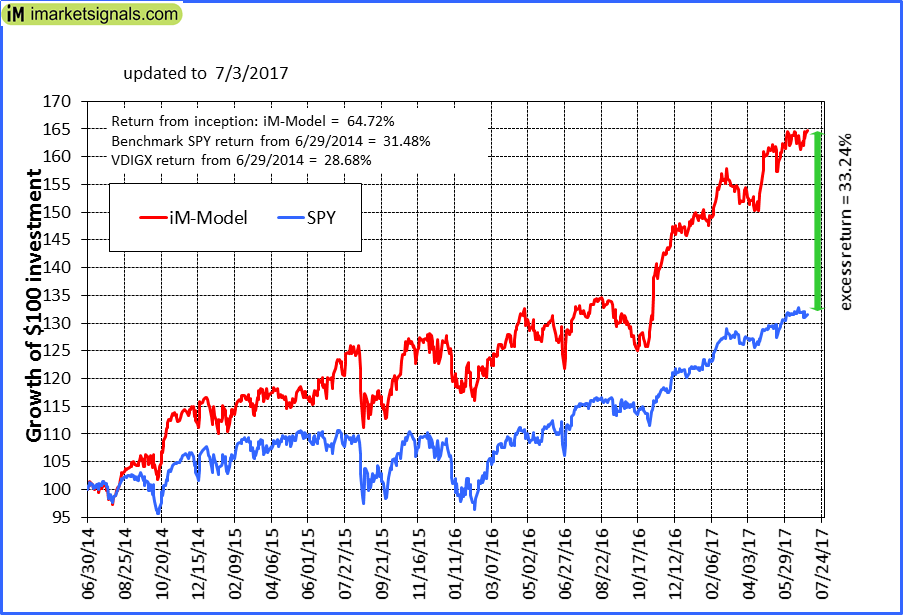 |
iM-Best10(VDIGX)-Trader: The model’s out of sample performance YTD is 13.0%, and for the last 12 months is 27.8%. Over the same period the benchmark SPY performance was 9.4% and 17.7% respectively. Since inception, on 7/1/2014, the model gained 64.72% while the benchmark SPY gained 31.48% and VDIGX gained 28.68% over the same period. Over the previous week the market value of iM-Best10(VDIGX) gained 1.09% at a time when SPY gained -0.44%. A starting capital of $100,000 at inception on 7/1/2014 would have grown to $164,715 which includes $499 cash and excludes $1,542 spent on fees and slippage. |
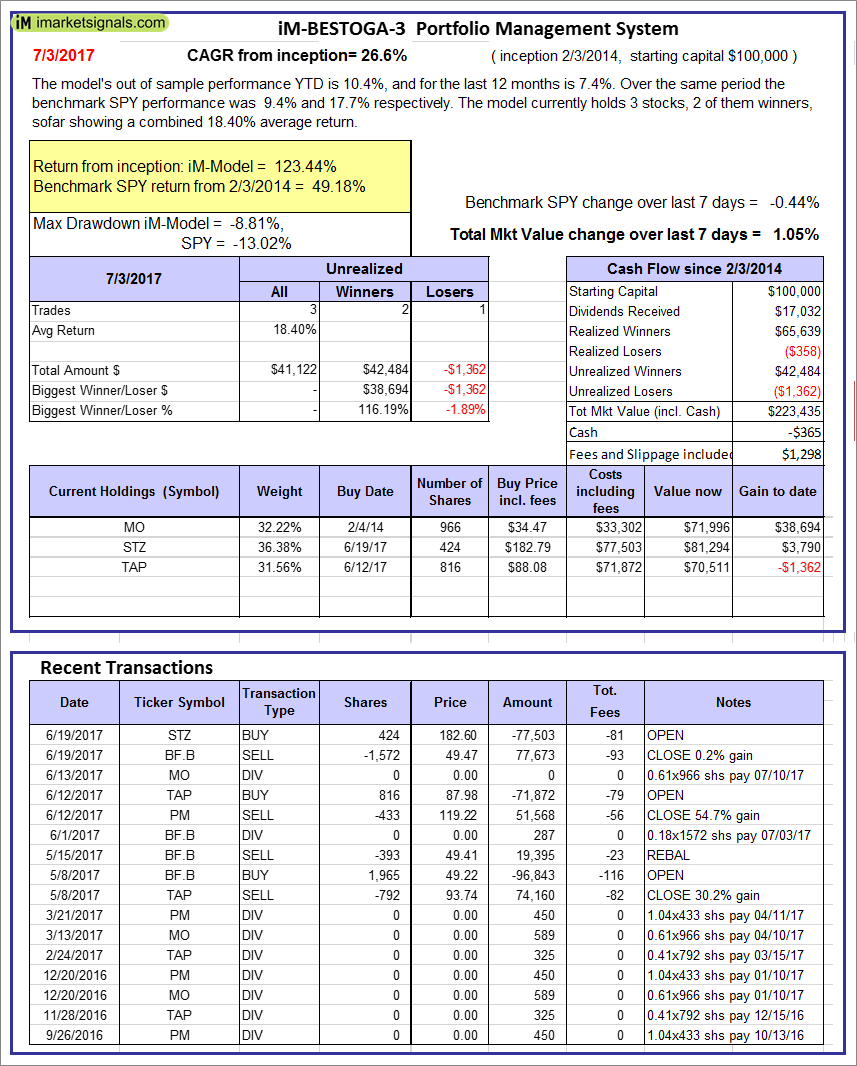 |
iM-BESTOGA-3: The model’s out of sample performance YTD is 10.4%, and for the last 12 months is 7.4%. Over the same period the benchmark SPY performance was 9.4% and 17.7% respectively. Over the previous week the market value of iM-BESTOGA-3 gained 1.05% at a time when SPY gained -0.44%. A starting capital of $100,000 at inception on 2/3/2014 would have grown to $223,435 which includes -$365 cash and excludes $1,298 spent on fees and slippage. |
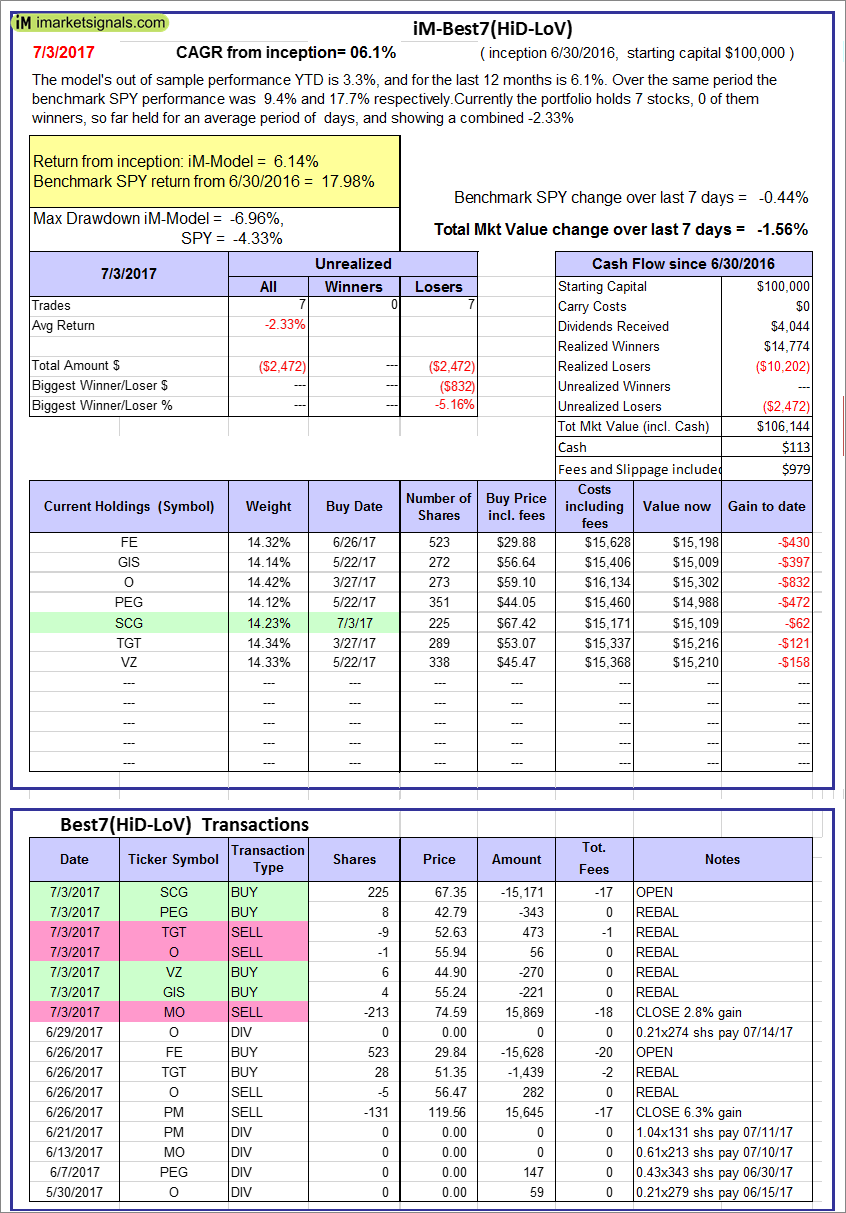 |
iM-Best7(HiD-LoV): The model’s out of sample performance YTD is 3.3%, and for the last 12 months is 6.1%. Over the same period the benchmark SPY performance was 9.4% and 17.7% respectively. Over the previous week the market value of iM-BESTOGA-3 gained -1.56% at a time when SPY gained -0.44%. A starting capital of $100,000 at inception on 6/30/2016 would have grown to $106,144 which includes $113 cash and excludes $979 spent on fees and slippage. |
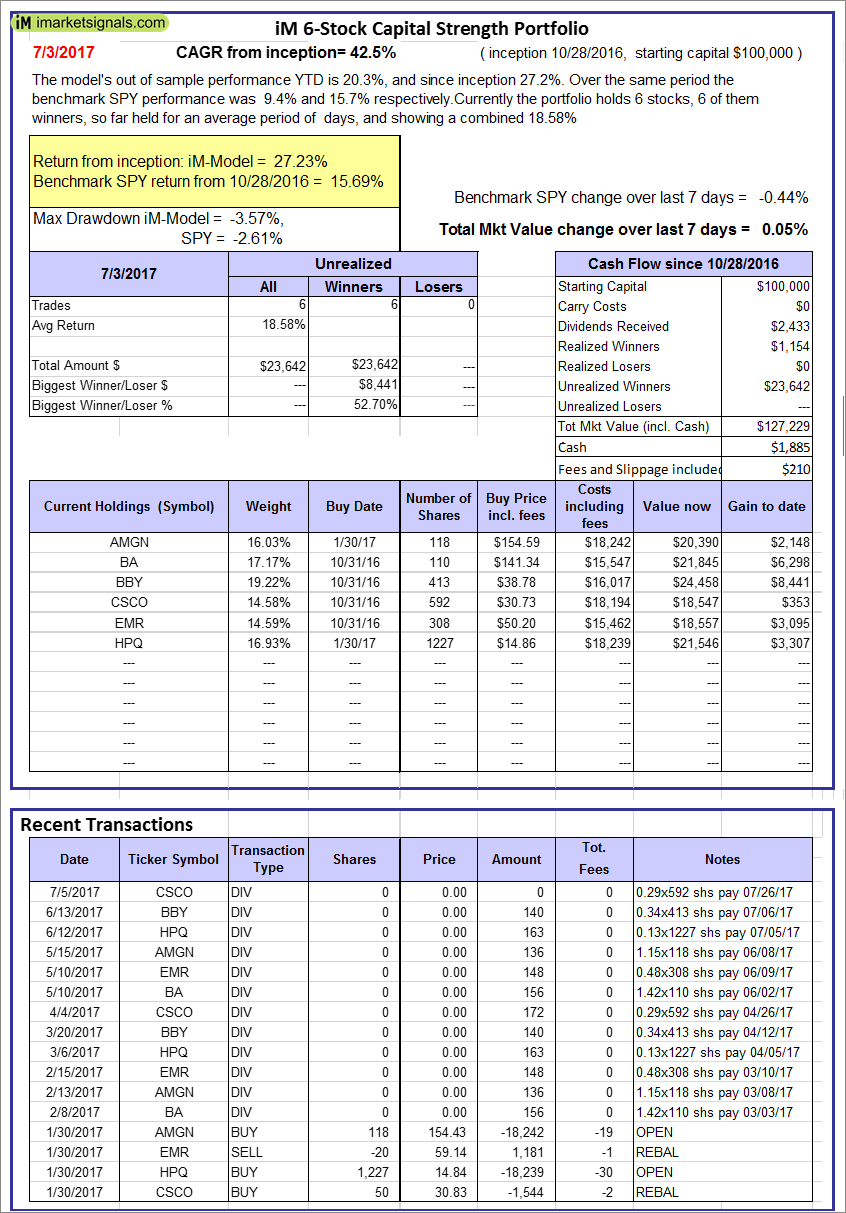 |
iM 6-Stock Capital Strength Portfolio: The model’s out of sample performance YTD is 20.3%, and since inception 27.2%. Over the same period the benchmark SPY performance was 9.4% and 15.7% respectively. Over the previous week the market value of the iM 6-Stock Capital Strength Portfolio gained 0.05% at a time when SPY gained -0.44%. A starting capital of $100,000 at inception on 10/28/2016 would have grown to $127,229 which includes $1,885 cash and excludes $210 spent on fees and slippage. |
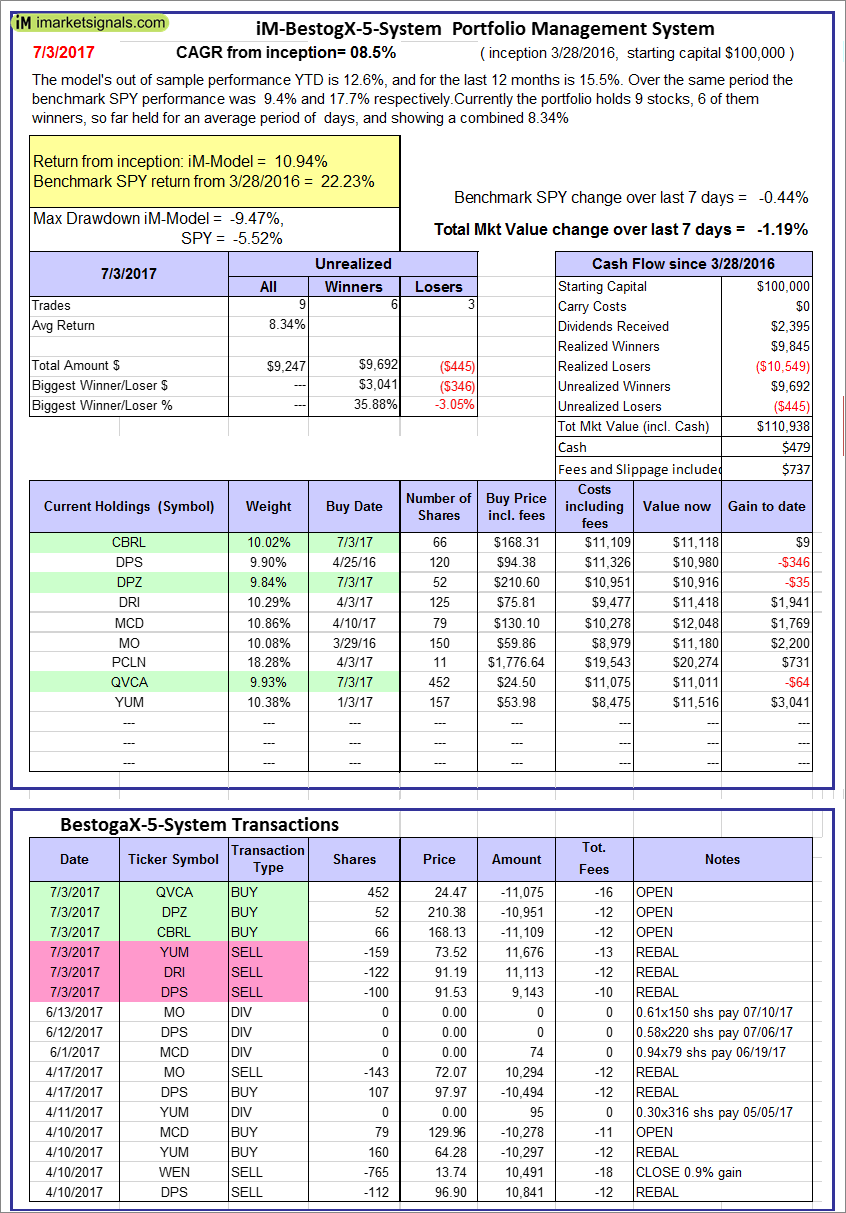 |
iM-BestogaX5-System: The model’s out of sample performance YTD is 12.6%, and for the last 12 months is 15.5%. Over the same period the benchmark SPY performance was 9.4% and 17.7% respectively. Over the previous week the market value of iM-Best8(S&P 500)Tax-Eff. gained -1.19% at a time when SPY gained -0.44%. A starting capital of $100,000 at inception on 3/28/2016 would have grown to $110,938 which includes $479 cash and excludes $737 spent on fees and slippage. |
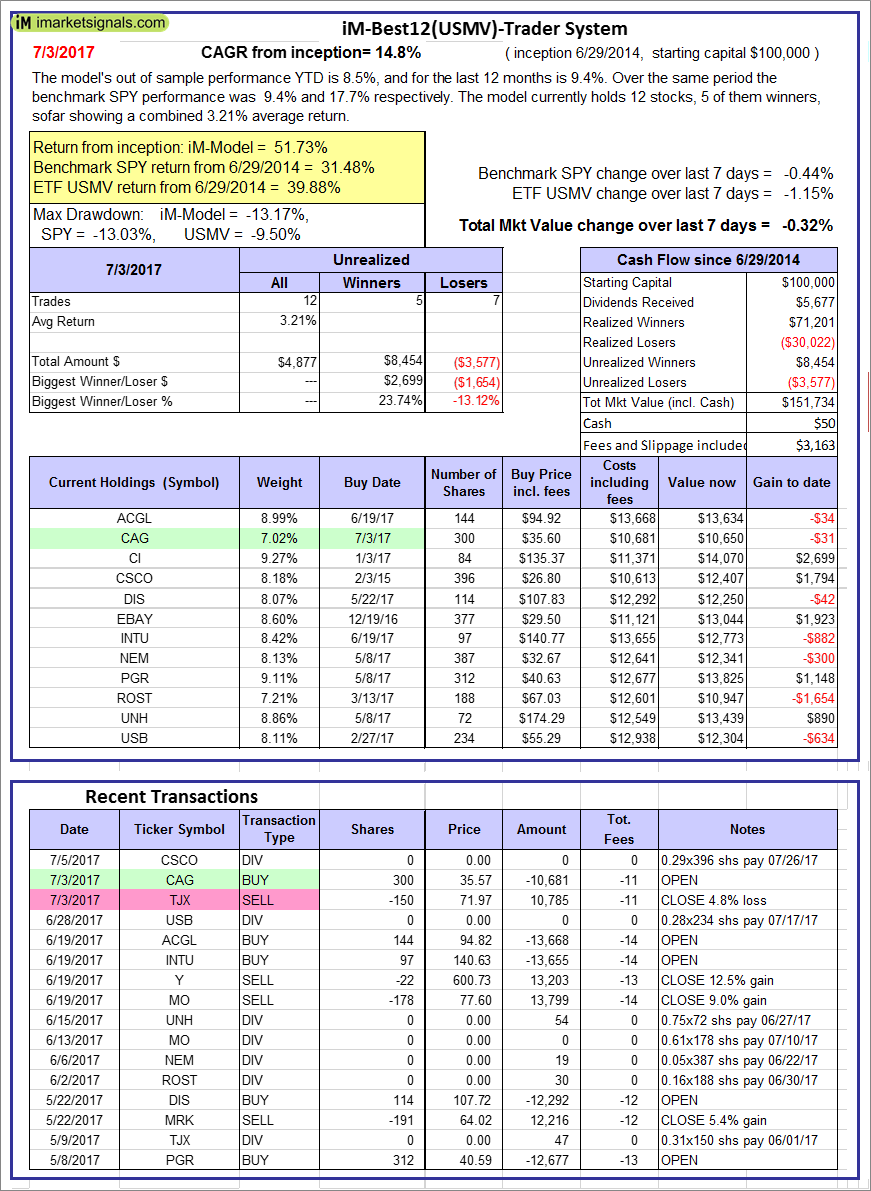  |
iM-Best12(USMV)-Trader: The model’s out of sample performance YTD is 8.5%, and for the last 12 months is 9.4%. Over the same period the benchmark SPY performance was 9.4% and 17.7% respectively. Since inception, on 6/30/2014, the model gained 51.73% while the benchmark SPY gained 31.48% and the ETF USMV gained 39.88% over the same period. Over the previous week the market value of iM-Best12(USMV)-Trader gained -0.32% at a time when SPY gained -0.44%. A starting capital of $100,000 at inception on 6/30/2014 would have grown to $151,734 which includes $50 cash and excludes $3,163 spent on fees and slippage. |
 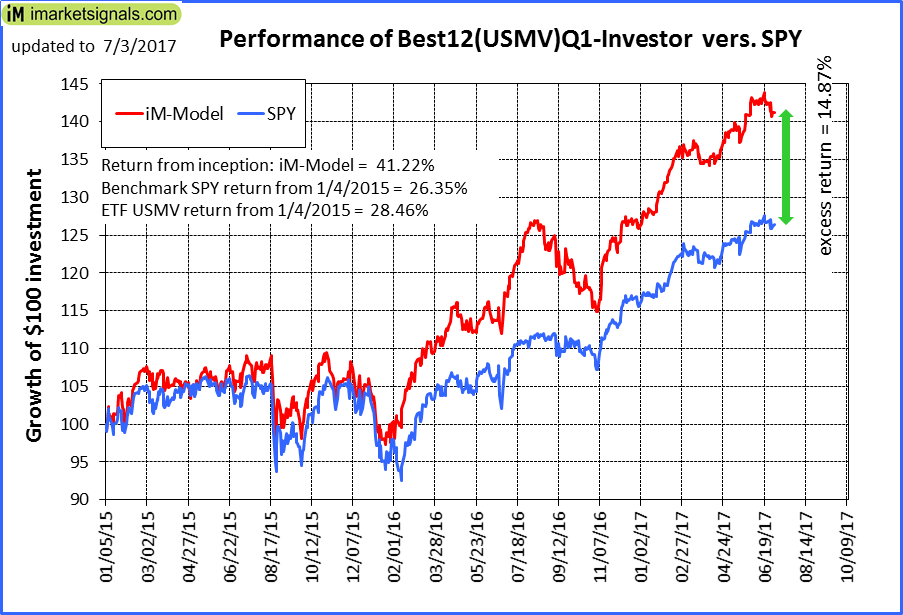 |
iM-Best12(USMV)Q1-Investor: The model’s out of sample performance YTD is 12.2%, and for the last 12 months is 20.3%. Over the same period the benchmark SPY performance was 9.4% and 17.7% respectively. Since inception, on 1/5/2015, the model gained 41.22% while the benchmark SPY gained 26.35% and the ETF USMV gained 28.46% over the same period. Over the previous week the market value of iM-Best12(USMV)Q1 gained -0.73% at a time when SPY gained -0.44%. A starting capital of $100,000 at inception on 1/5/2015 would have grown to $141,217 which includes $94 cash and excludes $749 spent on fees and slippage. |
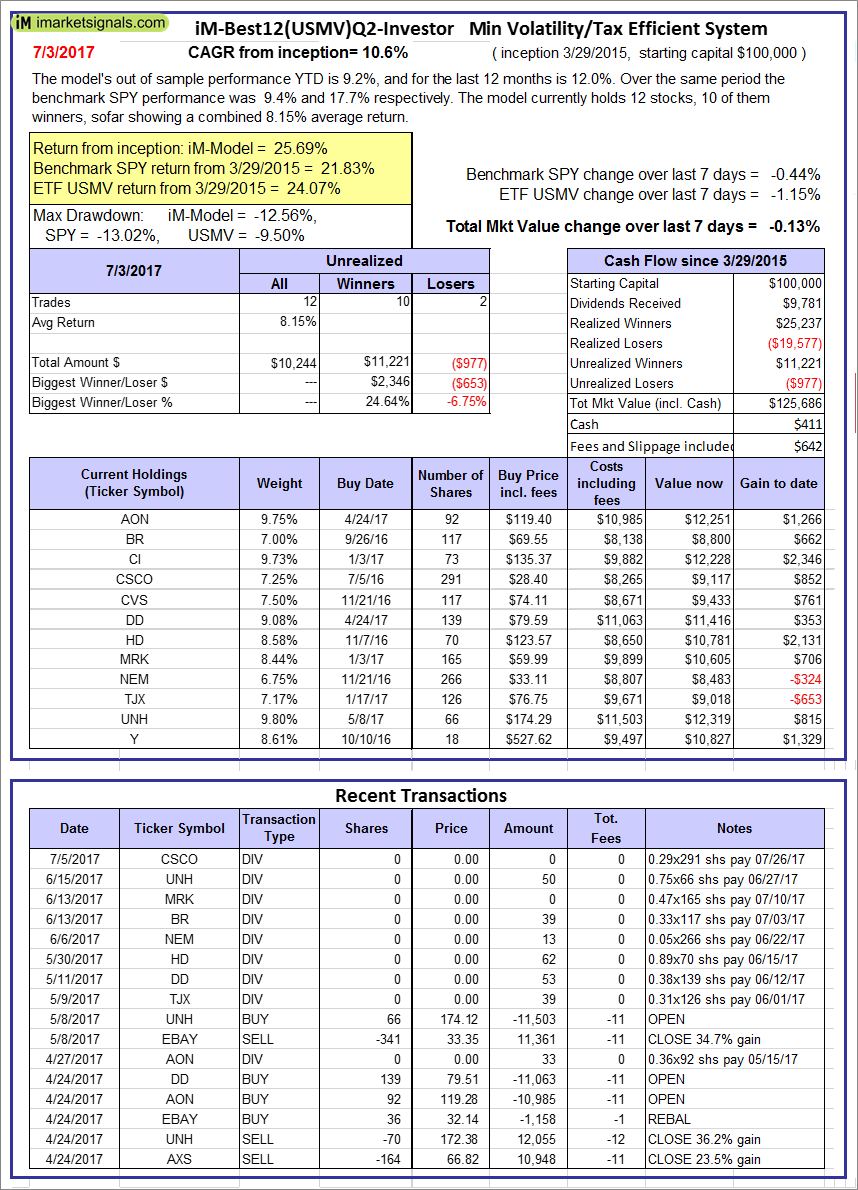 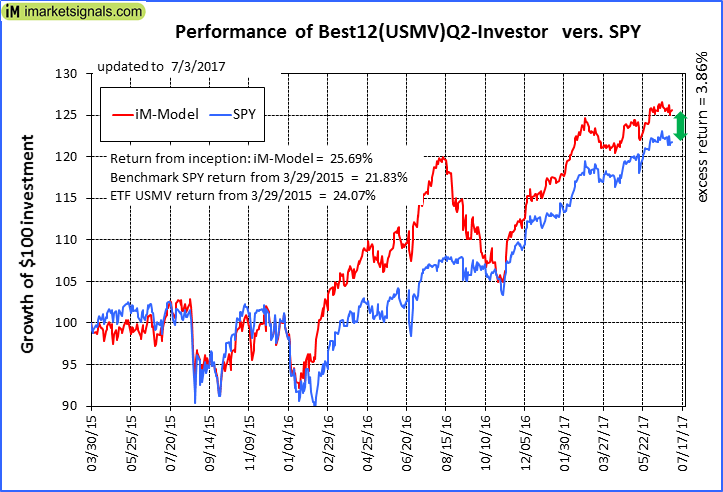 |
iM-Best12(USMV)Q2-Investor: The model’s out of sample performance YTD is 9.2%, and for the last 12 months is 12.0%. Over the same period the benchmark SPY performance was 9.4% and 17.7% respectively. Since inception, on 3/30/2015, the model gained 25.69% while the benchmark SPY gained 21.83% and the ETF USMV gained 24.07% over the same period. Over the previous week the market value of iM-Best12(USMV)Q2 gained -0.13% at a time when SPY gained -0.44%. A starting capital of $100,000 at inception on 3/30/2015 would have grown to $125,686 which includes $411 cash and excludes $642 spent on fees and slippage. |
  |
iM-Best12(USMV)Q3-Investor: The model’s out of sample performance YTD is 4.1%, and for the last 12 months is 13.3%. Over the same period the benchmark SPY performance was 9.4% and 17.7% respectively. Since inception, on 7/1/2014, the model gained 61.37% while the benchmark SPY gained 31.48% and the ETF USMV gained 39.88% over the same period. Over the previous week the market value of iM-Best12(USMV)Q3 gained -0.74% at a time when SPY gained -0.44%. A starting capital of $100,000 at inception on 7/1/2014 would have grown to $161,368 which includes $928 cash and excludes $972 spent on fees and slippage. |
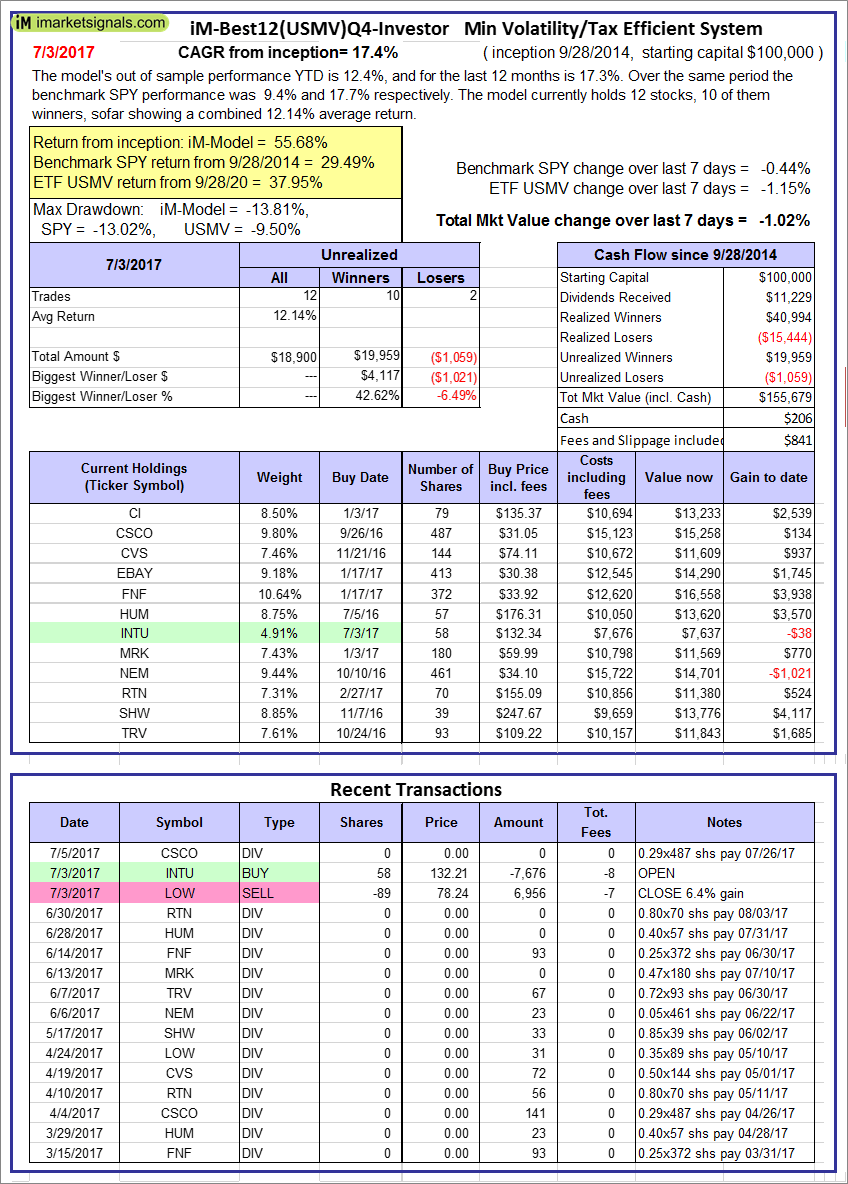 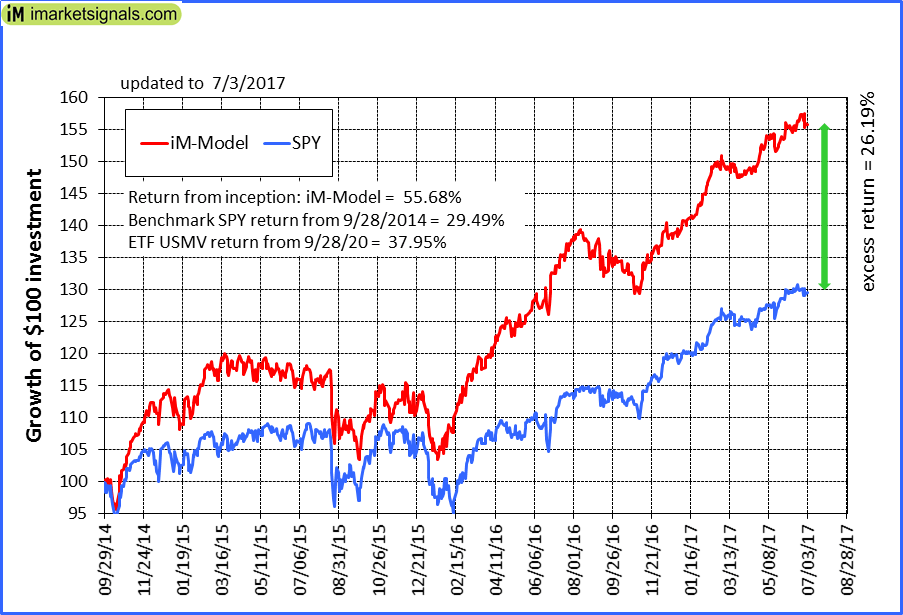 |
iM-Best12(USMV)Q4-Investor: Since inception, on 9/29/2014, the model gained 55.68% while the benchmark SPY gained 29.49% and the ETF USMV gained 37.95% over the same period. Over the previous week the market value of iM-Best12(USMV)Q4 gained -1.02% at a time when SPY gained -0.44%. A starting capital of $100,000 at inception on 9/29/2014 would have grown to $155,679 which includes $206 cash and excludes $841 spent on fees and slippage. |
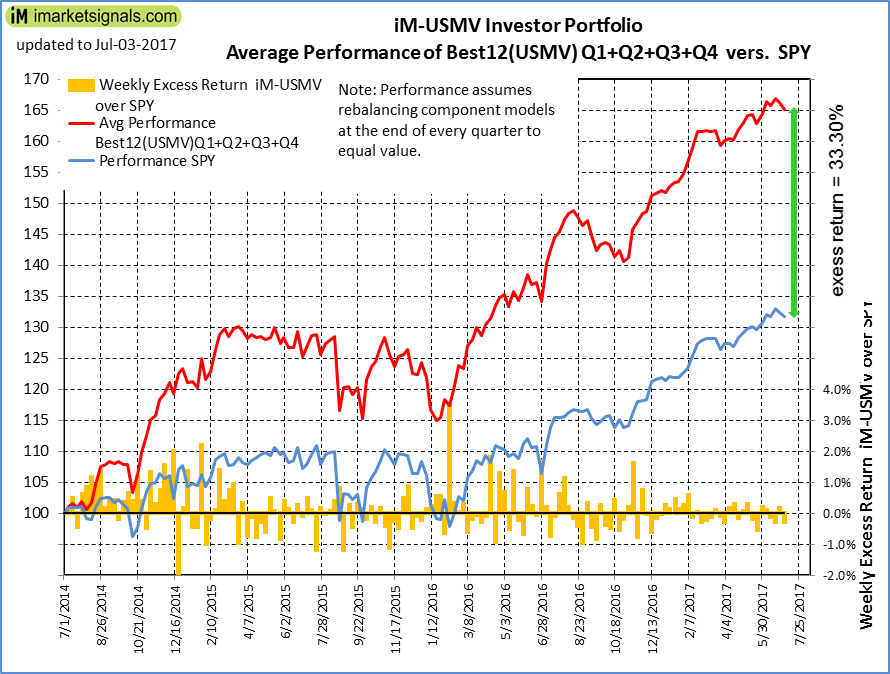 |
Average Performance of iM-Best12(USMV)Q1+Q2+Q3+Q4-Investor resulted in an excess return of 33.30% over SPY. (see iM-USMV Investor Portfolio) |
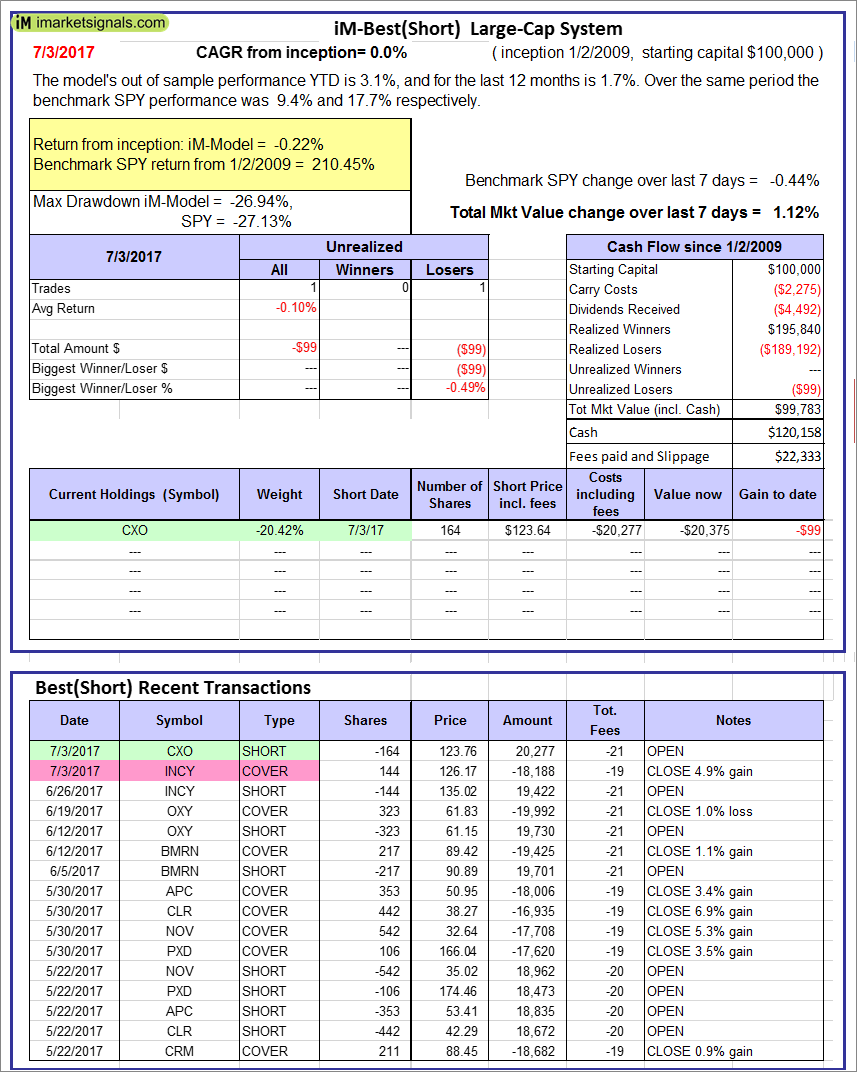 |
iM-Best(Short): The model’s out of sample performance YTD is 3.1%, and for the last 12 months is 1.7%. Over the same period the benchmark SPY performance was 9.4% and 17.7% respectively. Over the previous week the market value of iM-Best(Short) gained 1.12% at a time when SPY gained -0.44%. Over the period 1/2/2009 to 7/3/2017 the starting capital of $100,000 would have grown to $99,783 which includes $120,158 cash and excludes $22,333 spent on fees and slippage. |
 |
iM-Best2 MC-Score ETF System: The model’s out of sample performance YTD is 8.4%, and for the last 12 months is 5.3%. Over the same period the benchmark SPY performance was 9.4% and 17.7% respectively. Over the previous week the market value of the iM-Best2 MC-Score ETF System gained -1.30% at a time when SPY gained -0.44%. A starting capital of $100,000 at inception on 6/30/2016 would have grown to $113,665 which includes $9,353 cash and excludes $107 spent on fees and slippage. |
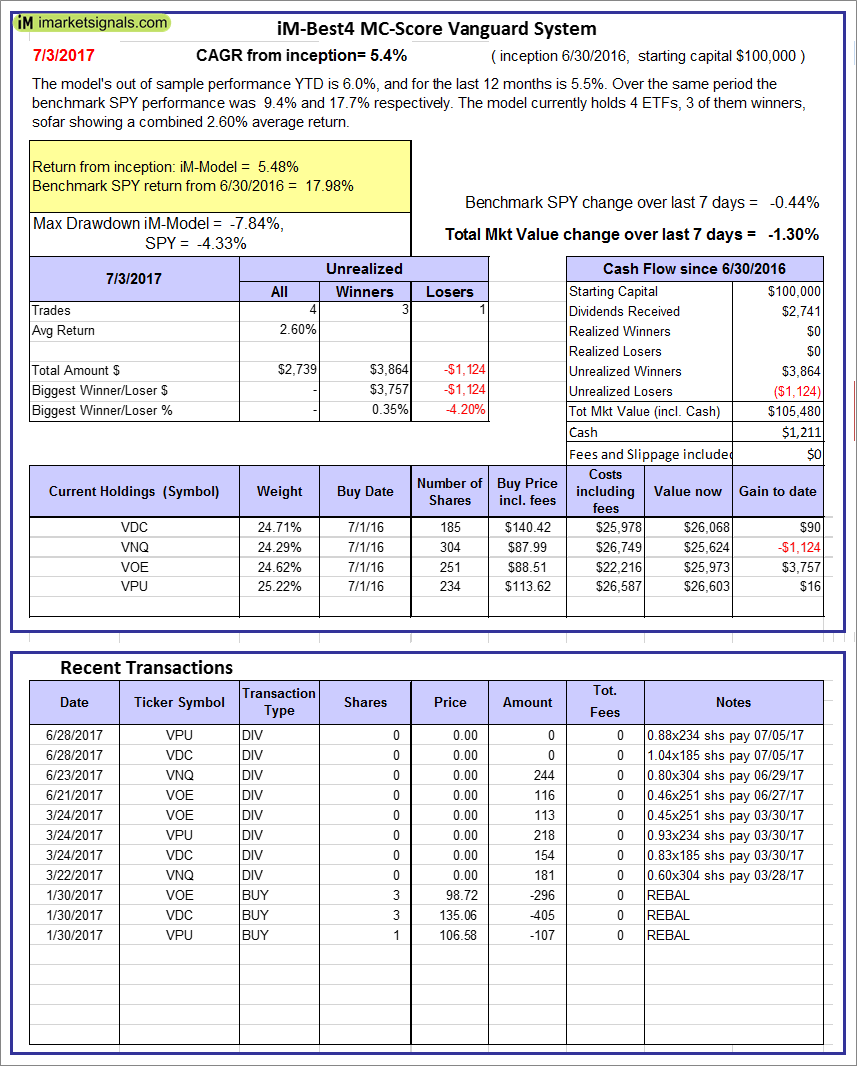 |
iM-Best4 MC-Score Vanguard System: The model’s out of sample performance YTD is 6.0%, and for the last 12 months is 5.5%. Over the same period the benchmark SPY performance was 9.4% and 17.7% respectively. Over the previous week the market value of the iM-Best4 MC-Score Vanguard System gained -1.30% at a time when SPY gained -0.44%. A starting capital of $100,000 at inception on 6/30/2016 would have grown to $105,480 which includes $1,211 cash and excludes $00 spent on fees and slippage. |
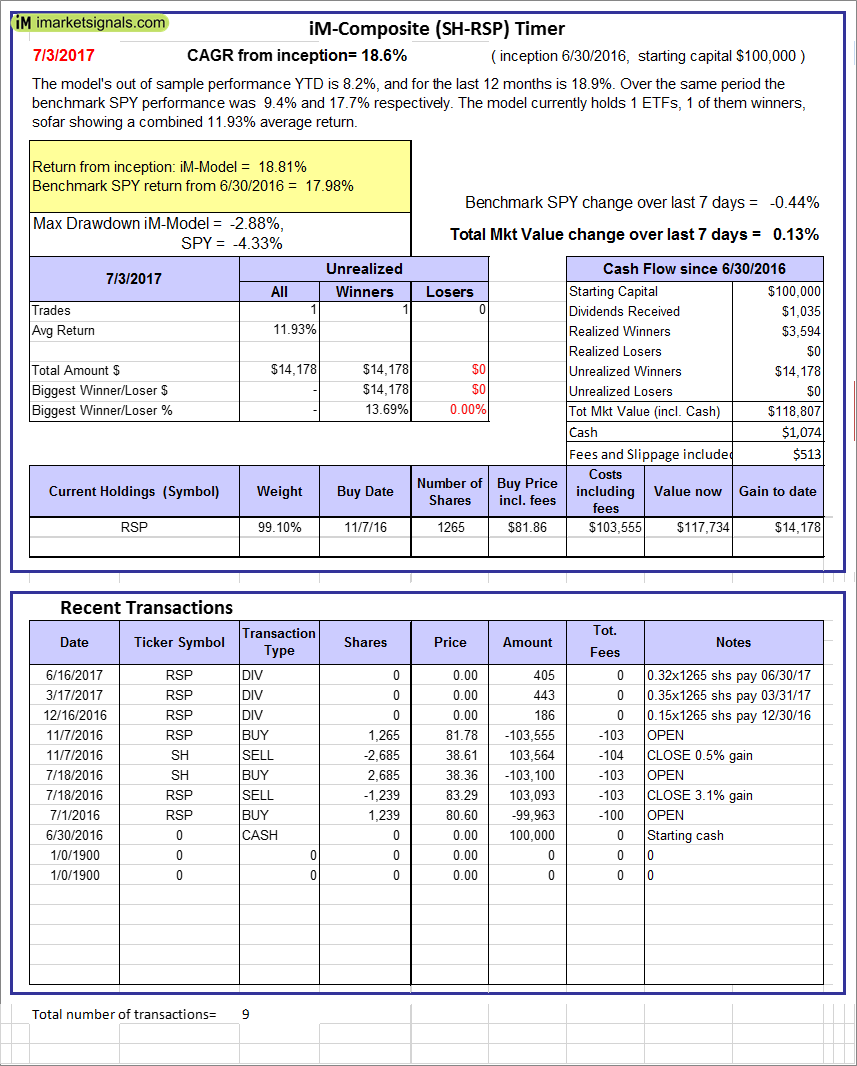 |
iM-Composite (SH-RSP) Timer: The model’s out of sample performance YTD is 8.2%, and for the last 12 months is 18.9%. Over the same period the benchmark SPY performance was 9.4% and 17.7% respectively. Over the previous week the market value of the iM-Composite (SH-RSP) Timer gained 0.13% at a time when SPY gained -0.44%. A starting capital of $100,000 at inception on 6/30/2016 would have grown to $118,807 which includes $1,074 cash and excludes $513 spent on fees and slippage. |
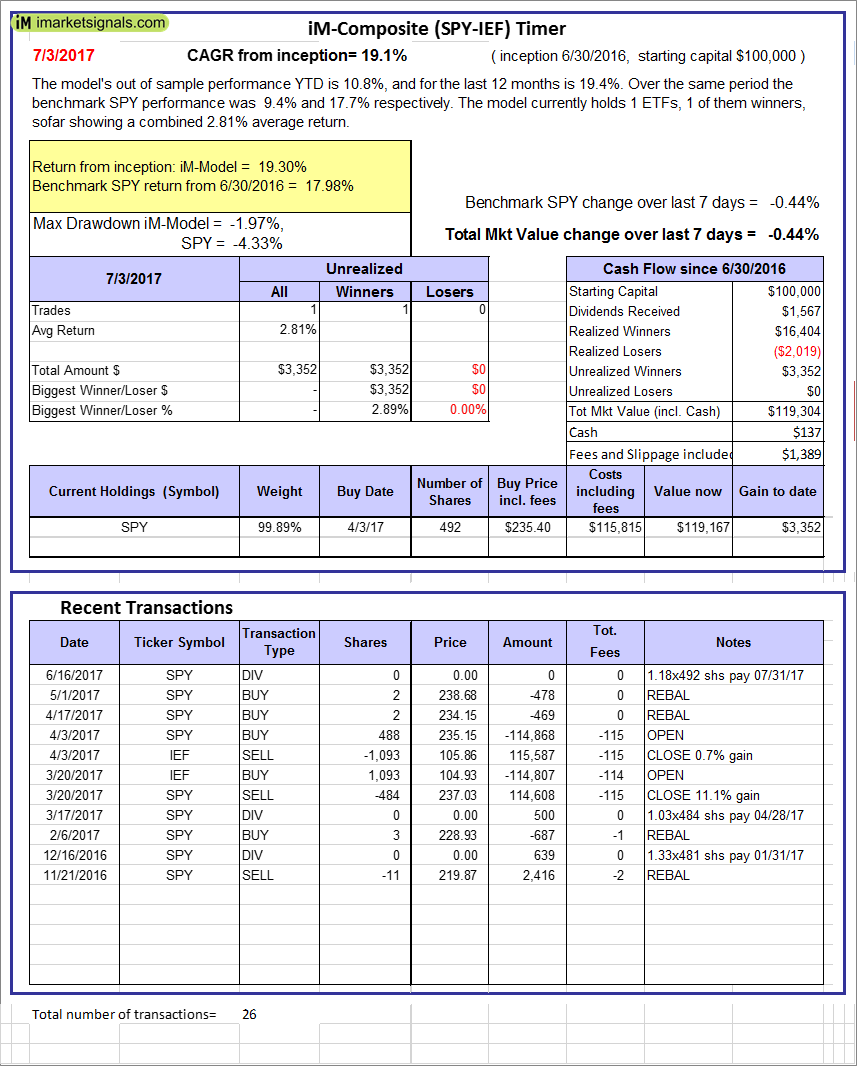 |
iM-Composite (SPY-IEF) Timer: The model’s out of sample performance YTD is 10.8%, and for the last 12 months is 19.4%. Over the same period the benchmark SPY performance was 9.4% and 17.7% respectively. Over the previous week the market value of the iM-Composite (SPY-IEF) Timer gained -0.44% at a time when SPY gained -0.44%. A starting capital of $100,000 at inception on 6/30/2016 would have grown to $119,304 which includes $137 cash and excludes $1,389 spent on fees and slippage. |
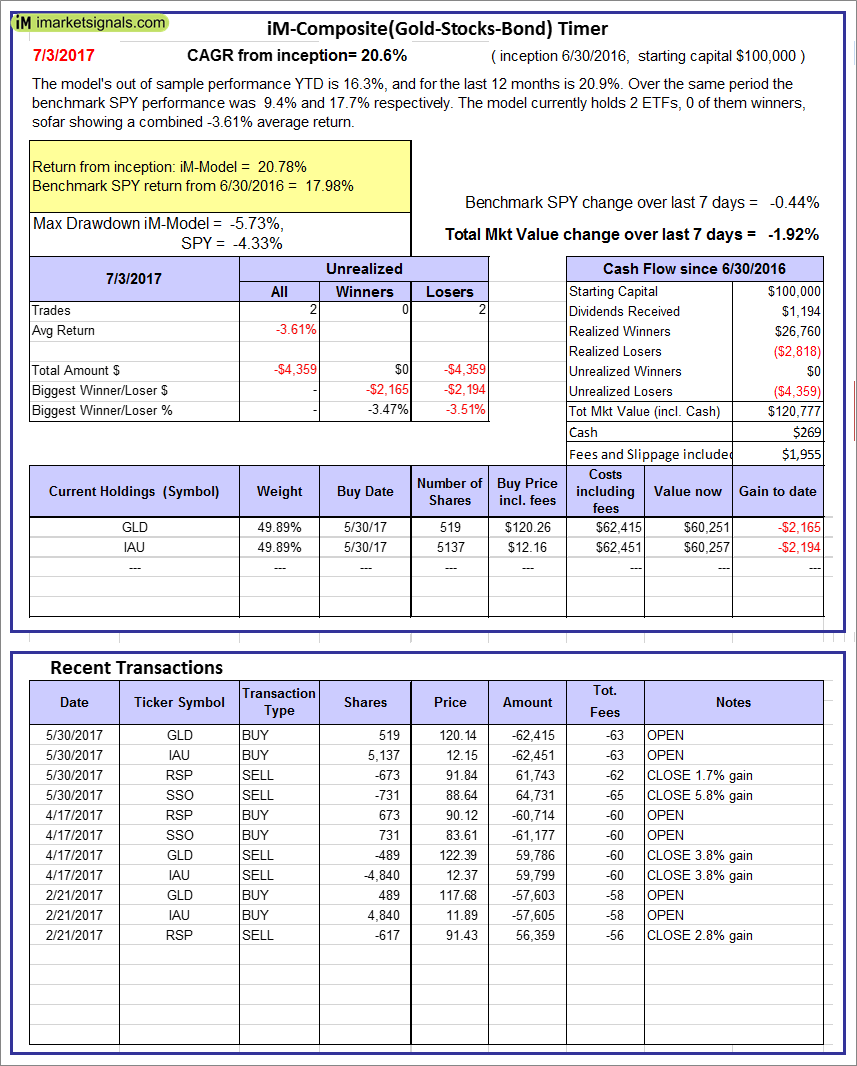 |
iM-Composite(Gold-Stocks-Bond) Timer: The model’s out of sample performance YTD is 16.3%, and for the last 12 months is 20.9%. Over the same period the benchmark SPY performance was 9.4% and 17.7% respectively. Over the previous week the market value of the iM-Composite(Gold-Stocks-Bond) Timer gained -1.92% at a time when SPY gained -0.44%. A starting capital of $100,000 at inception on 6/30/2016 would have grown to $120,777 which includes $269 cash and excludes $1,955 spent on fees and slippage. |
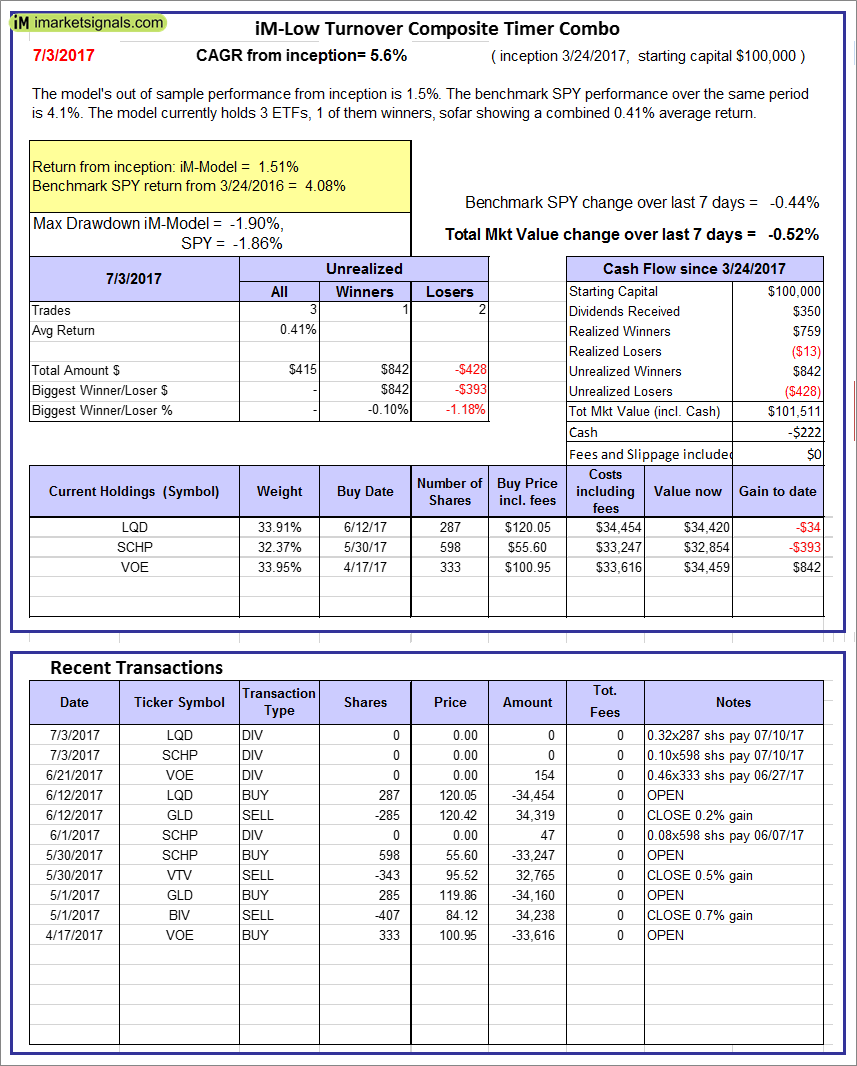 |
iM-Low Turnover Composite Timer Combo: The model’s out of sample performance from inception is 1.5%. The benchmark SPY performance over the same period is 4.1%. Over the previous week the market value of the iM-Low Turnover Composite Timer Combo gained -0.52% at a time when SPY gained -0.44%. A starting capital of $100,000 at inception on 3/24/27 would have grown to $101,511 which includes -$222 cash and excludes $00 spent on fees and slippage. |
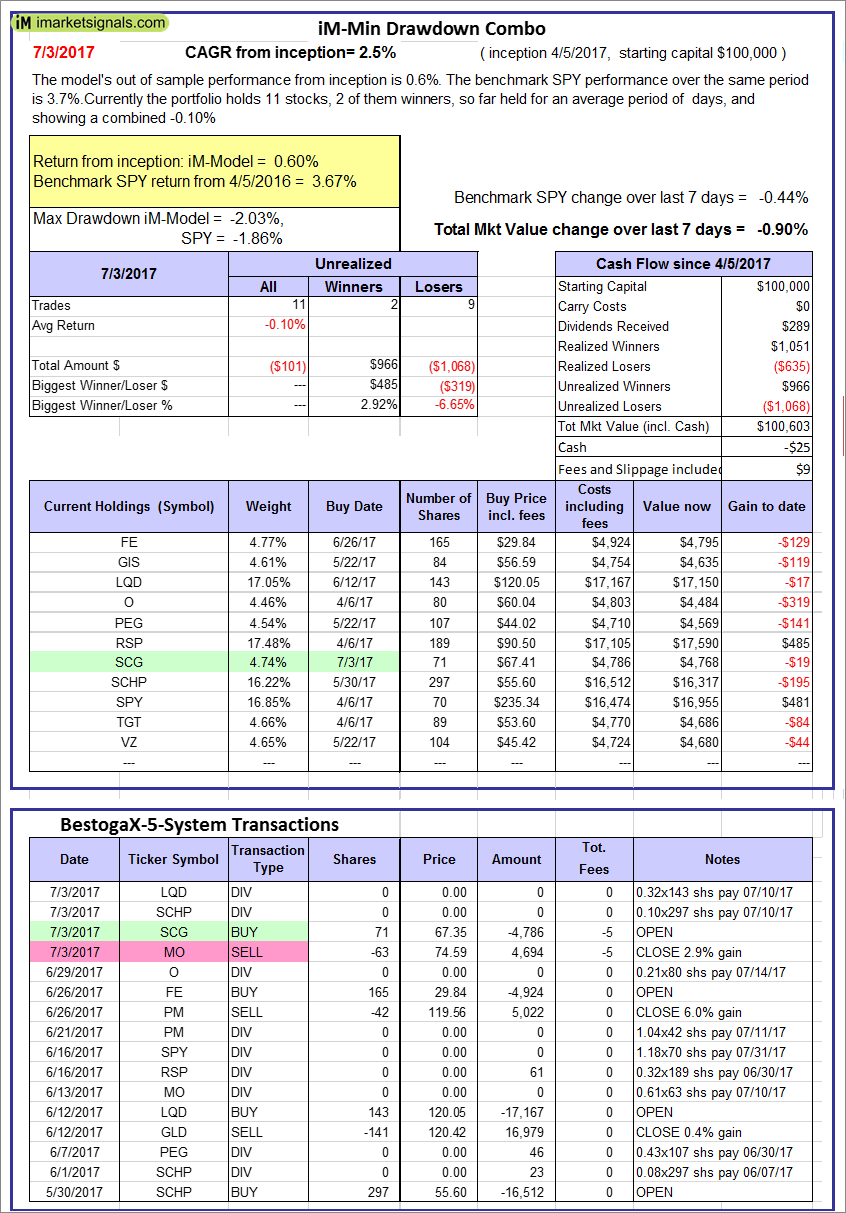 |
iM-Min Drawdown Combo: The model’s out of sample performance from inception is 0.6%. The benchmark SPY performance over the same period is 3.7%. Over the previous week the market value of the iM-Min Drawdown Combo gained -0.90% at a time when SPY gained -0.44%. A starting capital of $100,000 at inception on 4/5/2017 would have grown to $100,603 which includes -$25 cash and excludes $09 spent on fees and slippage. |
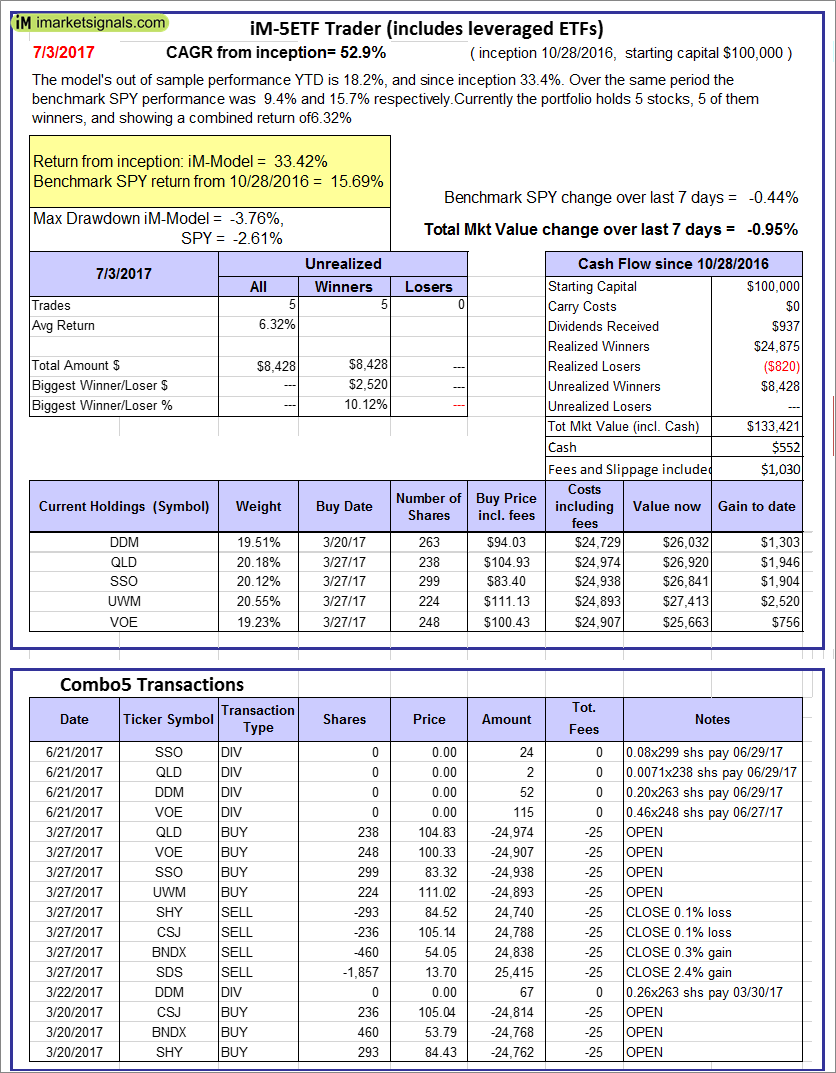 |
iM-5ETF Trader (includes leveraged ETFs): The model’s out of sample performance YTD is 10.6%, and since inception 13.7%. Over the same period the benchmark SPY performance was 9.4% and 15.7% respectively. Over the previous week the market value of the iM-5ETF Trader (includes leveraged ETFs) gained -0.95% at a time when SPY gained -0.44%. A starting capital of $100,000 at inception on 10/30/2016 would have grown to $133,421 which includes $552 cash and excludes $1,030 spent on fees and slippage. |
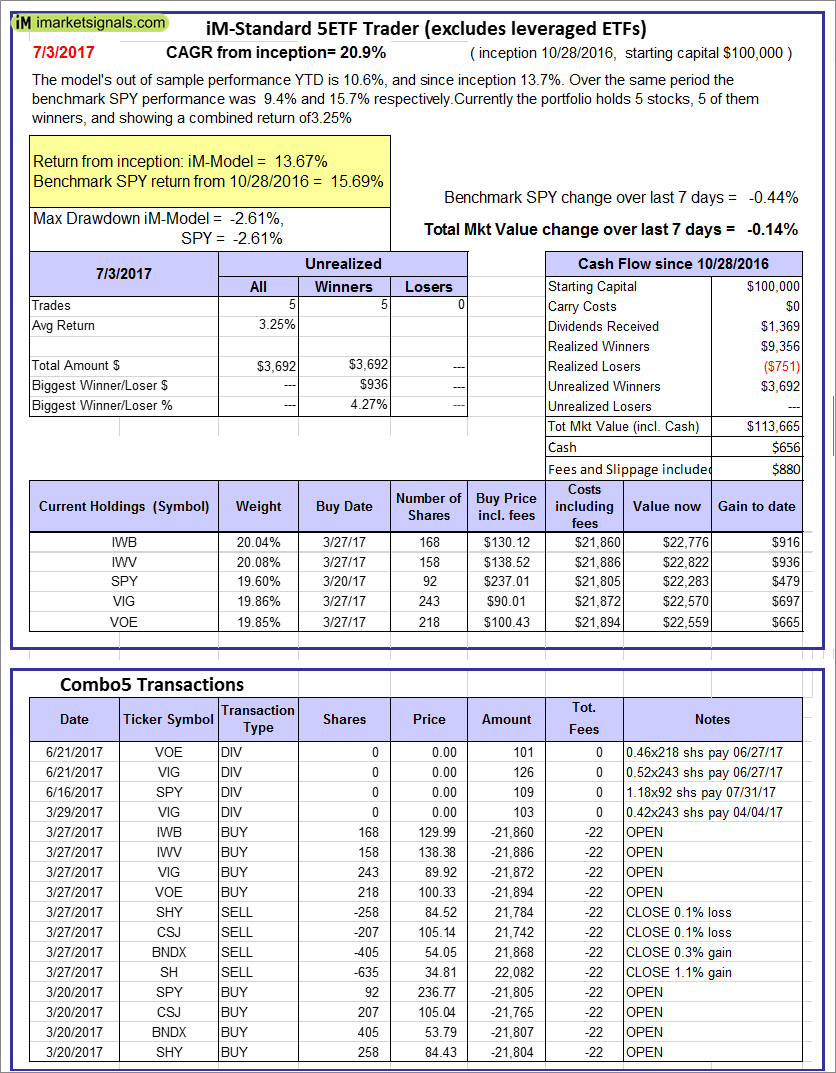 |
iM-Standard 5ETF Trader (excludes leveraged ETFs): The model’s out of sample performance YTD is 10.6%, and since inception 13.7%. Over the same period the benchmark SPY performance was 9.4% and 15.7% respectively. Over the previous week the market value of the iM-Standard 5ETF Trader (excludes leveraged ETFs) gained -0.14% at a time when SPY gained -0.44%. A starting capital of $100,000 at inception on 10/30/2016 would have grown to $113,665 which includes $656 cash and excludes $880 spent on fees and slippage. |
iM-Best Reports – 7/3/2017
Posted in pmp SPY-SH
Leave a Reply
You must be logged in to post a comment.