
  |
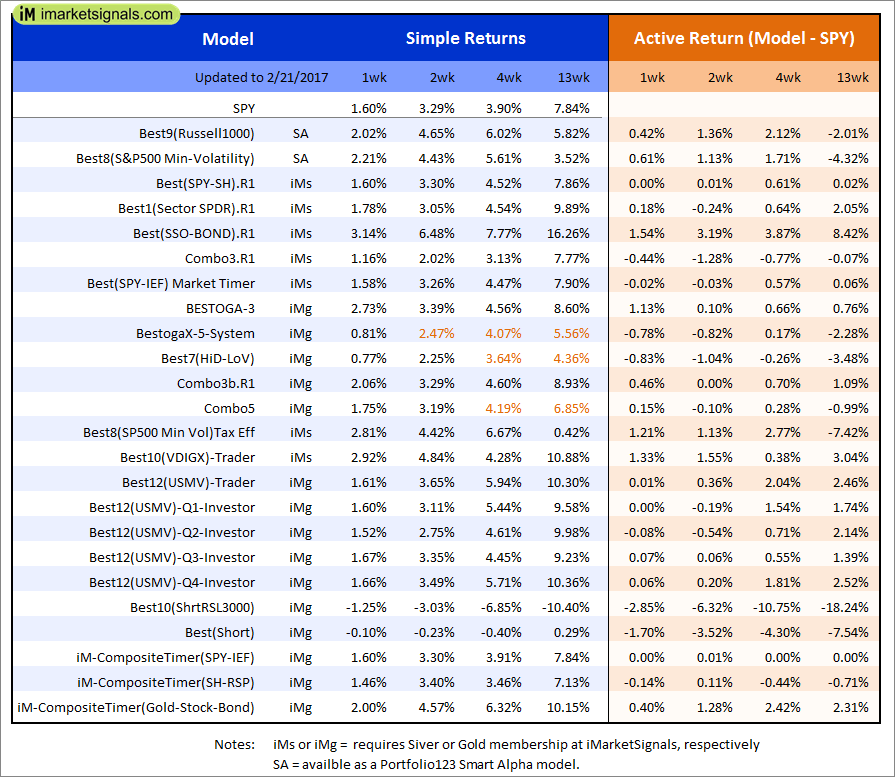
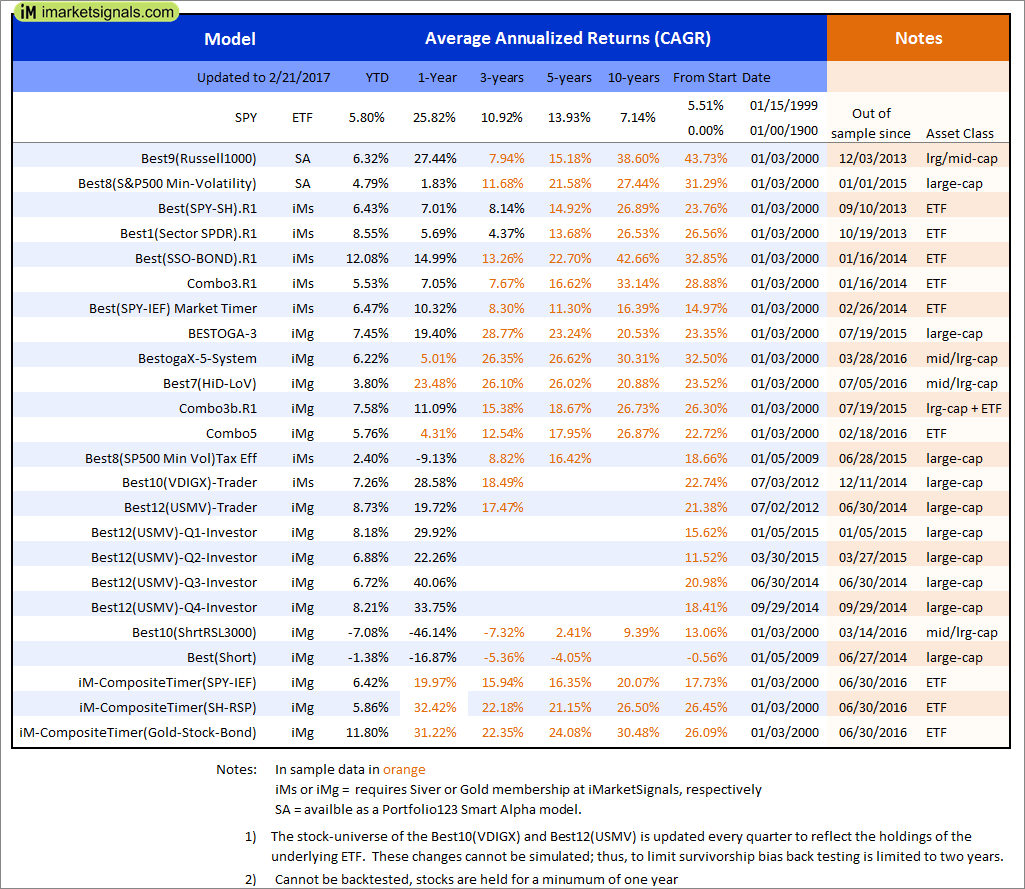
Out of sample performance summary of our models for the past 1, 2, 4 and 13 week periods. The active active return indicates how the models over- or underperformed the benchmark ETF SPY. Also the YTD, and the 1-, 3-, 5- and 10-year annualized returns are shown in the second table |
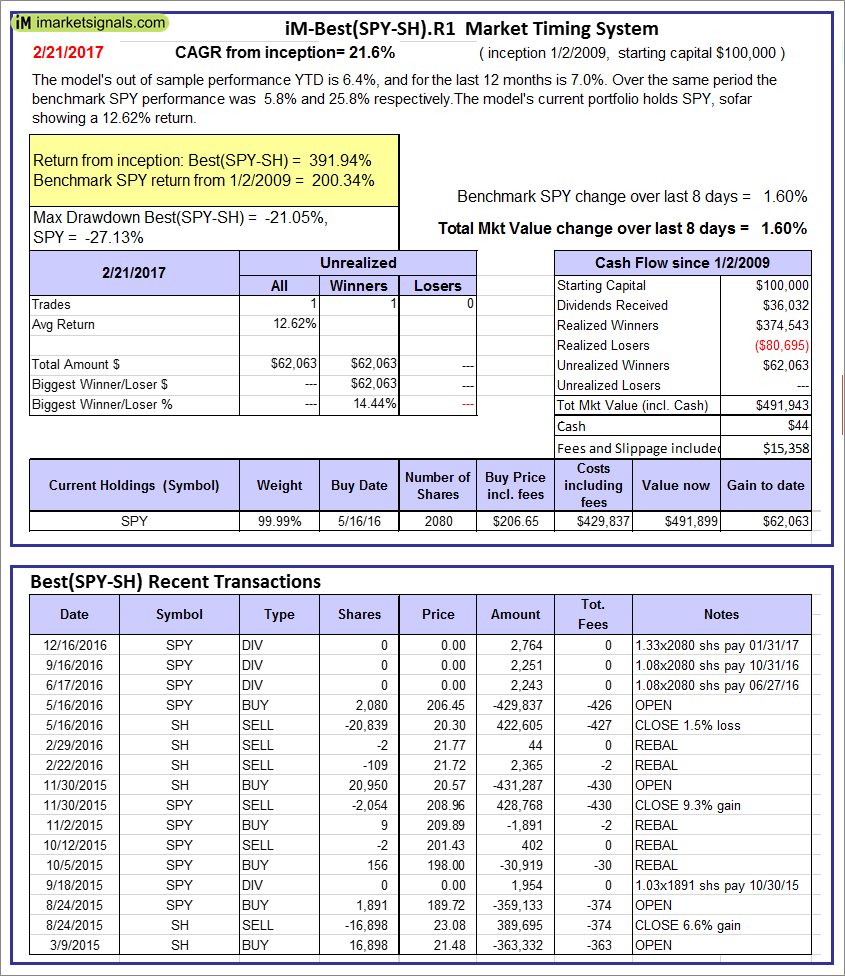 |
iM-Best(SPY-SH).R1: The model’s out of sample performance YTD is 6.4%, and for the last 12 months is 7.0%. Over the same period the benchmark SPY performance was 5.8% and 25.8% respectively. Over the previous week the market value of Best(SPY-SH) gained 1.60% at a time when SPY gained 1.60%. A starting capital of $100,000 at inception on 1/2/2009 would have grown to $491,943 which includes $44 cash and excludes $15,358 spent on fees and slippage. |
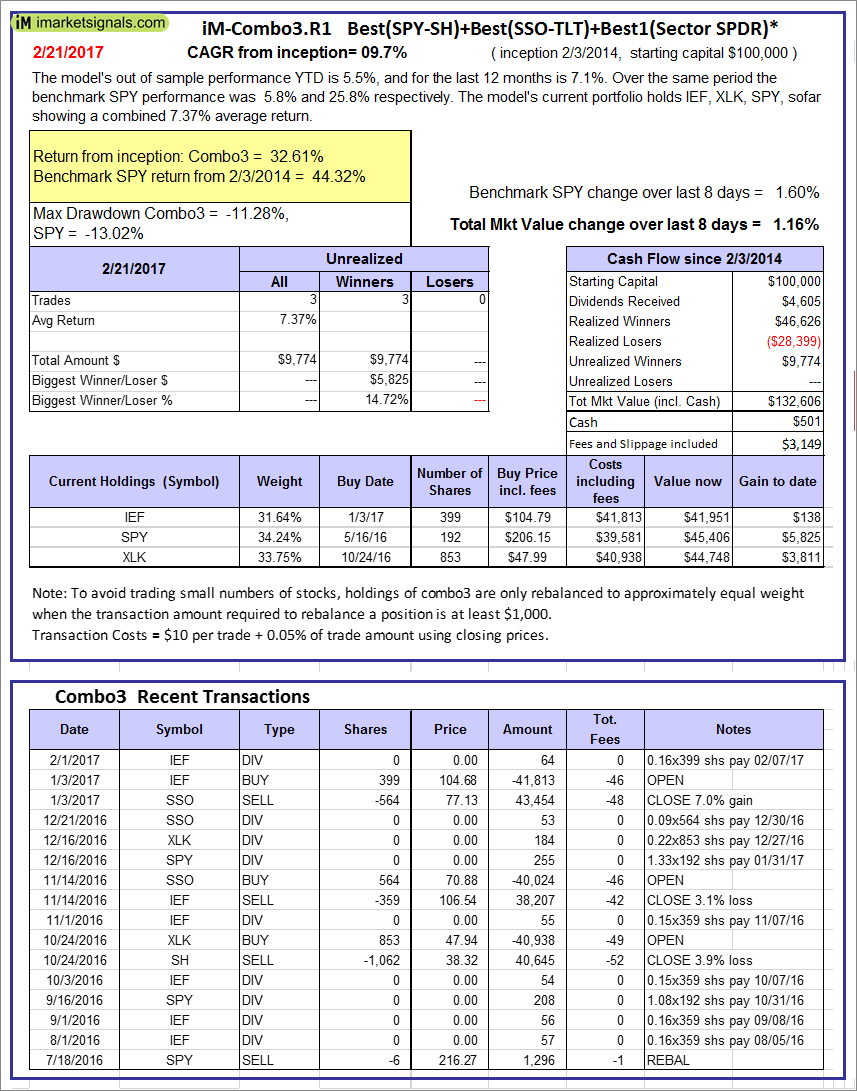 |
iM-Combo3.R1: The model’s out of sample performance YTD is 5.5%, and for the last 12 months is 7.1%. Over the same period the benchmark SPY performance was 5.8% and 25.8% respectively. Over the previous week the market value of iM-Combo3.R1 gained 1.16% at a time when SPY gained 1.60%. A starting capital of $100,000 at inception on 2/3/2014 would have grown to $132,606 which includes $501 cash and excludes $3,149 spent on fees and slippage. |
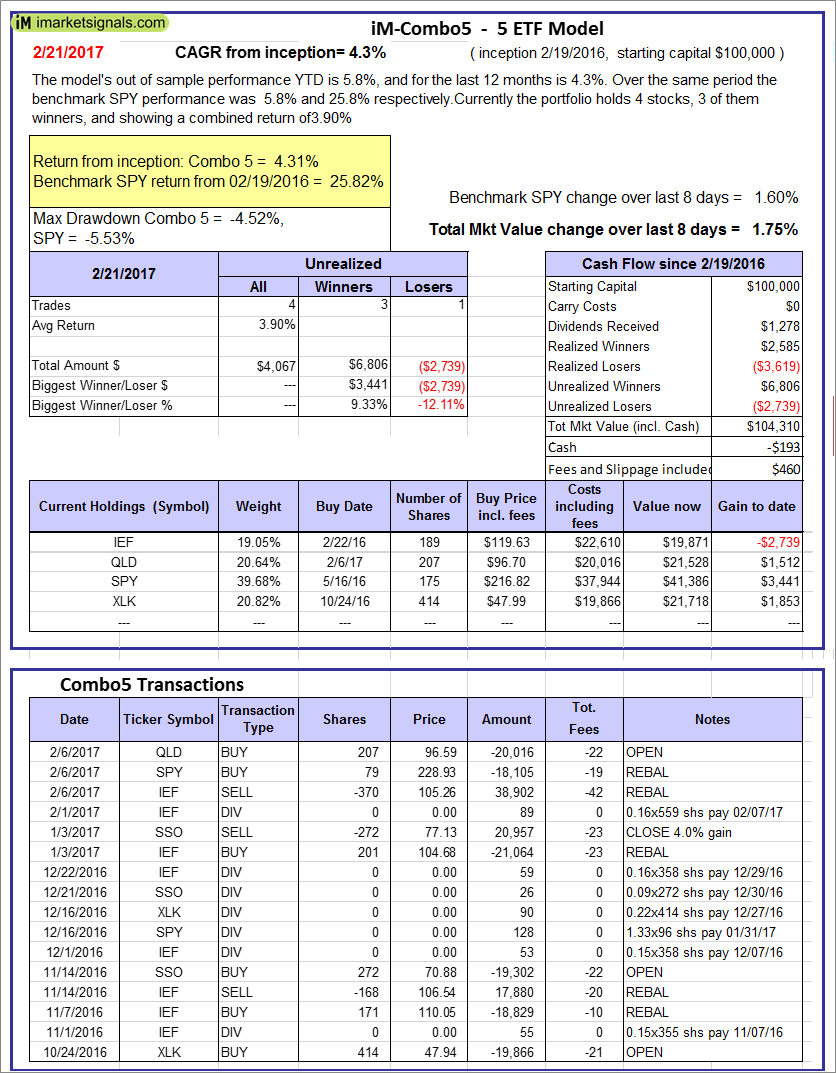 |
iM-Combo5: The model’s out of sample performance YTD is 5.8%, and for the last 12 months is 4.3%. Over the same period the benchmark SPY performance was 5.8% and 25.8% respectively. Over the previous week the market value of iM-Combo5 gained 1.75% at a time when SPY gained 1.60%. A starting capital of $100,000 at inception on 2/22/2016 would have grown to $104,310 which includes -$193 cash and excludes $460 spent on fees and slippage. |
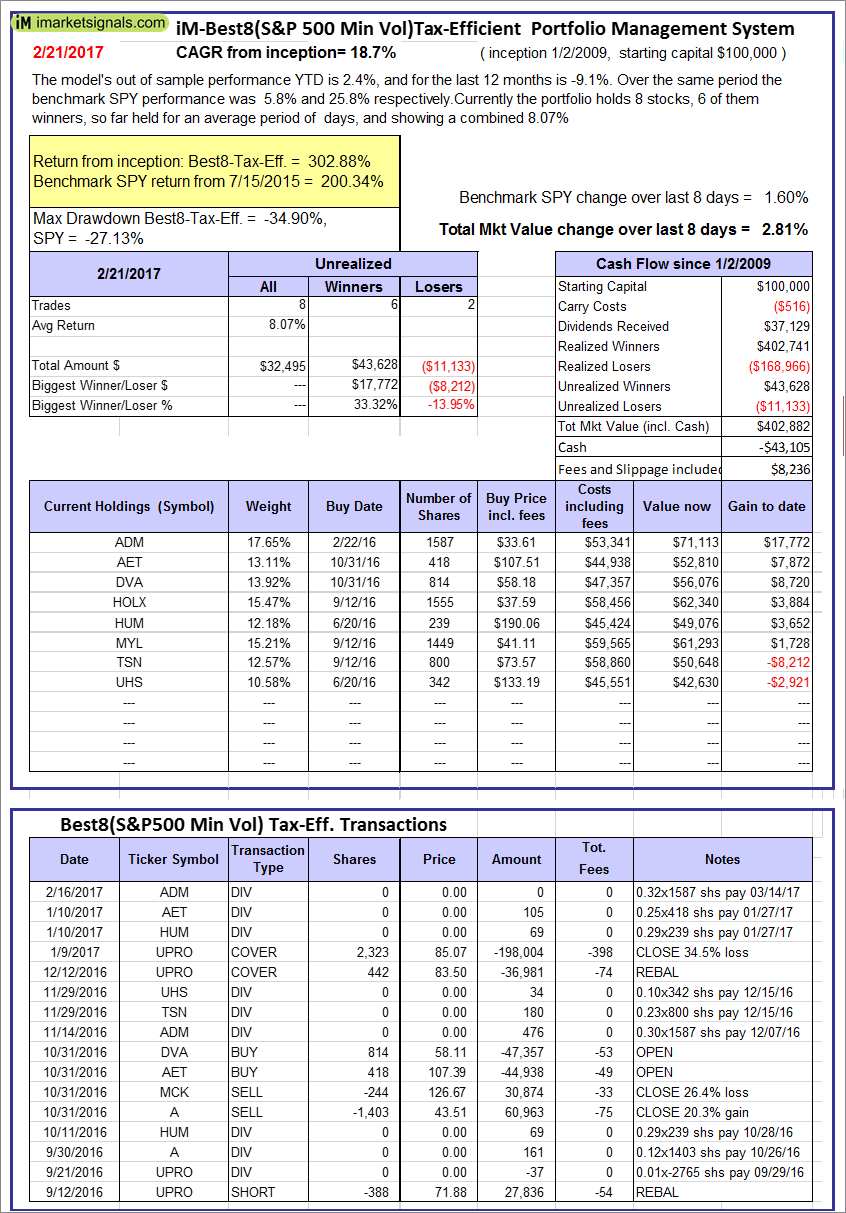 |
The iM-Best8(S&P500 Min Vol)Tax-Efficient The model’s out of sample performance YTD is 2.4%, and for the last 12 months is -9.1%. Over the same period the benchmark SPY performance was 5.8% and 25.8% respectively. Over the previous week the market value of iM-Best8(S&P 500)Tax-Eff. gained 2.81% at a time when SPY gained 1.60%. A starting capital of $100,000 at inception on 1/2/2009 would have grown to $402,882 which includes -$43,105 cash and excludes $8,236 spent on fees and slippage. |
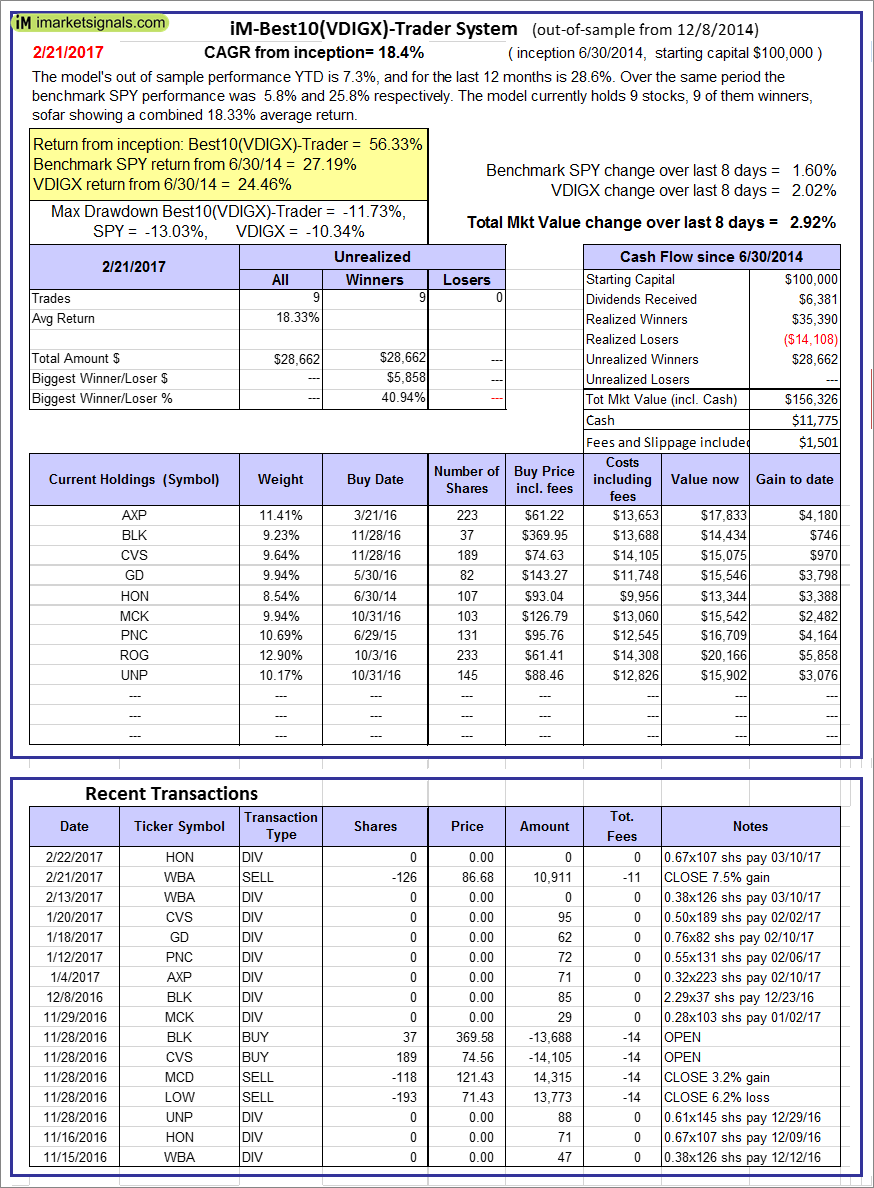 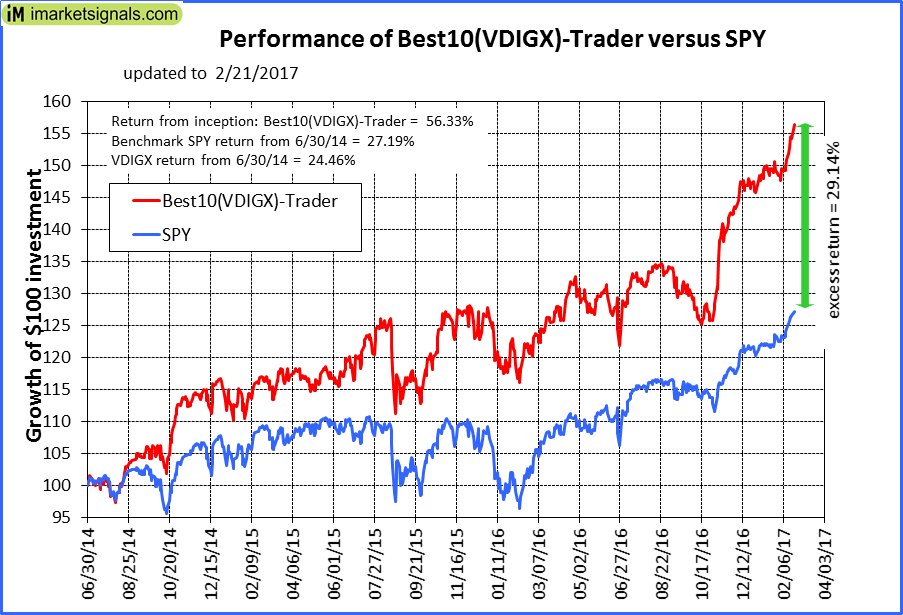 |
iM-Best10(VDIGX)-Trader: The model’s out of sample performance YTD is 7.3%, and for the last 12 months is 28.6%. Over the same period the benchmark SPY performance was 5.8% and 25.8% respectively. Since inception, on 7/1/2014, the model gained 56.33% while the benchmark SPY gained 27.19% and VDIGX gained 24.46% over the same period. Over the previous week the market value of iM-Best10(VDIGX) gained 2.92% at a time when SPY gained 1.60%. A starting capital of $100,000 at inception on 7/1/2014 would have grown to $156,326 which includes $11,775 cash and excludes $1,501 spent on fees and slippage. |
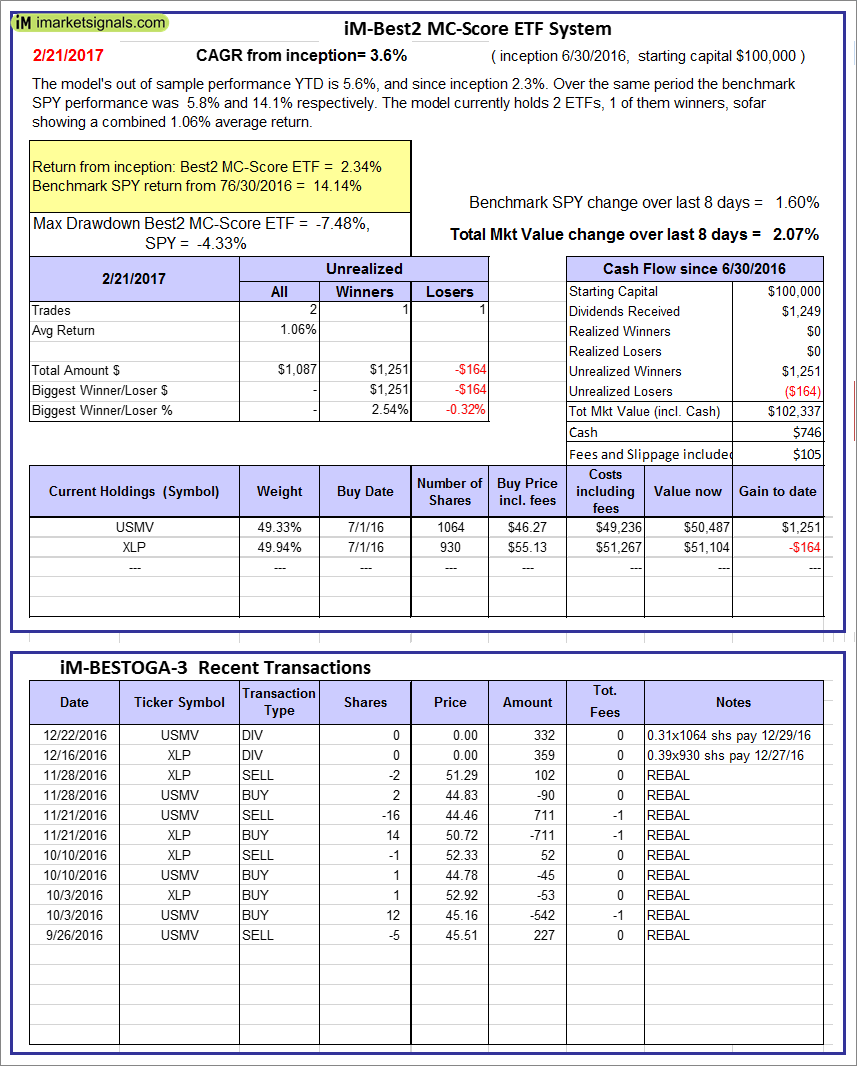 |
iM-Best2 MC-Score ETF System: The model’s out of sample performance YTD is 1.7%, and since inception -1.4%. Over the same period the benchmark SPY performance was 2.4% and 10.5% respectively. Over the previous week the market value of iM-BESTOGA-3 gained 0.55% at a time when SPY gained 0.61%. A starting capital of $100,000 at inception on 6/30/2016 would have grown to $746 which includes $105 cash and excludes Gain to date spent on fees and slippage. |
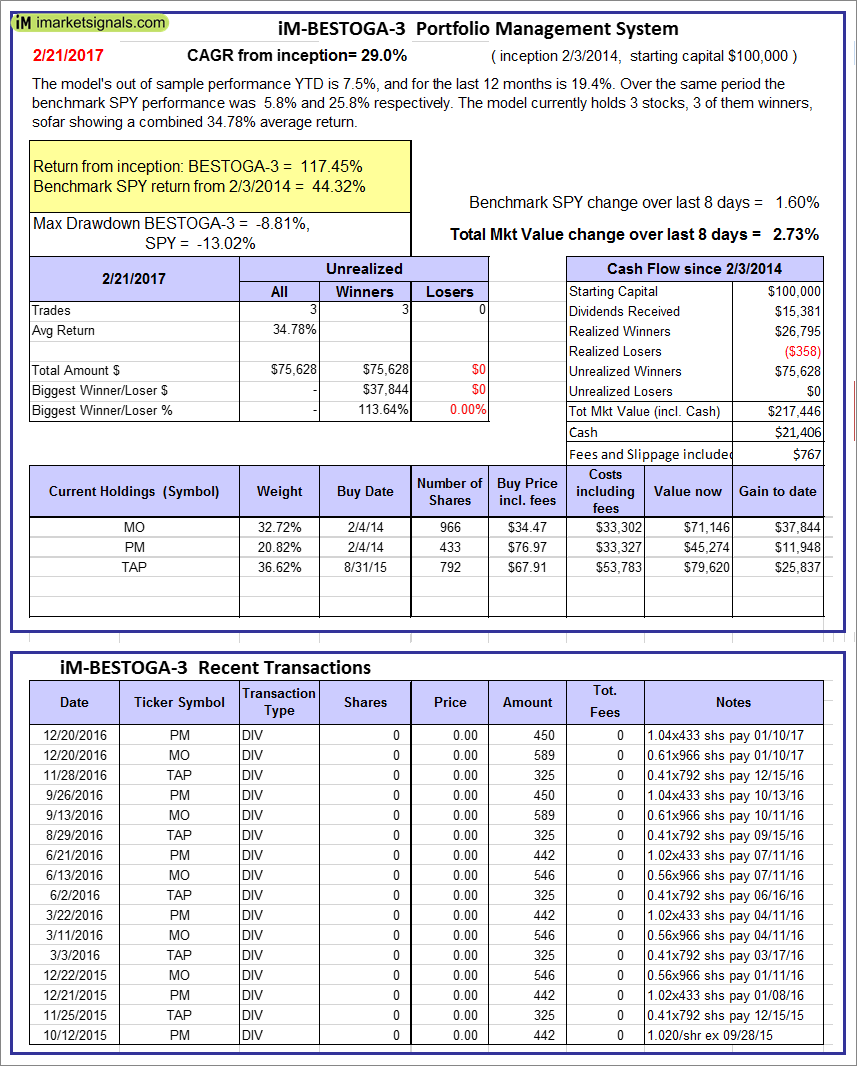 |
iM-BESTOGA-3: The model’s out of sample performance YTD is 7.5%, and for the last 12 months is 19.4%. Over the same period the benchmark SPY performance was 5.8% and 25.8% respectively. Over the previous week the market value of iM-BESTOGA-3 gained 2.73% at a time when SPY gained 1.60%. A starting capital of $100,000 at inception on 2/3/2014 would have grown to $217,446 which includes $21,406 cash and excludes $767 spent on fees and slippage. |
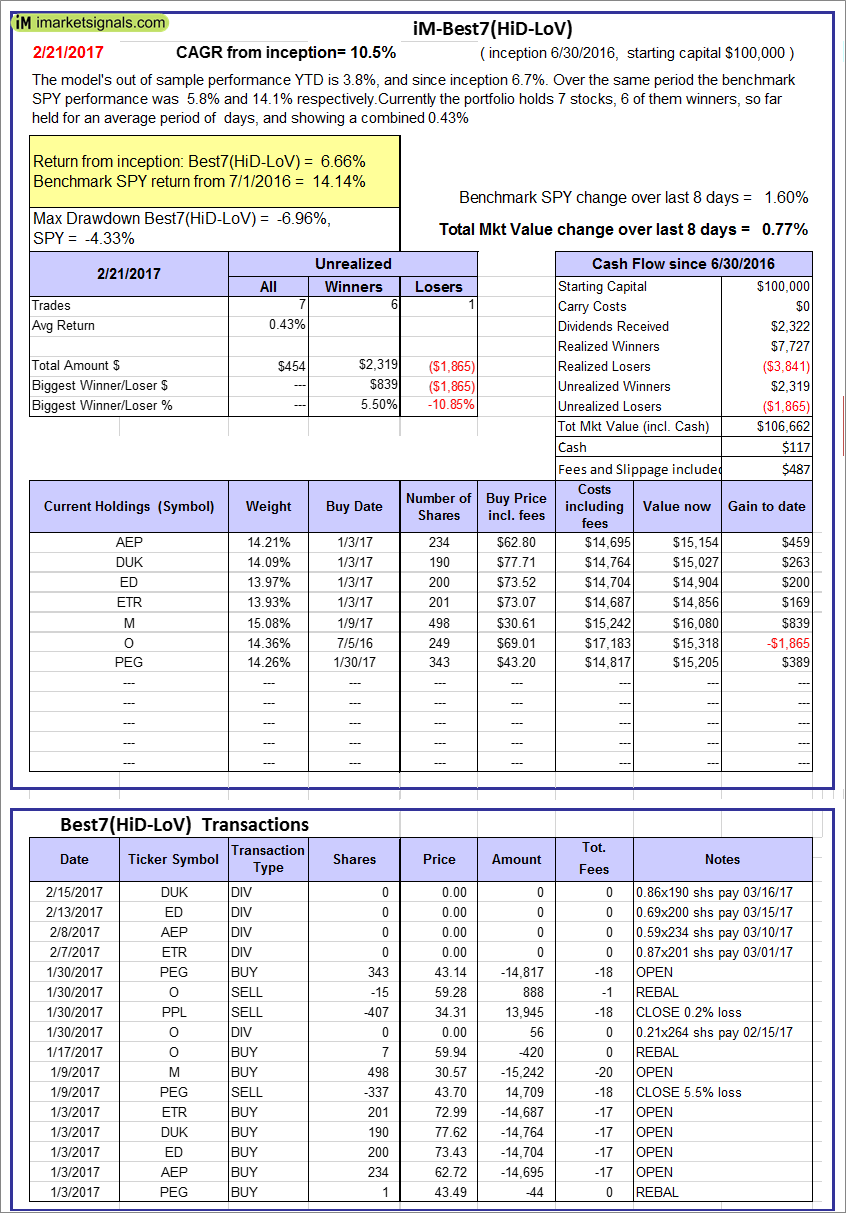 |
iM-Best7(HiD-LoV): The model’s out of sample performance YTD is 3.8%, and since inception 6.7%. Over the same period the benchmark SPY performance was 5.8% and 14.1% respectively. Over the previous week the market value of iM-BESTOGA-3 gained 0.77% at a time when SPY gained 1.60%. A starting capital of $100,000 at inception on 6/30/2016 would have grown to $106,662 which includes $117 cash and excludes $487 spent on fees and slippage. |
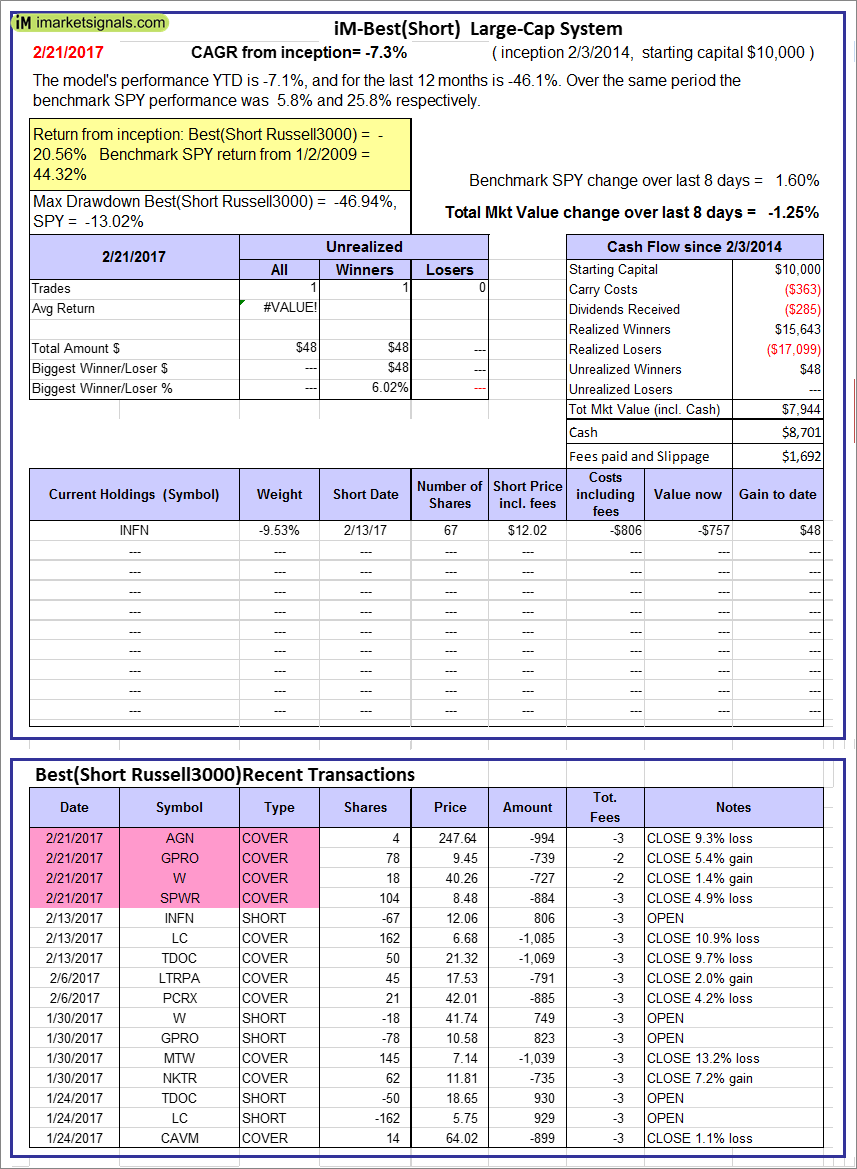 |
iM-Best10(Short Russell3000): The model’s performance YTD is -7.1%, and for the last 12 months is -46.1%. Over the same period the benchmark SPY performance was 5.8% and 25.8% respectively. Over the previous week the market value of iM-Best10(Short Russell3000) gained -1.25% at a time when SPY gained 1.60%. Over the period 2/3/2014 to 2/21/2017 the starting capital of $100,000 would have grown to $7,944 which includes $8,701 cash and excludes $1,692 spent on fees and slippage. |
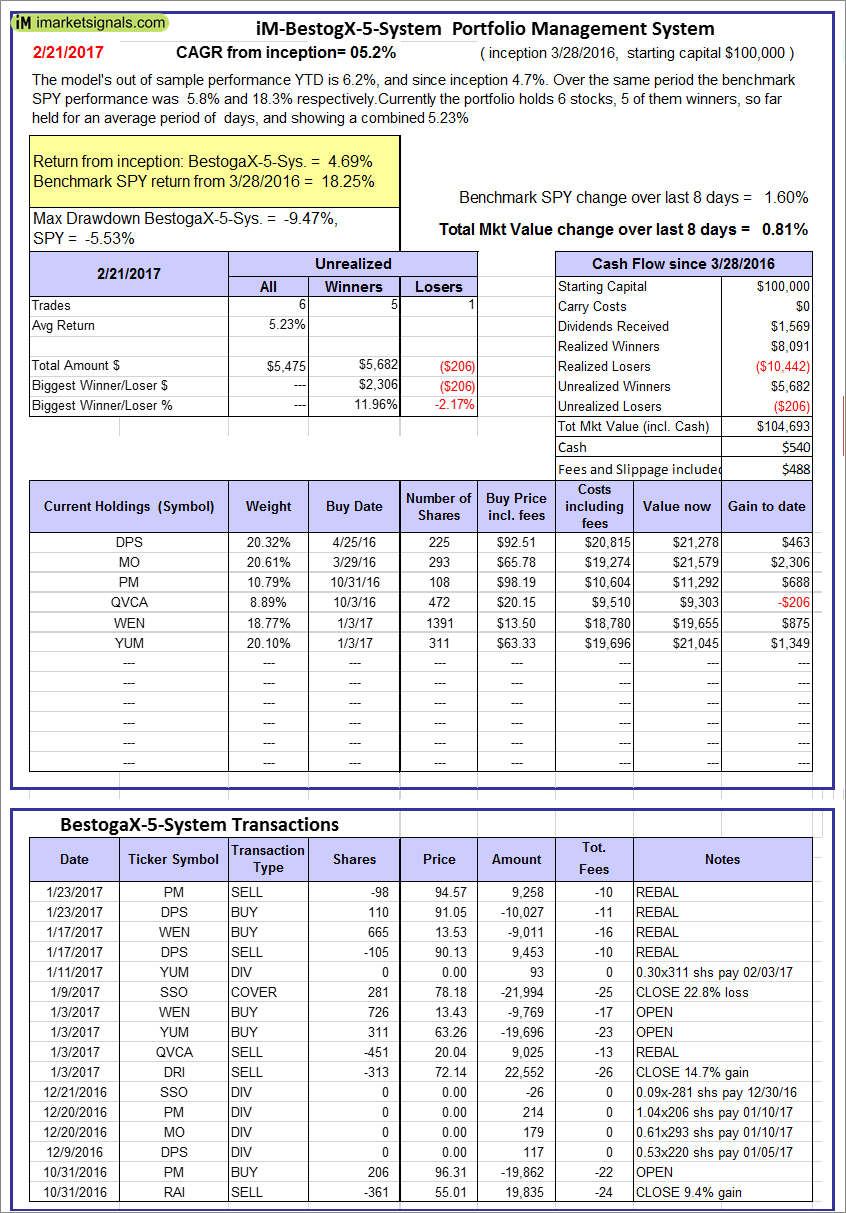 |
iM-BestogaX5-System: The model’s out of sample performance YTD is 6.2%, and since inception 4.7%. Over the same period the benchmark SPY performance was 5.8% and 18.3% respectively. Over the previous week the market value of iM-Best8(S&P 500)Tax-Eff. gained 0.81% at a time when SPY gained 1.60%. A starting capital of $100,000 at inception on 3/28/2016 would have grown to $104,693 which includes $540 cash and excludes $488 spent on fees and slippage. |
 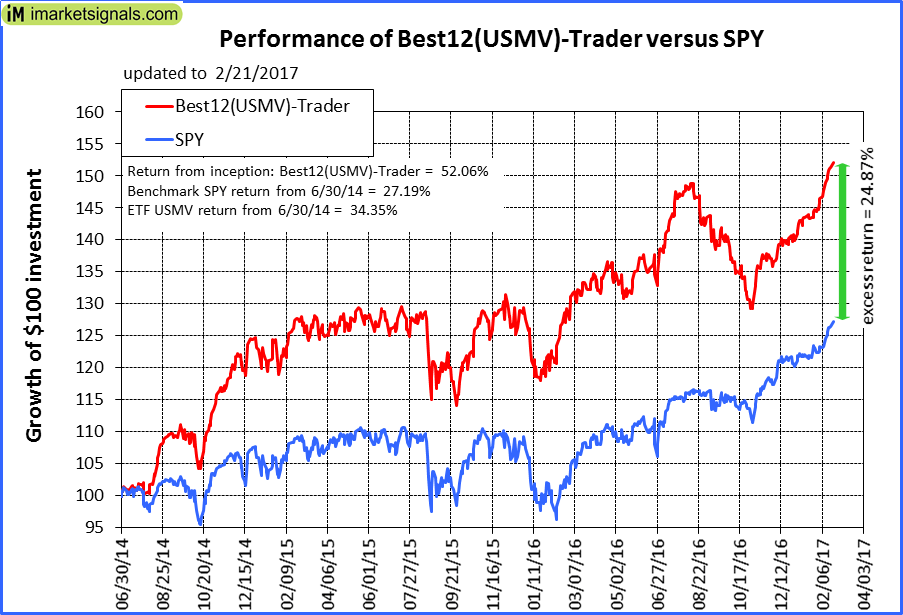 |
iM-Best12(USMV)-Trader: The model’s out of sample performance YTD is 8.7%, and for the last 12 months is 19.7%. Over the same period the benchmark SPY performance was 5.8% and 25.8% respectively. Since inception, on 7/1/2014, the model gained 52.06% while the benchmark SPY gained 27.19% and the ETF USMV gained 34.35% over the same period. Over the previous week the market value of iM-Best12(USMV)-Trader gained 1.61% at a time when SPY gained 1.60%. A starting capital of $100,000 at inception on 7/1/2014 would have grown to $152,065 which includes $197 cash and excludes $2,860 spent on fees and slippage. |
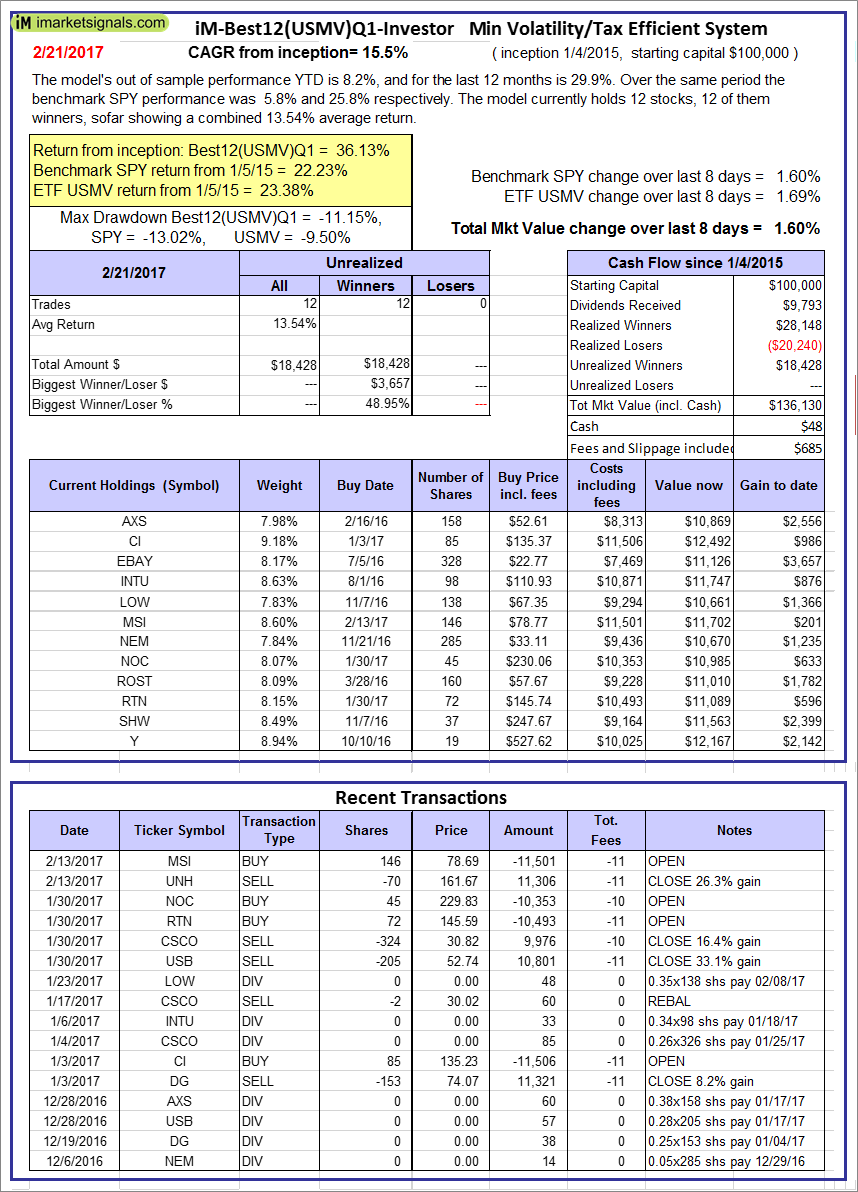 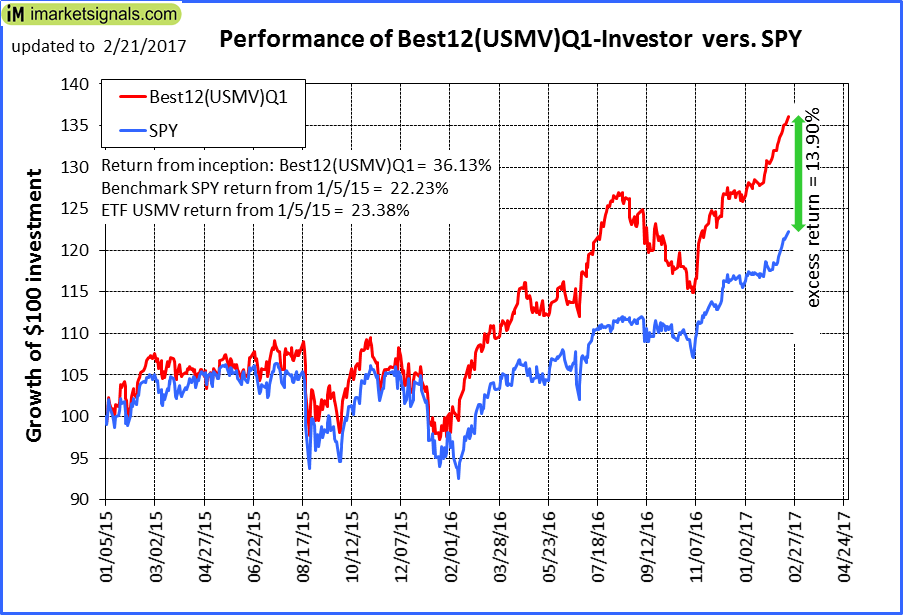 |
iM-Best12(USMV)Q1-Investor: The model’s out of sample performance YTD is 8.2%, and for the last 12 months is 29.9%. Over the same period the benchmark SPY performance was 5.8% and 25.8% respectively. Since inception, on 1/5/2015, the model gained 36.13% while the benchmark SPY gained 22.23% and the ETF USMV gained 23.38% over the same period. Over the previous week the market value of iM-Best12(USMV)Q1 gained 1.60% at a time when SPY gained 1.60%. A starting capital of $100,000 at inception on 1/5/2015 would have grown to $136,130 which includes $48 cash and excludes $685 spent on fees and slippage. |
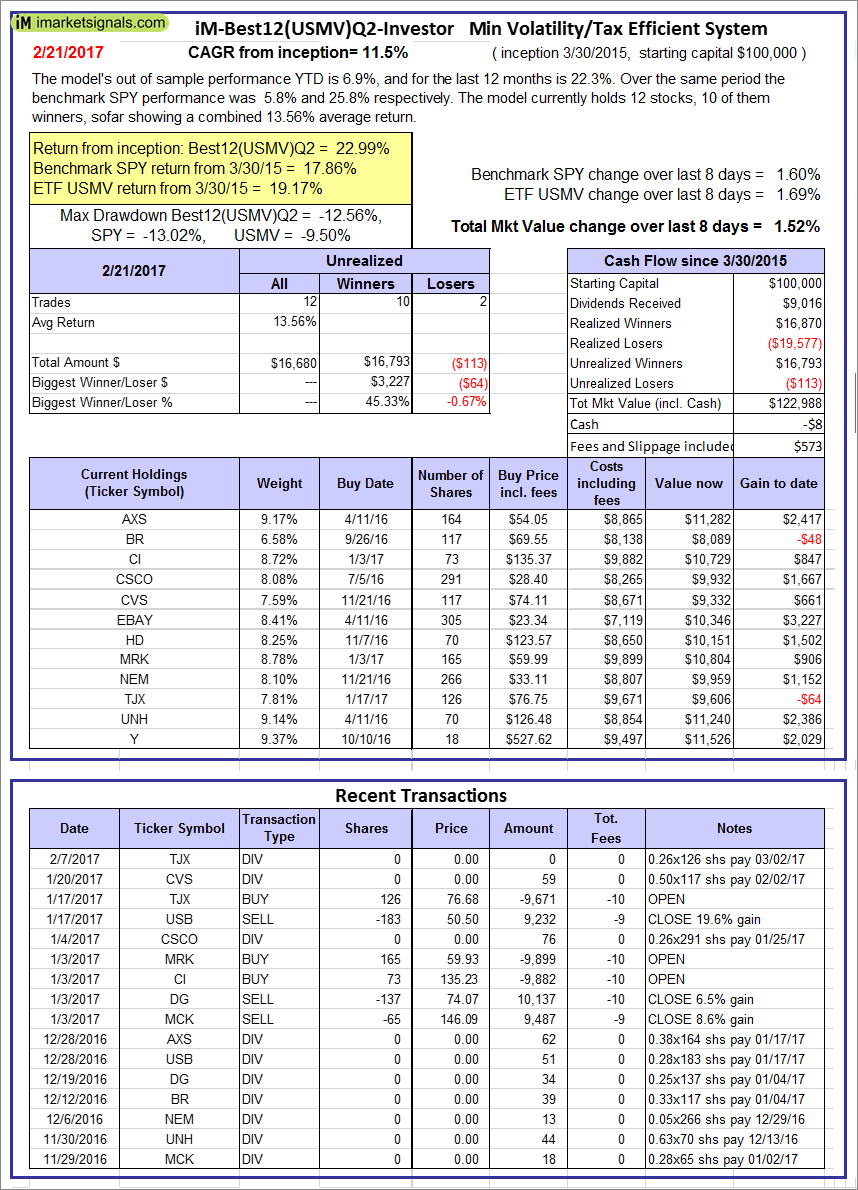 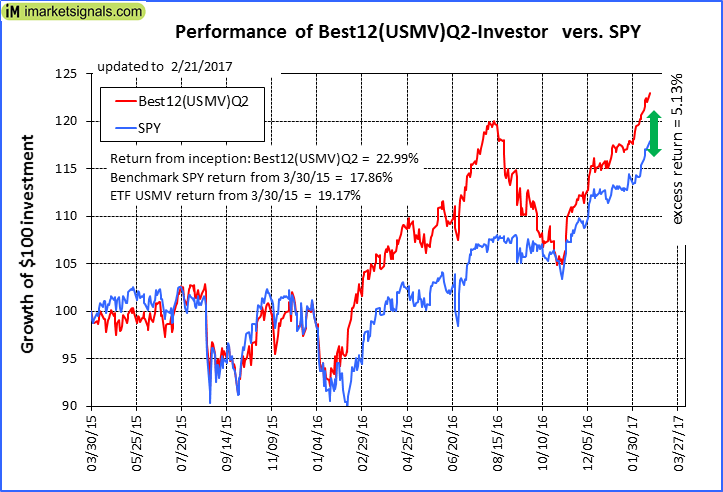 |
iM-Best12(USMV)Q2-Investor: The model’s out of sample performance YTD is 6.9%, and for the last 12 months is 22.3%. Over the same period the benchmark SPY performance was 5.8% and 25.8% respectively. Since inception, on 3/31/2015, the model gained 22.99% while the benchmark SPY gained 17.86% and the ETF USMV gained 19.17% over the same period. Over the previous week the market value of iM-Best12(USMV)Q2 gained 1.52% at a time when SPY gained 1.60%. A starting capital of $100,000 at inception on 3/31/2015 would have grown to $122,988 which includes -$8 cash and excludes $573 spent on fees and slippage. |
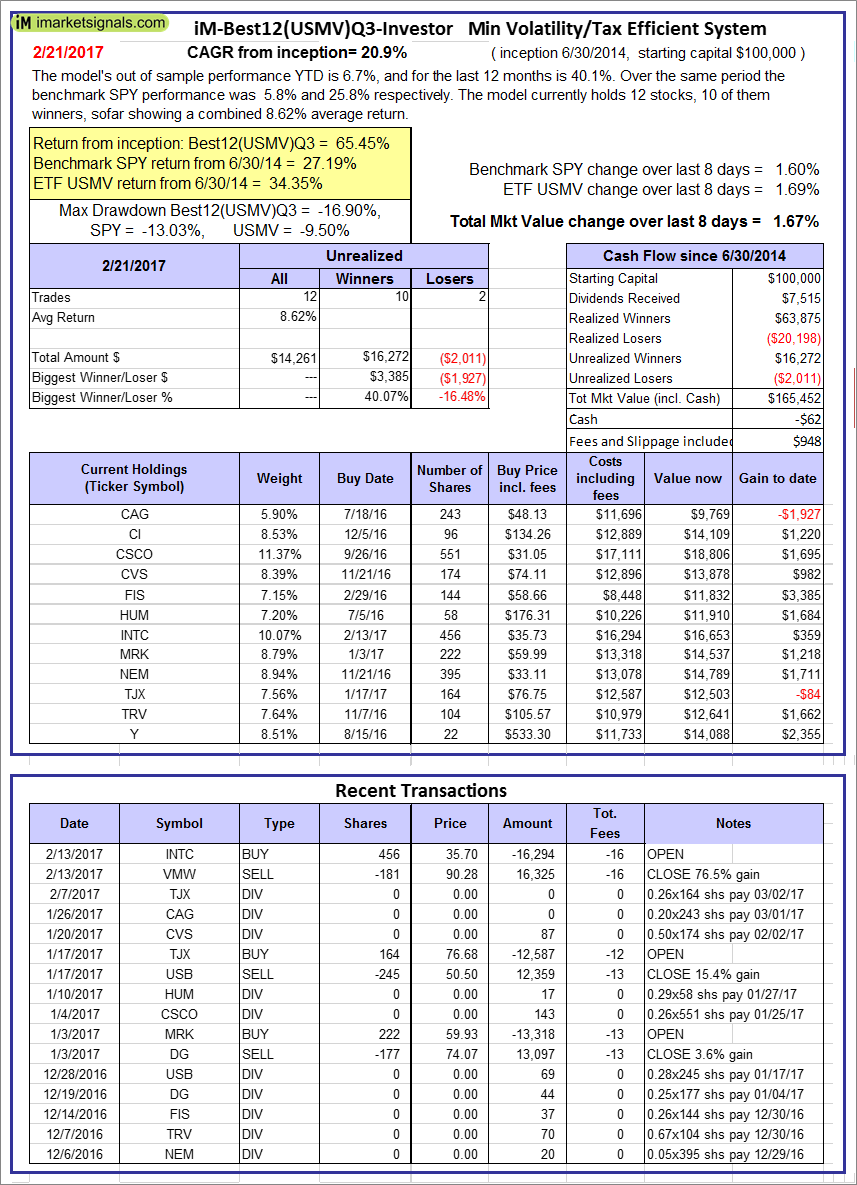 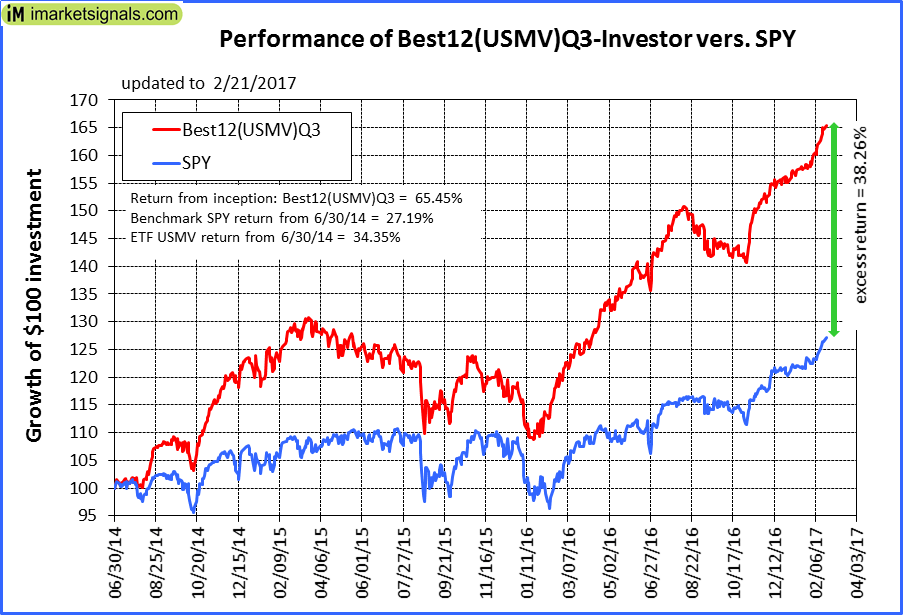 |
iM-Best12(USMV)Q3-Investor: The model’s out of sample performance YTD is 6.7%, and for the last 12 months is 40.1%. Over the same period the benchmark SPY performance was 5.8% and 25.8% respectively. Since inception, on 7/1/2014, the model gained 65.45% while the benchmark SPY gained 27.19% and the ETF USMV gained 34.35% over the same period. Over the previous week the market value of iM-Best12(USMV)Q3 gained 1.67% at a time when SPY gained 1.60%. A starting capital of $100,000 at inception on 7/1/2014 would have grown to $165,452 which includes -$62 cash and excludes $948 spent on fees and slippage. |
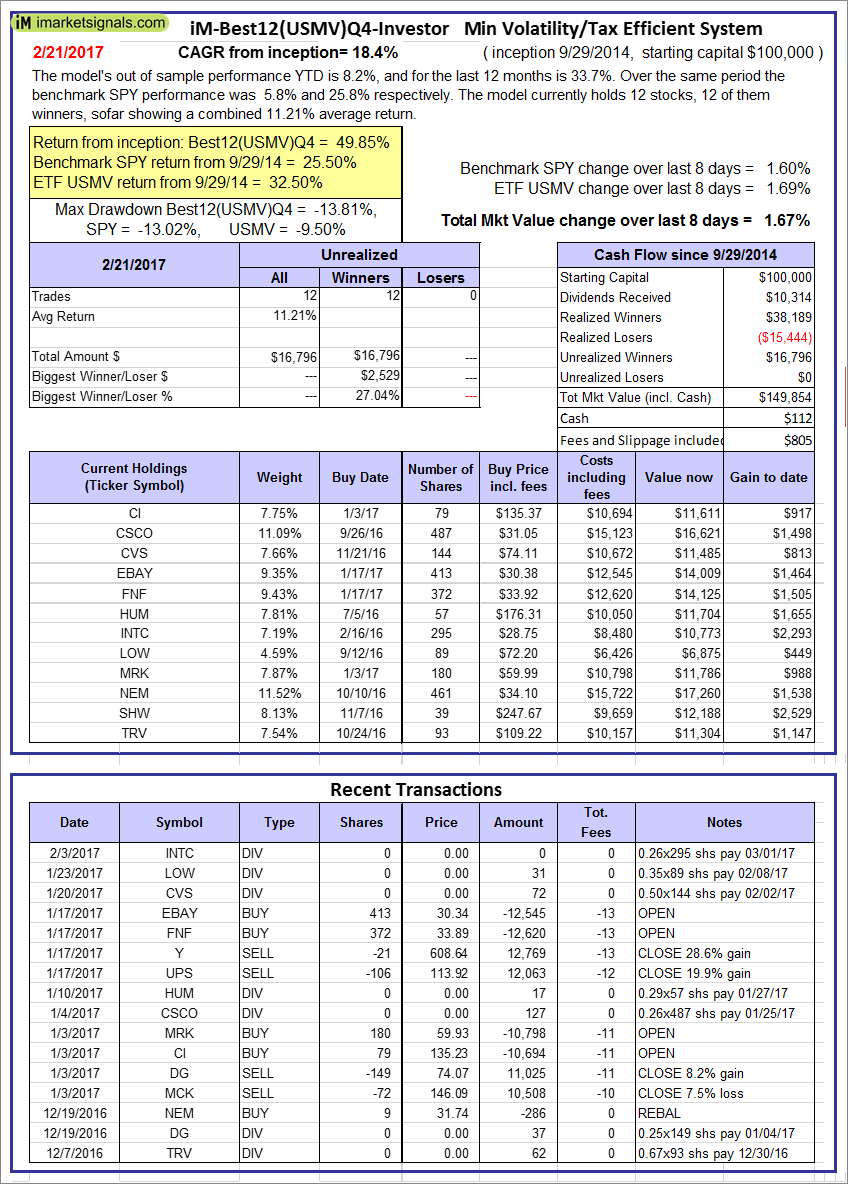 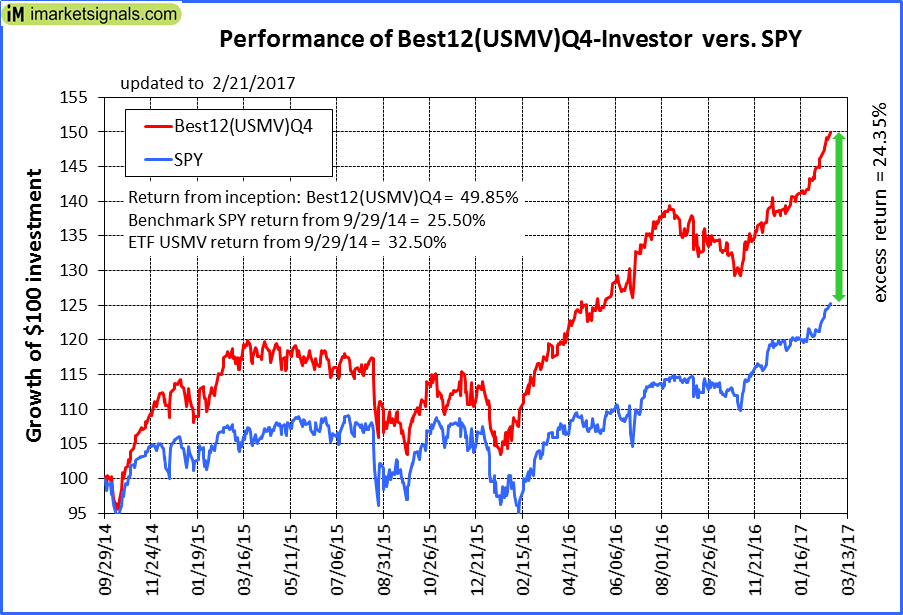 |
iM-Best12(USMV)Q4-Investor: Since inception, on 9/30/2014, the model gained 49.85% while the benchmark SPY gained 25.50% and the ETF USMV gained 32.50% over the same period. Over the previous week the market value of iM-Best12(USMV)Q4 gained 1.67% at a time when SPY gained 1.60%. A starting capital of $100,000 at inception on 9/30/2014 would have grown to $149,854 which includes $112 cash and excludes $805 spent on fees and slippage. |
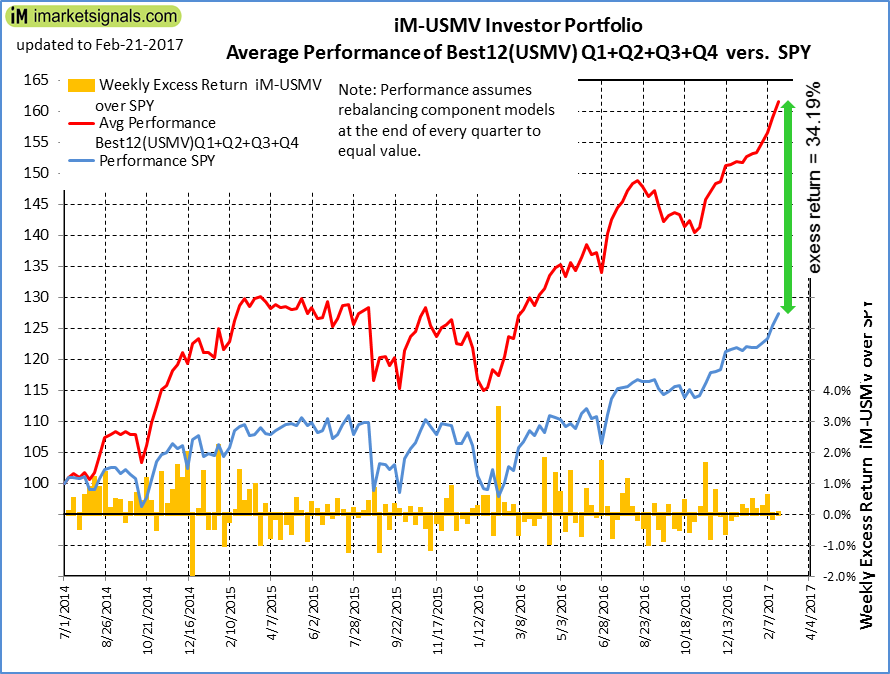 |
Average Performance of iM-Best12(USMV)Q1+Q2+Q3+Q4-Investor resulted in an excess return of 34.19% over SPY. (see iM-USMV Investor Portfolio) |
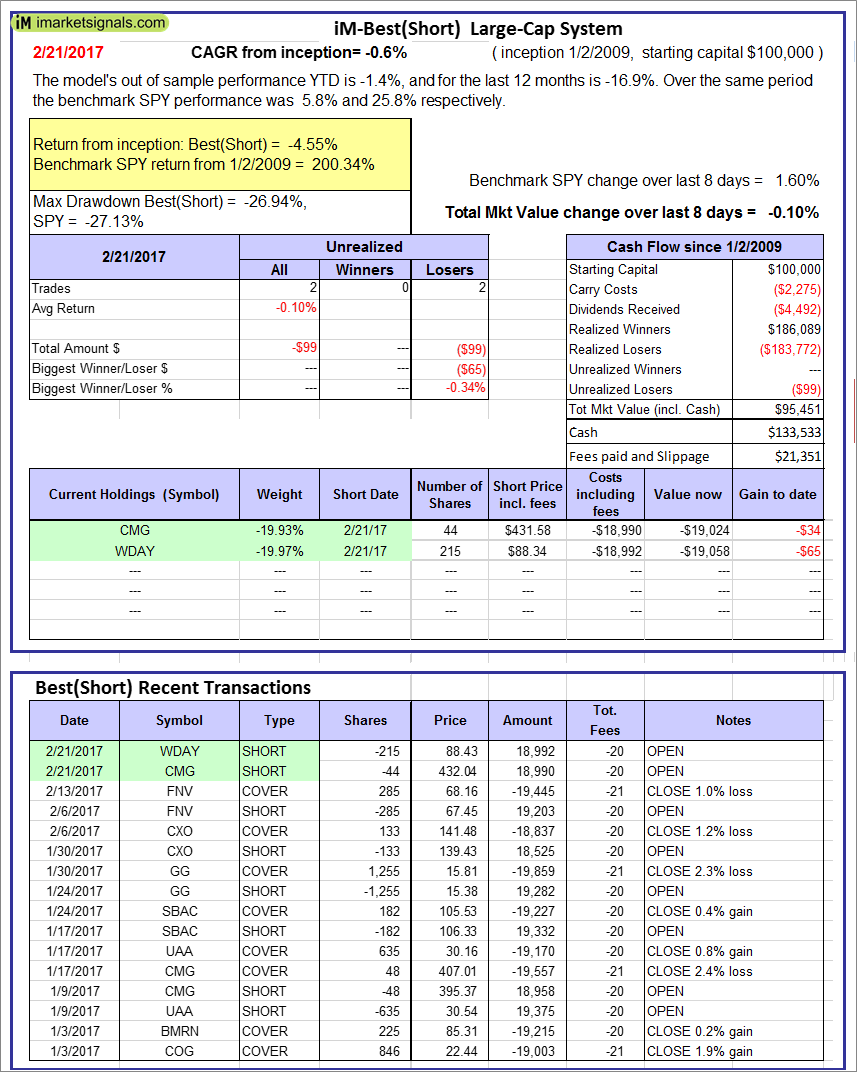 |
iM-Best(Short): The model’s out of sample performance YTD is -1.4%, and for the last 12 months is -16.9%. Over the same period the benchmark SPY performance was 5.8% and 25.8% respectively. Over the previous week the market value of iM-Best(Short) gained -0.10% at a time when SPY gained 1.60%. Over the period 1/2/2009 to 2/21/2017 the starting capital of $100,000 would have grown to $95,451 which includes $133,533 cash and excludes $21,351 spent on fees and slippage. |
iM-Best Reports – 2/21/2017
Posted in pmp SPY-SH
Leave a Reply
You must be logged in to post a comment.