
- The “Anti-VIX” ETN ZIV is designed to increase in value when the volatility of the S&P 500 decreases, as measured by the prices of VIX futures contracts.
- The model buys ZIV only during up-markets when the VIX > 17 and rising, otherwise during up-markets it buys either QLD or DDM, or IEF when upmarket conditions are absent.
- A backtest of the model from Jan-2011 to Jul-2017 produced a high 60% annualized return with a maximum drawdown of -16% with only 41realized trades.
The VelocityShares Daily Inverse VIX Medium-Term ETN (ZIV) is linked to the inverse (-1x) of the daily performance of the S&P 500 VIX Mid-Term Futures Index less fees and expenses. It has a medium-term time horizon of about 5-month.
The author of Backtesting VelocityShares’ ZIV inverse volatility ETN to 2004 was “surprised at how volatile, and how low this hypothetical ZIV went during the recent bear market—losing 80% of its value from 2007 to 2008.” He concludes that “ZIV and XIV appear to be bull market only instruments and not suitable for buy and hold.”
Our own backtest to 2007 of ProShares Short VIX Short-Term Futures (SVXY) described in Profiting from Market Volatility with the “Anti-VIX” ETF SVXY indicated that a hypothetical SVXY would have lost about 90% of its value from 2007 to 2008, with subsequent further high drawdowns of 75% in 2011, 56% in 2015, and 68% in 2016. It follows that Anti-VIX instruments should only be held during up-stock market periods and are not useable as long-term investments.
The inception date of ZIV was 11/30/2010, from which date data is available at Portfolio 123. There is no extended data for ZIV on P123 prior to inception. For QLD and DDM the inception date was 6/19/2006. The start date of the model is 1/2/2011.
Performance of ZIV
Figure-1 shows the performance of ZIV from Jan-2011 to end of Jul-2017. Buy-and-hold ZIV produced an annualized return of 29% with a -41% maximum drawdown in Oct-2011, and further large drawdowns followed; 30% in 2015, and 35% in 2016. It is evident that ZIV should only be held during up-market periods to avoid these losses.

Performance of a ZIV–Cash Model
Figure-2 shows the performance of ZIV when timed with the iM-Composite Market Timer and the VIX. The simulated annualized return from Jan-2011 to end of Jul-2017 was 32% with a maximum drawdown of -22%. Although the return is similar to buy-and-hold, the drawdowns are much better for the timed model.

This model buys ZIV only when the Composite Market Timer Score is greater or equal to 50; i.e. when up-stock market conditions prevail.
It sells ZIV
- If ZIV has lost more than 5% from a recent high after it was bought,
- or if the VIX becomes less than 17 and the 3-day moving average of the VIX is below the 20-day moving average at the same time,
- or if the 3-day moving average of the VIX becomes less than 13.5.
The model is rebalanced weekly on the first trading day of the week using closing prices, and transaction costs were assumed as 0.1% of the trade amounts to account for commission and slippage.
There were 14 periods when the model was in ZIV, about 65% of the backtest period; otherwise it was in cash.
iM VIX-Timer with ZIV – 2011
Buy- and Sell-Rules for the iM VIX-Timer with ZIV
This model’s rules include stop-loss rules for all ETPs except for IEF.
The model buys ZIV only during up-markets when the VIX is higher than 17 and rising; otherwise during up-markets when the VIX is lower than 17 it buys either QLD or DDM, or IEF when upmarket conditions are absent.
It sells ZIV when
- ZIV has lost more than 7% (not 5%) from a recent high after it was bought,
- or when the 3-day moving average of the VIX becomes less than 13.5.
It sells DDM or QLD when
- DDM or QLD have lost more than 5% from a recent high after they were bought,
- or when down-stock market conditions exist, as indicated by Composite Market Timer Score being less than 50, and when up-market conditions do not exist based on analysts’ Current Year Consensus Estimated Earnings for the S&P500 stocks.
It sells IEF when the Composite Market Timer Score is greater or equal to 50; i.e. when up-stock market conditions prevail.
Performance of the iM VIX-Timer with ZIV
Performance of the ZIV–Cash model with a 32% annualized return and a reasonable maximum drawdown of -22% is very satisfactory. However, a much higher return with much lower drawdown can be achieved by switching between ZIV, and either QLD or DDM, or IEF.
The model uses a simple ranking system which assumes trading ETPs, rather than investing for longer periods. The one factor system is based on the price changes over a short period. The idea being that ETPs which have experienced a decline over a short period will bounce back, reverting and doing better than ETPs which have not declined in this way.
Simulated performance from Jan-2011 to end of Jul-2017 is shown in Figure-3 and Table-1. The annualized return is about 60% and the maximum drawdown is a reasonable -16%. The model is rebalanced weekly on the first trading day of the week using closing prices, and transaction costs were assumed as 0.1% of the trade amounts to account for commission and slippage.
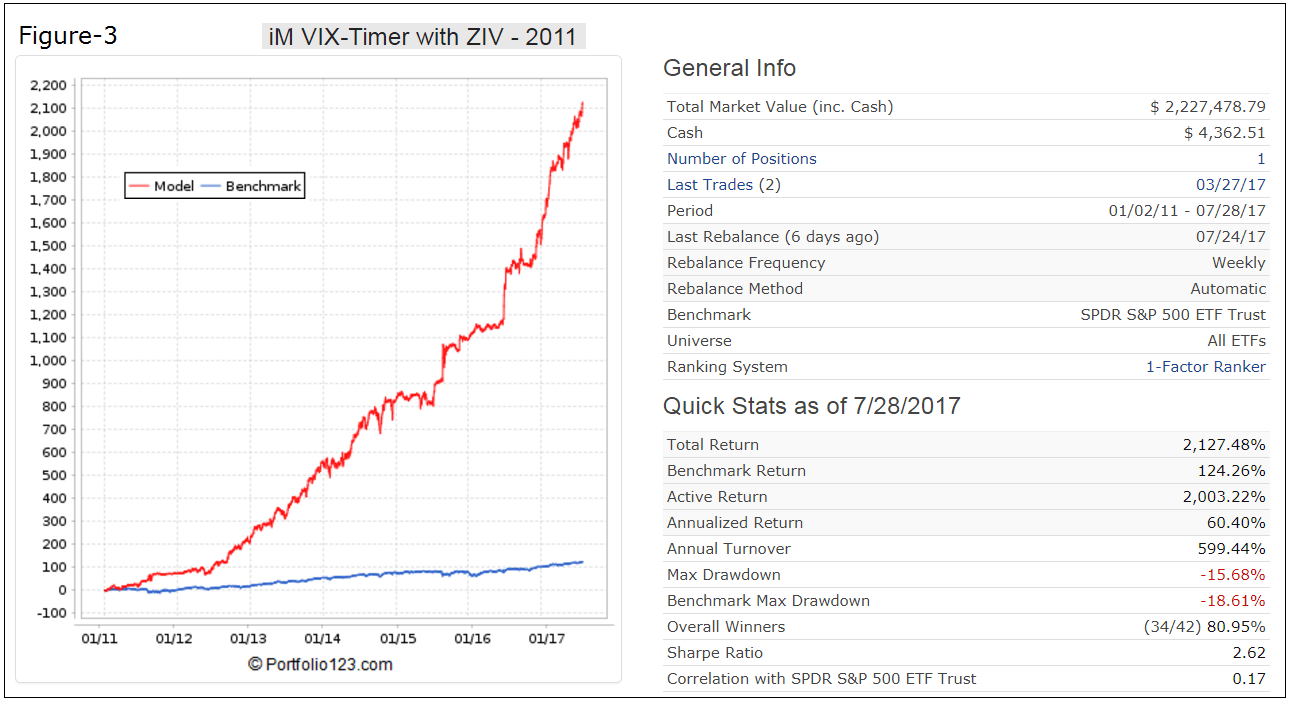

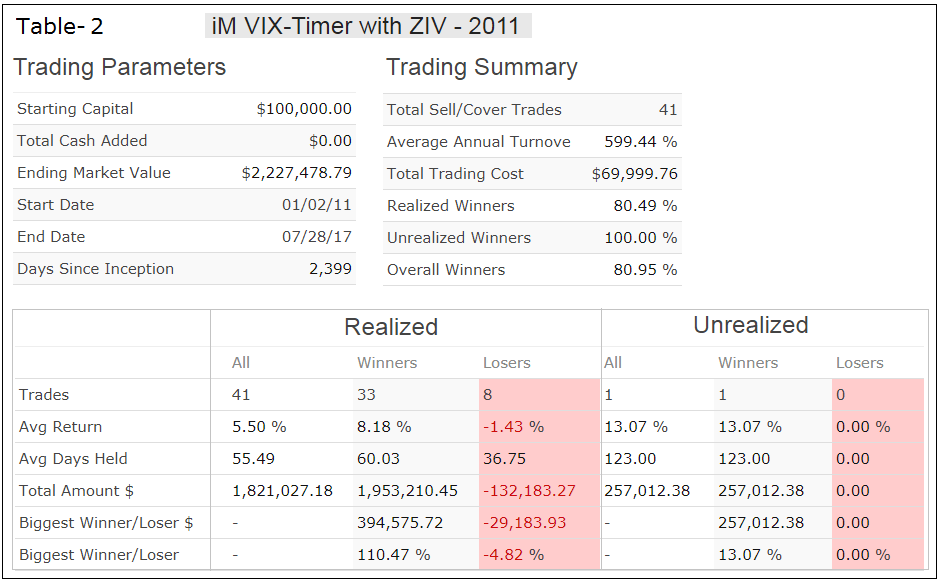
The trading summary is in Table-2. There were only 41 realized trades. The biggest loss of any trade was 4.8%, 81% of all trades were winners and the average holding period was about 55 days. The longest holding period was 33 weeks and 4 trades had the shortest holding period of one week (not shown in the table).
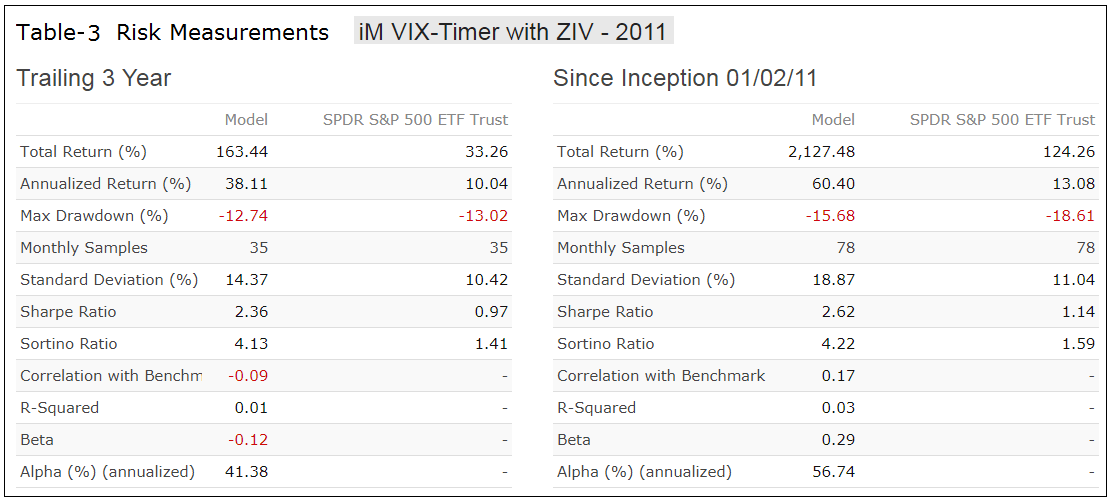
The risk measurements are in Table-3.
Following the model
At iMarketSignals we will provide weekly signals of the iM-VIX Timer with ZIV (starting before end August 2017 and a Gold subscription is required). Currently the model holds DDM, which it bought on 3/27/2017.
A similar model, the iM-VIX Timer with SVXY, can be followed by subscribing to it at Portfolio 123 when it will be opened for subscription at the beginning of Nov-2017.
Disclaimer
Note: All performance results are hypothetical and the result of backtesting over the period 2011 to 2017. No claim is made about future performance. Backtesting involves optimizing parameters by looking at past data. Even if parameter values may be optimal going forward, future returns may generally not be as high as past returns.
Hi,I am curious to know what the returns/drawdowns look like if IEF was replaced with SDS.
Thanks.
Replacing IEF with SDS produces much higher drawdown.
Period 01/01/11 – 07/31/17
Benchmark SPDR S&P 500 ETF Trust
Universe All ETFs
Quick Stats as of 7/31/2017
Total Return 2,000.70%
Benchmark Return 124.14%
Active Return 1,876.57%
Annualized Return 58.85%
Annual Turnover 635.02%
Max Drawdown -36.89%
Benchmark Max Drawdown -18.61%
Overall Winners (33/45) 73.33%
Hello Georg
Quite an original combination and cautious risk management rules. Any idea when you intend to allow subscriptions?
We should have this up by the end of August. In the meantime one can watch daily performance of the SVXY model on P123:
https://www.portfolio123.com/app/r2g/summary?id=1497772
Hi Georg,
Another fantastic system from iMarketSignals making the Gold subscription now worth even more. A big thanks. 60% CAGR with such a low max. drawdown of 16% is just fantastic.
I am trying to understand the logic and mechanics and am able to broadly understand why IEF would be an escape in down market conditions and why XIV, QLD, and DDM would be used to get juicier returns during up markets. I am struggling with the selection of ZIV though, and hoping you could help throw some light on the logic for timing of when to enter ZIV.
At the tail end of a bull market, would the VIX NOT start from low levels of under 12 and then cross above 17 first before rising to higher levels. Why would the system buy ZIV at VIX level of 17 and rising? The “and rising” part is what I am trying to understand.
Thanks again for all you do.
Regards,
RV
Basically we want to buy ZIV during up-markets only and when the VIX is rising and already quite high (>17), because any pull-back of the market is likely to be only a correction and the VIX will decline again to lower than 17.
We sell when the 3-day moving average of the VIX becomes less than 13.5.
There is also a stop-loss provision in case we were wrong and the correction is really the start of a bear-market.
You can read many comments on the sister model with SVXY which was published at Seeking Alpha.
https://seekingalpha.com/article/4095356-profiting-market-volatility-anti-vix-etf-svxy
Hi Georg,
Thanks for providing some color to this concept of buying ZIV at Vix>17 in an up market.
Can you please tell us:
1. How many times in the past 6 years ZIV got stopped out and the trade lost money and how many times ZIV made money?
2. Only for the ZIV purchase, would a modified rule do better than the existing rule of “buy ZIV when Vix>17 and rising”. The modified rule could be “Buy ZIV in an up market, when Vix has risen above 17 and now crossed below 16.99”? All the other rules for DDM, IEF as well as sell rules for ZIV will remain the same. If you could test or think about it, comment on this “modified” rule and/or guide us, that would be great.
Thanks again. Much appreciate your creativity and the great service, you folks at iMarketSignals provide.
RV
Open ……………. Close ……………. Days ……… Pct … Note
11/07/2016 …… 11/21/2016 …… 14 …… 3.00% …… sma(3,0,$VIX)<13.5
07/06/2015 ...... 07/20/2015 ...... 14 ...... 8.00% ...... sma(3,0,$VIX)<13.5
10/13/2014 ...... 11/17/2014 ...... 35 ...... 15.20% ...... sma(3,0,$VIX)<13.5
02/03/2014 ...... 03/17/2014 ...... 42 ...... 6.60% ...... Stop-Loss
06/17/2013 ...... 07/22/2013 ...... 35 ...... 8.50% ...... sma(3,0,$VIX)<13.5
06/04/2012 ...... 01/22/2013 ...... 232 ...... 110.50% ...... sma(3,0,$VIX)<13.5
04/16/2012 ...... 05/29/2012 ...... 43 ...... -4.80% ...... Stop-Loss
03/14/2011 ...... 06/20/2011 ...... 98 ...... 8.80% ...... Stop-Loss
01/03/2011 ...... 03/07/2011 ...... 63 ...... 10.20% ...... Stop-Loss
Amazing. Never would’ve guessed there was only 1 instance where the ZIV trade made a loss out of 9 trades. Even that 1 loss was very small of 4.8%.
Thanks Georg.
Hi Georg,
Would you be willing to post the remainder of the 32 trades with DDM, QLD, & IEF? On some strategies you’ve given us all the trades and it’s helpful to understand the dynamics.
I noticed that there is no negative year for this strategy from 2011 to 2017, but the max. drawdown is 15.9%. Was wondering when the max. drawdown occurred and also how the other trades did.
Thanks a bunch!
RV
Can’t do No.2.
Max D/D of about -16% occurred in 2011 and 2012
Symbol ……………. Open ……………. Close ……… Days ……… Pct
IEF …… 03/06/2017 …… 03/27/2017 …… 21 …… 0.90%
QLD …… 12/05/2016 …… 03/06/2017 …… 91 …… 25.50%
IEF …… 11/21/2016 …… 12/05/2016 …… 14 …… -0.80%
ZIV …… 11/07/2016 …… 11/21/2016 …… 14 …… 3.00%
IEF …… 09/26/2016 …… 11/07/2016 …… 42 …… -1.90%
QLD …… 09/12/2016 …… 09/26/2016 …… 14 …… 2.00%
IEF …… 09/06/2016 …… 09/12/2016 …… 6 …… -1.00%
DDM …… 08/01/2016 …… 09/06/2016 …… 36 …… 1.90%
IEF …… 07/11/2016 …… 08/01/2016 …… 21 …… -0.80%
QLD …… 06/27/2016 …… 07/11/2016 …… 14 …… 17.10%
IEF …… 11/30/2015 …… 06/27/2016 …… 210 …… 6.20%
QLD …… 11/16/2015 …… 11/30/2015 …… 14 …… 4.40%
IEF …… 09/14/2015 …… 11/16/2015 …… 63 …… -0.90%
QLD …… 08/24/2015 …… 09/14/2015 …… 21 …… 12.70%
IEF …… 07/20/2015 …… 08/24/2015 …… 35 …… 2.60%
ZIV …… 07/06/2015 …… 07/20/2015 …… 14 …… 8.00%
IEF …… 06/08/2015 …… 07/06/2015 …… 28 …… 0.60%
QLD …… 05/04/2015 …… 06/08/2015 …… 35 …… -2.30%
IEF …… 12/22/2014 …… 05/04/2015 …… 133 …… 0.10%
QLD …… 12/08/2014 …… 12/22/2014 …… 14 …… 0.20%
IEF …… 11/17/2014 …… 12/08/2014 …… 21 …… 0.20%
ZIV …… 10/13/2014 …… 11/17/2014 …… 35 …… 15.20%
DDM …… 08/04/2014 …… 10/13/2014 …… 70 …… -2.80%
QLD …… 04/07/2014 …… 08/04/2014 …… 119 …… 23.10%
ZIV …… 02/03/2014 …… 04/07/2014 …… 63 …… 9.60%
QLD …… 07/22/2013 …… 02/03/2014 …… 196 …… 26.60%
ZIV …… 06/17/2013 …… 07/22/2013 …… 35 …… 8.50%
QLD …… 04/08/2013 …… 06/17/2013 …… 70 …… 13.40%
IEF …… 04/01/2013 …… 04/08/2013 …… 7 …… 0.40%
QLD …… 01/22/2013 …… 04/01/2013 …… 69 …… 3.50%
ZIV …… 06/04/2012 …… 01/22/2013 …… 232 …… 110.50%
IEF …… 05/29/2012 …… 06/04/2012 …… 6 …… 1.30%
ZIV …… 04/16/2012 …… 05/29/2012 …… 43 …… -4.80%
DDM …… 01/30/2012 …… 04/16/2012 …… 77 …… 4.60%
IEF …… 08/29/2011 …… 01/30/2012 …… 154 …… 3.10%
QLD …… 08/08/2011 …… 08/29/2011 …… 21 …… 14.40%
IEF …… 07/05/2011 …… 08/08/2011 …… 34 …… 5.50%
QLD …… 06/20/2011 …… 07/05/2011 …… 15 …… 15.40%
ZIV …… 03/14/2011 …… 06/20/2011 …… 98 …… 8.80%
IEF …… 03/07/2011 …… 03/14/2011 …… 7 …… 1.00%
ZIV …… 01/03/2011 …… 03/07/2011 …… 63 …… 10.20%
Hello Georg! With back-testing data only available from 2011, how do you gauge the resilience of this model to recessions, the likes of the last two in 2001 and 2008, and so-called Blackswan events? And second, It would seem to me that during a recession linked bear market that holding SH instead of IEF would be more profitable. Have you or can you analyze this scenario? Thank you for your wonderful work. Jake
That is why we also published a backtest with SVXY from 2007 onward. The SVXY model switched to IEF during the 2008/9 down-market. In IEF from7/2/2007 to 3/23/2009.
Black Swan events cannot be captured by any model.
Also SH did not improve performance over IEF.
Georg,
Thanks for providing all the 41 trades. Truly an amazing and creative use of your timing models (which you folks have developed with so much hard work over the years). This model is just fantastic. The Gold subscription monthly prices should be raised by the addition of this model :-)
If the 16% Max. Drawdown occurred in 2011 then it probably occurred when the model was holding IEF, right? The amazing thing is that the max. drawdown probably occurred during a trade, because the losing trades have such small losses.
Could you please tell us, what instrument was the model holding in 2011 0r 2012 i.e., QLD or IEF when the 16% max. drawdown occurred? How long did it take for the model to recover from this drawdown? It appears it recovered very quickly, in few weeks or maybe just a couple of months at the most.
Thanks again for a superb addition to the portfolio of already great models like Combo5, iM-5 ETF Trader, etc. for Gold subscribers.
RV
Hi Georg,
Can you please share what months and year the max. drawdown of approx. 16% occurred? What was the model holding at that time? QLD, DDM, ZIV, or IEF?
Thanks
3/16/2011 holding ZIV D/D= -15.2%
5/18/2012 holding ZIV D/D= -15.7%
Hi Georg,
When will we (Gold subscribers) start getting signals for this model/strategy?
RV
Before the end of August.
That’s great news Georg. So will we get the signals in the email that comes out for subscribers starting this Sunday?
Where else on the website should one track this system?
RV
We will provide signals to Gold members starting on Sunday Aug-27 and performance updates will start the following Tuesday.
One can track daily performance of a similar model with SVXY instead of ZIV on P123:
https://www.portfolio123.com/app/r2g/summary?id=1497772
Hi Georg,
In what area of the website are performance updates for this strategy being reported? I can’t seem to find the performance updates for last Tuesday and this week.
RV
Can you please update the site with performance updates? I can’t seem to find them
On homepage click on “Model Performance Tables”.
Select first table and model is listed second from the bottom.
What are the returns and drawdown if leveraged ETFs are not used when the model is out of ZIV and in stocks? Thanks!
Using the unleveraged ETFs DIA and QQQ instead of DDM and QLD:
Period 01/02/11 – 08/21/17
Benchmark SPDR S&P 500 ETF Trust
Quick Stats as of 8/19/2017
Total Return 664.22%
Benchmark Return 120.45%
Active Return 543.77%
Annualized Return 35.91%
Annual Turnover 494.07%
Max Drawdown -15.20%
Benchmark Max Drawdown -18.61%
Overall Winners (25/35) 71.43%
Sharpe Ratio 2.20
Have performance updates for this strategy started? Where can I find them?
RV
Hi, i just would like to clarify please…
the stop-losses are built into your system, I don’t need to set them myself in my own accounts. is that correct?
thanks
Yes, they are in the sell rules.
Best trading model so far…pls explain how the two largest “draw downs” of ZIV (-15.2% and -15.7%) are possible when the stop loss rules sell when price declines by 5%…thanks.
The model only trades on the first trading day of the week and not daily. Thus a price decline of 5% could occur early in the preceding week and the model would only react to it until a few days later when it trades. By that time the decline can be a lot more.
Where or when can we find the model’s out of sample performance YTD weekly updates?
Georg – I’ve also requested this info and no one seems to be responding. Can you folks please tell us what area of the website are you posting performance of the ZIV timing model? Thanks.
Performance data is now available as of 9/26/2017.
iM-VIX Timer with ZIV:
The model’s out of sample performance YTD is 42.4%, and since inception 42.4%. Over the same period the benchmark SPY performance was 12.9% and 12.9% respectively. Over the previous week the market value of the iM-VIX Timer with ZIV gained -0.40% at a time when SPY gained -0.32%. A starting capital of $100,000 at inception on 12/30/2016 would have grown to $142,412 which includes $293 cash and excludes $578 spent on fees and slippage.
What would be an optimum combo of Anti Vix Ziv & 5ETF models? Could you provide a percentage split between the two models that provided the optimal risk-return profile? And then provide the performance numbers for that combo? Thank you.
50:50 combo of Anti Vix Ziv & 5ETF models.
Period 12/29/06 – 09/18/17
Benchmark SPDR S&P 500 ETF Trust
Quick Stats as of 9/18/2017
Total Return 7,278.34%
Benchmark Return 120.22%
Active Return 7,158.12%
Annualized Return 49.36%
Max Drawdown -14.17%
Benchmark Max Drawdown -55.19%
Sharpe Ratio 2.69
Sortino Ratio 4.24
Correlation with SPDR S&P 500 ETF Trust 0.32
Hi Georg and Anton, could you run the updated performance numbers on this 50:50 combo of Anti Vix w/ Ziv & 5-ETF models please? Interested to see how it performed overall with February and March of this year included in the numbers. Trying to calculate the optimal margin/leverage that could be safely used with this combo of strategies, so in addition to CAGR, I’d be looking at STD, Sharpe, Sortino, and max D-D. Thanks in advance!
Period 12/29/06 – 07/25/18
Last Rebalanced (Every Week) 07/23/18
Benchmark S&P 500 (SPY)
Quick Stats as of 7/25/2018
Total Return 6,148.83%
Benchmark Return 153.89%
Active Return 5,994.94%
Annualized Return 42.96%
Max Drawdown -14.96%
Benchmark Max Drawdown -55.19%
Sharpe Ratio 2.65
Correlation with S&P 500 (SPY) 0.35
Standard Deviation since Inception (%) 13.57
Sortino Ratio since Inception 4.23
Very good, thank you!
Hi Georg,
It’s pretty clear when the model invests in ZIV or IEF.
How does the model decide when to invest in DDM vs. QLD?
For example, currently why is this model invested in DDM and NOT QLD?
Thanks
The model uses a ranking system: 1-Factor Ranker.
The ranking system’s approach assumes trading ETFs, rather than investing for longer periods.
The one factor system is based on the price changes over a short period. The idea being that ETFs which have experienced a decline over a short period will bounce back, reverting and doing better than ETFs which have not declined in this way.
Georg –
Thanks for explaining the 1-factor ranking for ETFs.
I also have a question about the 5% pullback exit trigger rule.
If the selection ETF (currently DDM) falls 5% from its peak within a week, then would we exit at the end of the week even if it recovers fully during the week? Or is the 5% based on closing the week down at least 5%?
Thanks
Georg
In you post of Aug 9th the following trades are listed:
QLD …… 06/27/2016 …… 07/11/2016 …… 14 …… 17.10%
QLD …… 08/24/2015 …… 09/14/2015 …… 21 …… 12.70%
In both cases the VIX was well above 17 on the trades’ start dates. Should those trades not have been with ZIV instead of QLD?
Chris
The model buys ZIV only during up-markets when the VIX is higher than 17 and rising.
The model takes its data from Friday’s closing prices, 3 days before the buy dates. The Up-market conditions may not have been met on those dates. Also the ranking system comes into play to decide what to buy.
Georg,
What would the results look like for CAGR and DD if you used the same rules, but used XIV in place of ZIV?
Tom C
That would be similar to the SVXY model.
https://imarketsignals.com/2017/im-vix-timer-with-svxy/
Hi, you wrote this in the comment section on your seeking alpha article;
“OK, so lets see how this model performs with RSP or SPY instead of SVXY, and the unleveraged ETFs DIA or QQQ instead of DDM and QLD. The annualized return would have been 24% with a max D/D of -12.5%. Total return was about 8x that of SPY, and Alpha (annualized) =21.68%. For the model, as presented, Alpha =65.43%. That is a lot more Alpha coming from the leverage and SVXY.
Period 01/02/07 – 07/31/17
Benchmark SPDR S&P 500 ETF Trust
Quick Stats as of 7/31/2017
Total Return 890.74%
Benchmark Return 116.55%
Active Return 774.19%
Annualized Return 24.21%
Annual Turnover 507.13%
Max Drawdown -12.54%
Benchmark Max Drawdown -55.19%
Overall Winners (40/56) 71.43%
Sharpe Ratio 1.99”
Is there anyway you can backtest it further using SPY instead of ZIV/UVXY and QQQ/DIA instead of the leveraged ETFs? 24% return with 12 % drawdown is ntohing to sneeze at; would like to know how the model did during the dot com bear market as well. Thanks
iM VIX Timer with [SPY | (DIA|QQQ)] | IEF
From Jan-2000:
Benchmark S&P 500 (SPY)
Quick Stats as of 10/29/2017
Total Return 2,608.84%
Benchmark Return 144.59%
Active Return 2,464.25%
Annualized Return 20.33%
Annual Turnover 607.89%
Max Drawdown -13.60%
Benchmark Max Drawdown -55.19%
Overall Winners (72/110) 65.45%
Sharpe Ratio 1.64
Correlation with S&P 500 (SPY) 0.22
Georg –
Thanks for explaining the 1-factor ranking for ETFs. This is a fab system. I need your help in understanding this system in further detail.
In that context, I have a question about the 5% pullback exit trigger rule.
If the selection ETF (currently DDM) falls 5% from its peak intra-week, then would the system exit at the end of the week, even if it recovers fully by the end of the week? Or is the 5% based on closing weekly prices for ETFs? In other words, DDM would have to close down at least 5%?
Thanks for all you do for us, the subscribers.
The system checks the percentage difference from highest closing price on any day since the position was started to the closing price on the last day of a week (usually Friday). If the percentage is smaller than the one specified then the position gets sold on the first trading day after Friday.
Georg –
I am looking around the web, can you tell me where I could find “analysts’ Current Year Consensus Estimated Earnings for the S&P500 stocks?” I am looking back at your past trades on this system trying to understand it all. Thanks!
Current Year Consensus Estimated Earnings for the S&P500 stocks comes from Portfolio 123, and they get the data from Compustat.
Hey Georg and Anton
I read in several places that ZIV has the potential to become almost worthless during a BlackSwan type of event…..hmmm. Any thought on this? Do. you suggest always keeping a stop loss under ZIV?
Thanks
Jimmy V
From model description:
This model’s rules include stop-loss rules for all ETPs except for IEF.
It sells ZIV when
ZIV has lost more than 5% from a recent high after it was bought,
or when the 3-day moving average of the VIX becomes less than 13.5.
Hi Georg
Thank you….my concern really is whether a 5% trailing stop loss would even trigger during a disasterous BlackSwan day. There’s the potential to ride ZIV down 50-90% on that day, maybe. Any thought on how to mitigate this? Grrrreat strategy!
Vman
This is from Vance Harwood, Six Figure Investing: Going short on VIX.
https://sixfigureinvesting.com/2010/04/going-short-on-vix/?utm_source=SFI&utm_medium=sidebar&utm_content=shortVIX
“Buy VelocityShares’ ZIV inverse medium-term volatility. This product follows general volatility trends, but doesn’t have the neck snapping moves of the short-term based products. You definitely still want to exit if the market volatility starts climbing, but you have more time to react.”
Looks as though a “SELL” on DDM has been triggered? VIX > 17 so I’m guessing the model will switch to “BUY” ZIV…
We will see on Sunday what the model does.
Can you help me understand why the model did not switch out of DDM? It lost over 5% last Friday alone, and has lost more than 8% off its peak on January 26th. The model rules listed above clearly state, “It sells DDM or QLD when
DDM or QLD have lost more than 5% from a recent high after they were bought…” Is there some other criteria feeding into the model not stated in the trading rules?
From the model description:
“The model uses a simple ranking system which assumes trading ETPs, rather than investing for longer periods. The one factor system is based on the price changes over a short period. The idea being that ETPs which have experienced a decline over a short period will bounce back, reverting and doing better than ETPs which have not declined in this way.”
“The model buys ZIV only during up-markets when the VIX is higher than 17 and rising.”
The model cannot yet buy ZIV because the rising trend has not yet been established. Perhaps, next week if the VIX remains above 17, or goes higher, it will buy ZIV.
Current conditions are such that it sells DDM and buys it back simultaneously, because it is the highest ranked ETF, and up-market conditions prevail.
dear gerorg, very interesting system, I read the above, so today the system sells the DDM, and buy it again, this being a new trade should be closed the old, to get the reference price on the new one and relative performance ..
No, we described the internal workings of Portfolio123, which in this case results in a no-trade. The previous history and peak still applies.
For example, today I follow the purchase signal DDM, the trade closes at a loss, but in the historical will result in gain because the historical and performance has been maintained since March 2017; this is not correct when I read the history in the system and evaluate the real single trade .. regards
Simone Tarroni
Trading on ZIV and other inverse VIX derivatives were halted after HEAVY losses. XIV is being liquidated after losing 92%+. I am wondering how you view this model’s future in light of these extreme, almost “black swan” type events the past couple of days. I realize the model was not invested in ZIV at the time, but it easily could have been if last week had played out differently.
Any comments or analyses of this situation and how it might affect the model’s efficacy moving forward would be very helpful to me as I continue to struggle with understanding this fascinating model.
ZIV is far less risky than XIV and a 450% spike in the VIX would be be necessary for ZIV to drop 80% according to this article:
https://seekingalpha.com/article/4143859-xiv-predict-either
There is a good discussion in the comment section of it.
Our model will continue as is moving forward. Even if the model had held ZIV (which it did not) the one day loss of ZIV was not catastrophic.
I agree, based on my own assessment. Thank you for confirming!
Hey Geovrba,
Fidelity announced that the would no longer allow customers to buy ZIV. Do you have an alternative if one wants to follow the model at Fidelity?
Thanks
Rand
You can buy ZIV at Interactive Brokers.
I can still buy ZIV in my Fidelity account. Just checked today. I can’t buy SVXY.
when you sell ddm and when you buy qld? at the opening or closing of the market? Regards
From the model description:
“The model is rebalanced weekly on the first trading day of the week using closing prices, and transaction costs were assumed as 0.1% of the trade amounts to account for commission and slippage.”
Georg,
From a correlation perspective, what other system is a good fit to combine with the iM VIX timer?
Thanks, BJMills
iM VIX-Timer with ZIV… Correlation
iM Tax Efficient Capital Strength Portfolio… 0.35
Comp Mkt Timer (GLD or VTV or BIV) min 6-week holding period… 0.39
iM-Composite(SH-RSP) Timer with Standard & Composite Timer rules… 0.38
iM-BESTOGA3… 0.33
Best7(HiD-LoV)… 0.37
Georg, are you considering creating a model that is long volatility? I think making such a model is very compelling idea given the work that has been done by Nassim Taleb. Maybe you can make a Standard Timer like model except you are buying UVXY.
Hello, just following up. Do you thing going long volatility (buying VIXY or UVXY) during Standard Timer “Hedge On” periods is a good strategy?
We have not tested this strategy, and in any case we are unable to give investment advice as we are not financial advisers. Also those ETFs have only been available since 2011.
Georg and Anton. Once again the signals produced by this system evade my understanding. The model just switched to IEF. I understand why ZIV was sold, but why IEF bought? Your Comp Market Timer is at 75, not below 50. The rules state to buy IEF the Comp Market Timer must be below 50 AND when up-market conditions do not exist based on analysts’ Current Year Consensus Estimated Earnings for the S&P500 stocks.
Where is the disconnect? Any help understanding this current trade is appreciated.
I was hoping that by me writing my question below wouldn’t make your question “lost”. Did you get reply in private by chance? I was looking for the answer myself.
Ty RJJ. Cheers!
The buy rules stated in the model description are:
The model buys ZIV only during up-markets when the VIX is higher than 17 and rising; otherwise during up-markets when the VIX is lower than 17 it buys either QLD or DDM, or IEF when upmarket conditions are absent.
Upmarket conditions for this model are not only defined by the Composite Market Timer score >=50.
Curios to know why the model did not exit ZIV the prior two Mondays when it qualified for rule #2 to sell ZIV when “VIX becomes less than 17 and the 3-day moving average of the VIX is below the 20-day moving average at the same time.
You’re reading the rule from the ZIV-cash model. Read down the next section for the rules for the VIX Time with ZIV, “It sells ZIV when
ZIV has lost more than 5% from a recent high after it was bought,
or when the 3-day moving average of the VIX becomes less than 13.5.”
Thank You.
What would be the results if the signal was generated semi-weekly? For instance you have the imposed signal on Sunday for the Monday open, but then add another signal, lets say after the Wed close for Thurs open.
Thanks for your great work!
This model runs on the P123 platform which uses the end of week information to provide trading signals for the following 1st trading day of the week. There is no way to get two trading signals per week.
Ok Thanks. Would it be possible to show profit/loss percentage in a monthly breakdown for 2018? (including May)
Thanks
Dear Georg,
“It sells DDM or QLD when
DDM or QLD have lost more than 5% from a recent high after they were bought”
qld closed friday at 86,4..the recent high was at 92,5..qld have lost more than 5% but not signal today?! I dont understand why..
Regards
The market climate and the VIX were such that it would sell, but simply buy back QLD immediately after selling. So it just held instead.
Hi Georg and Anton
I 2nd the request from Giallini as I’m leaning heavily on this strategy and need to both understand and trust it.
*Seems QLD’s high was on June 20 (Wednesday) at $93.29.
*On the following Monday, June 25 it fell below it’s ‘sell if 5% off it’s high’ rule; $88.62 (I sold at a slightly lower price that day) – but it pulled back up and closed at $90.32 that Friday, which iMarket uses for it’s signal so no sell mandate from iMarket to sell on Monday.
*However it closed last Friday at $86.46 which is 7.3% off it’s recent high since being bought – and should have trigger a ‘sell QLD’ from iMarket according to their rules………?
Or am I mistaken….Thank you for the clarification.
Jimmy V
Georg / Anton
May I have your thoughts on my comment/question immediately above…Important.
Thank you
Man
This model uses closing prices and allows immediate buy-back when buy rules would pick the same ETF again at the same time that it gets sold. That is why QLD was not sold.
Any idea what the performance of this strategy was further back than 2011? Thanks
Inception of ETF (ZIV) was 11/30/2010. So that is the earliest date from which one can run a backtest.
Thanks, what happens to the model if you replace ZIV with SSO or SPXL? I saw a comment on Portfolio where you replaced SVXY with SSO, and the results were pretty promising back to 2007. Just wondering whether the same holds for replacing ZIV with SSO, and also whether those results are helped with more leverage from SPXL. Appreciate any insights…
While weekly updates make sense for most all your models, which have a longer term outlook, this one makes dramatic changes in investment in the midst of high market volatility. (Such as perhaps now.) I’m wondering if you have investigated whether this particular model might perform better with a daily evaluation and possible mid-week alert in comparison to the weekly notice on the weekend that is now provided? A lot can happen in the market in a week.
This model does worse with daily rebalancing.
Period 01/01/07 – 10/11/18
Benchmark S&P 500 (SPY)
Quick Stats as of 10/11/2018
Total Return 2,078.60%
Benchmark Return 144.40%
Active Return 1,934.19%
Annualized Return 29.91%
Annual Turnover 958.26%
Max Drawdown -31.02%
Benchmark Max Drawdown -55.19%
Overall Winners (67/117) 57.26%
Sharpe Ratio 1.38
Hello
I ask myself the same question, I subscribe to the system. and I wonder if we put a stoploss at -5% on QLD as it is marked in the strategy. The result is better in time.
Best regards
richard
With a trailing stop of 5% below peak value since position was opened the model would have sold QLD on 10/8/2018 and would be not be in any position until the next rebalance date.
The simulation returns for this stop on all positions is shown below. Annualized return drops from 57% to 27% for this scenario.
Period 01/02/07 – 10/11/18
Benchmark S&P 500 (SPY)
Quick Stats as of 10/11/2018
Total Return 1,621.30%
Benchmark Return 144.40%
Active Return 1,476.90%
Annualized Return 27.34%
Annual Turnover 1,116.11%
Max Drawdown -17.65%
Benchmark Max Drawdown -55.19%
Overall Winners (75/140) 53.57%
Sharpe Ratio 1.39
Couple of clarifications on this model please:
* 1 Factor system- you reference selection is based on ‘short time frame’; how long is the ‘short time frame’?
* ZIV Rising- I’m assuming when you say it is rising, it means it is higher than the prior week close. Please confirm or correct?
Thanks
Jeff
I meant to say VIX Rising.
Another sold and rebuy qld? -10% in One week and nothing change..i’m confused
Sorry, i meant a -6% this week and another -6% two weeks ago.. Total -12% ..
Signals for all our trading models are only generated on weekends for trading on Monday. The VIX-Timer has generated a sell signal for QLD and is buying ZIV (10/14/2018).
Georg, FYI home page does not say sell QLD buy ZIV
Anton/Georg:
Clarification on your trading rules please.
As of Friday VIX is dropping from about 25 to 21. Why are we buying ZIV with VIX *not* rising?
What happens to the model if you replace ZIV with SSO or SPXL? I saw a comment on Portfolio where you replaced SVXY with SSO, and the results were pretty promising back to 2007. Just wondering whether the same holds for replacing ZIV with SSO, and also whether those results are helped with more leverage from SPXL. Appreciate any insights…
Hello I can not subscribe with Interactive Broker, svxy or ziv because I am in europe how to continue to follow the stategie. It’s still amazing. Thanks for your help. richard
You could replace SVXY and ZIV with UPRO.
Period 01/02/11 – 10/21/18
Benchmark S&P 500 (SPY)
Quick Stats as of 10/21/2018
Total Return 1,877.16%
Benchmark Return 156.76%
Active Return 1,720.41%
Annualized Return 46.61%
Annual Turnover 636.99%
Max Drawdown -22.03%
Benchmark Max Drawdown -18.61%
Overall Winners (37/52) 71.15%
Sharpe Ratio 2.21
THANKS YOU
Hello
I’d like to know how the model would fair if there was an additional choice added to the model. Say you included NUGT as a choice maybe under the same rules as ZIV, up markets with VIX over 17. What would performance be?
The Direxion Daily Gold Miners Index Bull and Bear 3X Shares don’t work in this model.
Would any Gold related ETF’s work during up markets with an up VIX?
Gold has no correlation to up markets and VIX.
This model has now experienced its worst drawdown period ever. Why is it selling ZIV now that the market is finally showing positive signs of recovery?
ZIV has lost more than 7% from a recent high after it was bought.
It had lost more than that a week ago too. I guess “up-market conditions” still prevailed last week but have been lost this week?
Would like to understand this too.
Why the model switched to IEF?
Does the indicators in the model tell that up market conditions are not more in place?
Thank you.
I agree that this is all very confusing, especially since the history currently shows buy ZIV, sell ZIV buy IEF all on 10/15. This is certainly
a typo on the date, but it certainly does not inspire confidence at this point.
As for the IEF signal, I’d have to guess that the ZIV hit the ‘%5’ drawdown limit, which doesn’t make sense either because it actually should have hit the week before..
In any case, there is an interesting article you may want to check out at https://evilspeculator.com/58417-2/ . It essentially points out that this timer probably shouldn’t jumped to ZIV when it did because there was significantly more potential downside as indicated by the VIX/VXV ratio.
Here is the associated stockcharts.com chart http://schrts.co/BpDjja referenced in the article.
I’ll be looking at this the next time I consider jumping into ZIV.
There was a typo of the trade date in the historic trades box. Thank you for bringing this to our attention.
The ZIV sell signal is based on exceeding the drawdown limit from the recent high.
It can be interesting to understand why the model switched to IEF.
Up Market Conditions were not present of course, but analizing the Composite Market Timer Score it appears to be greater or equal to 50 i.e. when up-stock market conditions prevail.
You explained in your article that you use this timer to determine risk on risk off and you have a link to the paper explaining the composition of this markt timer.
Now, looking the composition of the timer and what you write on the home page about the Composite Timer, it looks like the component are exactly the same:
Unemployment Rate (UNEMP)
Hi-Beta and Lo-Beta stocks of the S&P 500
TED Spread
Market Climate Score
iM Standard Timer
CBOE Volatility Index VIX
The component models are weighted: models 1. and 2. above each contribute 25, and the other four (3. thru 6.) 12.5 each, totaling 100 for the six models when all of them were to simultaneously signal investment in the stock market. No special curve-fitting or optimization routines where used.
(this is the explanation of the timer used for the Ziv model).
So, why now the model is in IEF if the timer, as stated in your home page, is in SPY?
Thank you.
Why there are no replies on this??
When buy conditions for ZIV are absent, the model can, when upmarket conditions exist, buy either (QLD or DDM) or IEF, if IEF is ranked higher than QLD or IEF at that time.
Recently the model bought IEF on 11/5/2018 and subsequently sold IEF on 11/19/2018 because upmarket conditions still existed at the time.
So did you change the rules?
Shouldn’t the system buy IEF only when upmarket conditions are absent?
It’s written clearly in the rules of your algo.
Shouldn’t the model have sold ZIV a week earlier (i.e., 10/29 instead of 11/5) based on ZIV falling 5% from a high?
On 10/15, the signal bought ZIV at a close of 70.62. On 10/16, ZIV closes at a high of 72.35. It then falls below 68.73 (or 95% of 72.35) on 10/24 and closes at 65.67, where it remains for the rest of that week. So shouldn’t the signal have sold ZIV the following Monday (10/29)?
Just trying to clarify. Thanks.
Any answer on this? Shouldn’t the last position for ZIV been sold on 10/29 instead of 11/5 based on ZIV having “lost more than 5% from a recent high after it was bought.”
I agree that according to PctFromHi<-7% the model should have sold ZIV on 10/29/2018. However, the models Allows Immediate Buyback so the sale did not occur as buy condition for ZIV must still have been present then. It subsequently sold ZIV one week later on 11/5/2018.
Have the last two questions asked in this forum been answered somewhere else? I have been watching for replies.
I don’t understand why there are no replies.
Please see above.
So did you change the rules?
Shouldn’t the system buy IEF only when upmarket conditions are absent?
It’s written clearly in the rules of your algo.
Also today reading your papers the system should switch in IEF.
Could you please give an explanation about this?
Thank you.
I agree with TF. Based on the rules of iMComposite score less than 50 and going to IEF signals down market which should switch the ZIV model as well.
Thanks for confirmation or clarification.
Most confusing model ever. Monday Dec 10 this model should have either switched to IEF (if “down market consitions exist) or to ZIV in upmarkets. This model has lost way more than 5% and the VIX is above 17 and climbing. Its hard to get answers to questions and I pay $900 a year.
12/17 Sell QLD (downmarket)
11/18 Sell IEF (comp>50)
11/05 Sell ZIV (PctFromHi)
10/15 Sell QLD (PctFromHi)
It did not switch to IEF on Dec-10 because up-market conditions still existed then based on analysts’ Current Year Consensus Estimated Earnings for the S&P500 stocks.
It sells QLD bec
Sorry, I meant to ask why does the model buy DDM on 12/17 if downmarket conditions exist? Shouldn’t it switch to IEF?
WHY would the model buy DDM in “down market” conditions??
I have the same question. Why didn’t it switch to IEF?
CAN SOMEONE PLEASE EXPLAIN?? THIS MODEL SHOULD BE IN IEF
Looks like the Composite Market Timer >= 50, so it would not buy IEF.
Tom C
I think Tom is correct.
Downmarket conditions are defined by the Composite Market Timer < 50, OR alternatively by analysts’ Current Year Consensus Estimated Earnings for the S&P500 stocks. On 12/17/2018 the model sold QLD because the score of the Composite Market Timer was less than 50, although the alternative condition did not indicate a downmarket. It bought DDM at the same date because the alternative condition still pointed to upmarket conditions. (Very confusing, but that is because there are two conditions defining upmarket and downmarket formula which need not be pointing in the same direction at the same time.) On 12/24/2018 the model sold DDM (reason= Pct from recent Hi). It bought QLD because the Composite Market Timer was greater than 50 then, and the alternative condition also still indicated upmarket conditions.
Hi
What would be the model return if you replace QLD by TQQQ and DDM by UDOW?
Thank you
Smurf
Inception for TQQQ and UDOW was 2/9/2010.
For period 03/01/10 – 12/24/18
model with TQQQ and UDOW
annualized return 57% with max D/D of -48.2%.
model with QLD and DDM
annualized return 53% with max D/D of -35.2%.
The composite Timer was <50 it changed only this week in 50; so the affirmations above are not correct.
The only reason why it remained invested in stocks could be that still that earning consensus was bullish (as it was before).
At this point the thing difficult to understand is why on the reply is written:
12/17 Sell QLD (“downmarket”).
Maybe a typo Georg?
You are correct.
On 12/17/2018 the model sold QLD because the score of the Composite Market Timer was less than 50, although the alternative condition did not indicate a downmarket. It bought DDM at the same date because the alternative condition, the earning consensus was still bullish (as it was before).
Is the Consensus Estimated Earnings for the S&P500 stocks posted somewhere on this site? If not, can it be found somewhere else online?
It comes from Portfolio 123. We don’t show it on iM.
Can you post the VIX Timer calendar year return for 2018 please.
Thanks
Calendar year returns from model:
2017 79.18%
2018 2.74%
2019YTD 16.04 to 4/24/19
I know I’m posting this on 3 different models, but can you please give me an updated Sortino ratio from present through the entire back-test period? Thanks!
model shows from 2011 to 2019 a Sortino Ratio = 2.88.
wondering why ZIV buy signal when the VIX closed Friday at 16.04?
thanks
I’m curious as well. Anyway we can get an explanation before market close tomorrow? Thanks
DDM is sold because PctFromHi< -5%, ZIV is bought because 3day SMA VIX>17 & ….etc
I don’t want to disclose all the other conditions why ZIV was bought.
Thanks Georg, that’s kind of what we thought but thank you for verifying. That’s exactly what we needed to know… good job
Thanks, Georg. Appreciate the quick response.
Hello,
could you please update the statistics of the model Annualized return, max drawdown etc…)?
Thank you.
Hello,
could you please update the statistics of the model (Annualized return, max drawdown etc…)?
Thank you.
Quick Stats as of 5/17/2019
Total Return ……….. 98.84%
Benchmark Return ……….. 33.42%
Active Return ……….. 65.42%
Annualized Return ……….. 33.51%
Annual Turnover ……….. 510.06%
Max Drawdown ……….. -36.15%
Benchmark Max Drawdown ……….. -19.35%
Overall Winners ……….. (10/16) 62.50%
Sharpe Ratio ……….. 1.30
Georg
What period is this for?
Thanks
VMan
Georg, what period is this?
From 1/2/2017 to 5/17/2019
Georg, do you have any other options for shorting the VIX with this strategy than ZIV? The spreads in ZIV are pretty big, and it only trades about 20k shares a day. I’m curious if there are other options than ZIV or SVXY that could mimic the performance of this strategy. Thanks
Any insight to my question above, Georg?
ProShares Short VIX Short-Term Futures ETF (SVXY)
https://www.proshares.com/funds/svxy.html
hi Georg, I have similar question as bigtime1930. The liquidity of ZIV is even worse than SVXY. I can see your another SVXY model on P123, can I trade SVXY when I following IMS’s VIX with ZIV model? Thanks
Please see my reply to bigtime1930.
Thank you Georg for your quick response. That mean replacing ZIV with SVXY will be the same model as your SVXY model on P123? If not, how about the performance if I replace ZIV with SVXY on this model?
The description for buying includes:
“The model buys ZIV only during up-markets when the VIX is higher than 17 and rising”
Trying to replicate the results I’m confused about what is meant by “rising”. Does it compare the values at EOD of the previous 2 Fridays (since the decision moment is on Sunday)? Is it compared to the value at EOD of the previous Monday? Something else maybe?
I would love to understand the rules so if anyone knows…
drftr
Hi there,
What do you think about the not-so-good performance of the past year. Do you think it’s temporary or there is a problem with the model construction (curve fitting) ?
I’d be interested in your thoughts here, too. Any insight? Thanks
The Anti-VIX model should do well during prolonged up-market periods, but when choppy market conditions prevail for an extended period of time then this model will disappoint.
Thanks, Georg. Do you have a suggested model to pair with this one that does better in choppy markets?
Following. How about Best 10 (VDIGX), Anti-VIXTimer (ZIV), & the 1-week Super Timer (subst. SSO-UST)?
I am curious why you think this system performed so poorly in a year where everything was up ? Was there a flaw in the design of what this system “was looking for” ?
Thanks for your thoughts !
Hi Georg, Can you please provide an update of the risk measurements given in Table 3 above? I’m wondering what this year’s performance did to the Sharpe, Sortino, and correlation measurements. Thanks!
Can you please correct the trade signals starting with 3/2/20? You went long ZIV on that date, but the signals are now confusing, with multiple trades on 3/9/20. Thanks
Any suggestions now that ZIV does no longer exist? The concept of the strategy is sound, it’s just that we need to find a different way to trade it.
drftr
We will remove the model.
What if you would switch back to the original SVXY? Now that it has lost some of its volatility it may actually perform better: If the model is wrong it doesn’t cost us, and if it’s correct over a prolonged time money will show up amyway as our patience gets rewarded.
drftr