
- The “Anti-VIX” ETF SVXY is designed to increase in value when the volatility of the S&P 500 decreases, as measured by the prices of VIX futures contracts.
- Extended data of SVXY, the ProShares Short VIX Short-Term Futures ETF, from Jan-2006 to the fund’s inception date was calculated from its proxy, the S&P 500 VIX Short-Term Futures Index.
- SVXY is intended for short-term use. Using the extended price data, a buy-and-hold strategy of the hypothetical SVXY resulted in a huge loss of over 90% from 2007 to 2009.
- The model buys SVXY only during up-markets when the VIX > 17 and rising, otherwise during up-markets it buys either QLD or DDM, or IEF when upmarket conditions are absent.
- A backtest of the model from Jan-2007 to Jul-2017 produced a high 70% annualized return with a maximum drawdown of -27% with only 76 realized trades.
The iM VIX Timer with SVXY system described further down is a trading model which switches between the “Anti-VIX” ETF ProShares Short VIX Short-Term Futures (SVXY), the 2x long leveraged ETFs ProShares Ultra QQQ (QLD) and ProShares Ultra Dow30 (DDM), and iShares 7-10 Year Treasury Bond ETF (IEF). It holds only one position at any time.
SVXY seeks daily investment results, before fees and expenses, which correspond to the inverse (-1x) of the daily performance of the S&P 500 VIX Short-Term Futures Index. VIX is the symbol for the Chicago Board Options Exchange (CBOE) Volatility Index, which is a predictor of the market’s average volatility over the next 30 days.
SVXY was used in the model because a hypothetical back history of SVXY data could be calculated from SVXY’s nett asset value and the S&P 500 VIX Short-Term Futures Index from Jan-2006 to the inception of SVXY on 10/3/2011. For QLD and DDM the inception date was 6/19/2006. The start date of the model is 1/2/2007.
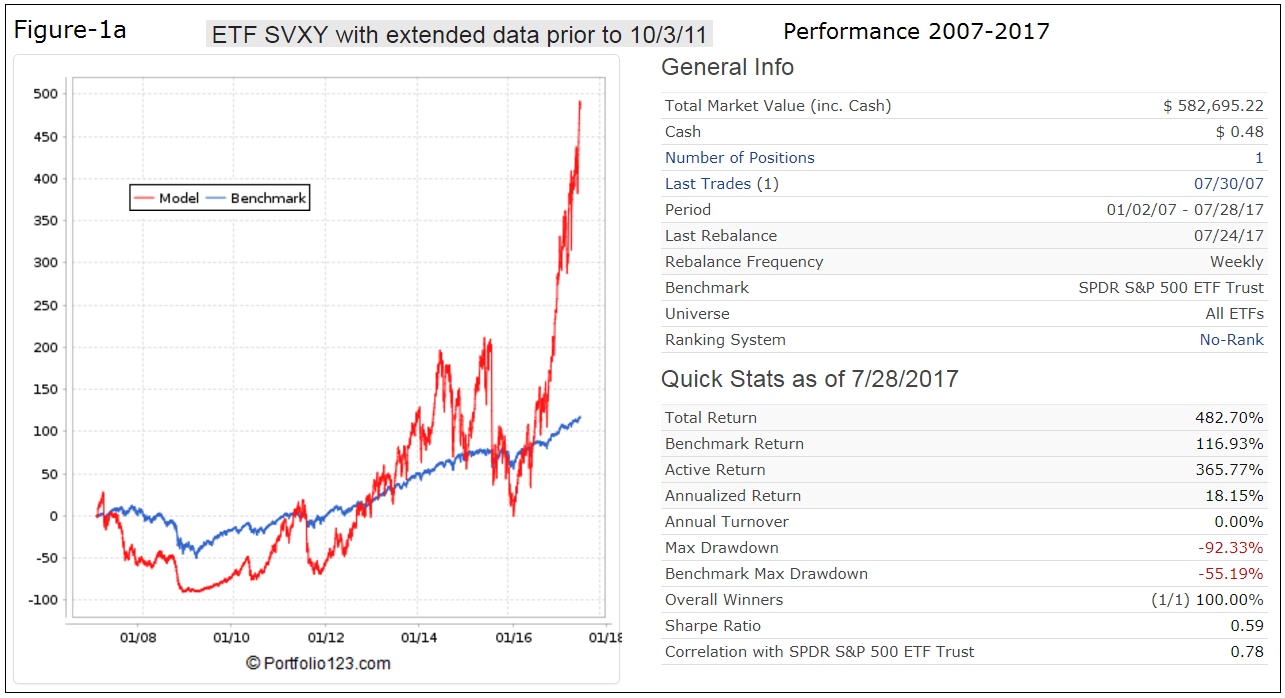
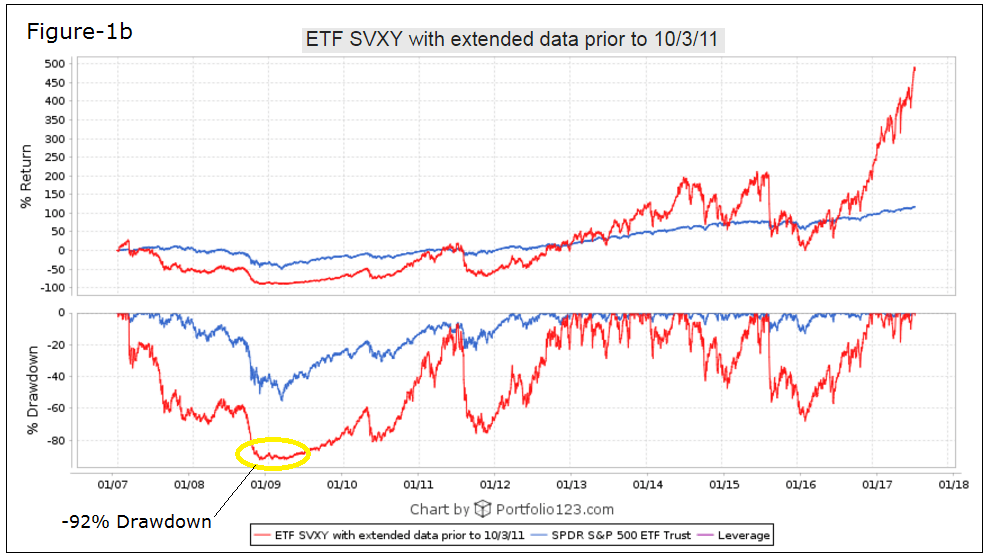
Performance of SVXY
Figure-1a shows the performance of SVXY from Jan-2007 onward. Clearly it is not advisable to hold this fund for extended periods because of the large drawdowns which can be seen in Figure-1b. The hypothetical SVXY would have lost about 92% from 2007 to 2008/9 and further large drawdowns followed; 75% in 2011, 56% in 2015, and 68% in 2016. It is evident that SVXY should only be held during up-market periods and is not suitable as a long-term investment.
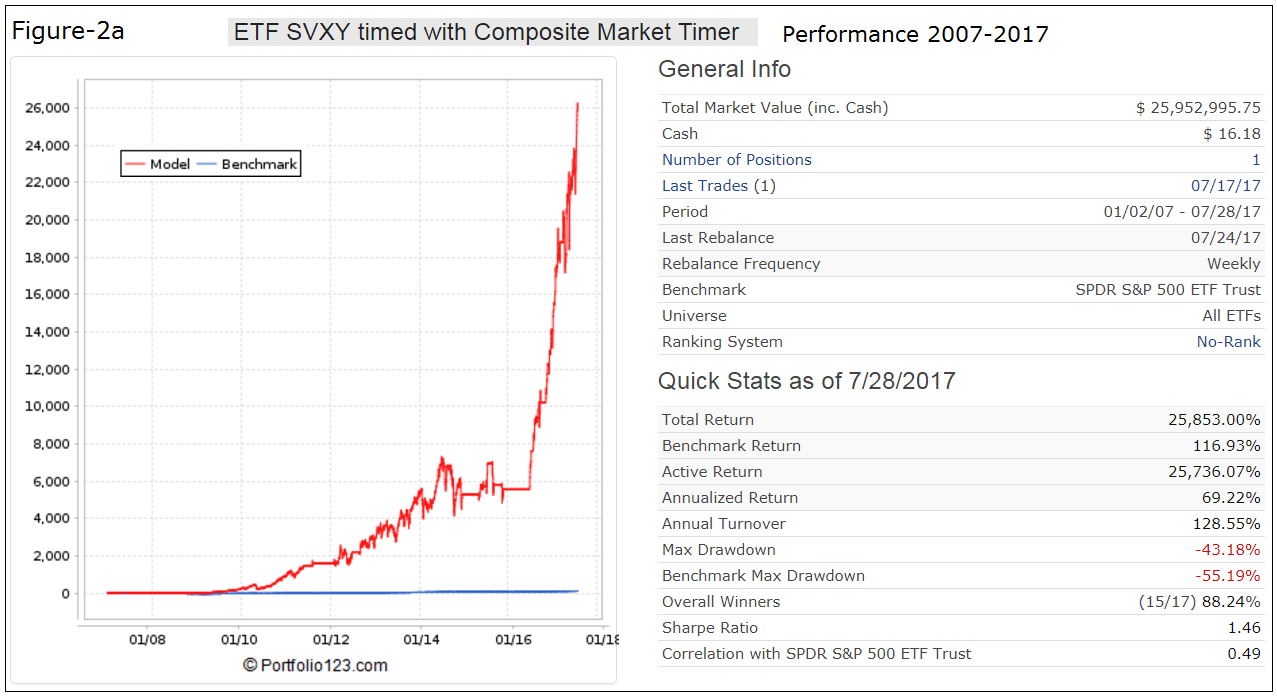
Performance of a SVXY–Cash Model
Figure-2a shows the performance of SVXY when timed with the iM-Composite Market Timer and the VIX. The simulated annualized return from Jan-2007 to end of Jul-2017 was 69% with a maximum drawdown of -43%.
This model buys SVXY only when the Composite Market Timer Score is greater or equal to 50; i.e. when up-stock market conditions prevail.
It sells SVXY
- if SVXY has lost more than 10% from a recent high after it was bought,
- or if the VIX becomes less than 17 and the 3-day moving average of the VIX is below the 20-day moving average at the same time,
- or if the 3-day moving average of the VIX becomes less than 13.5.
The model is rebalanced weekly on the first trading day of the week using closing prices, and transaction costs were assumed as 0.1% of the trade amounts to account for commission and slippage.
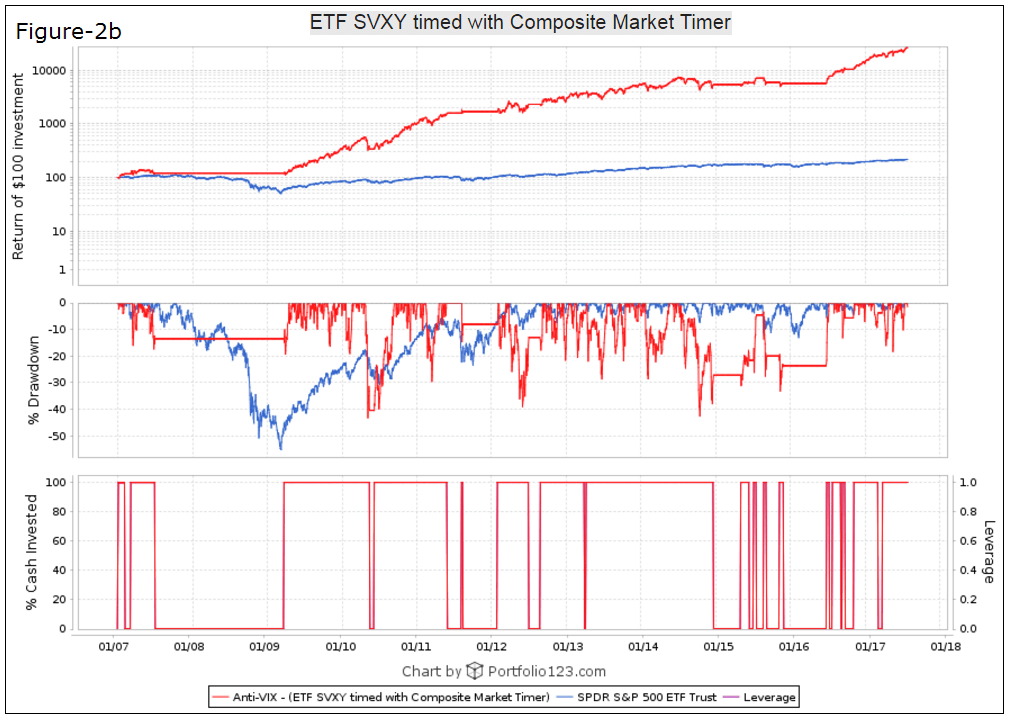
There were only 17 periods when the model was in SVXY, about 60% of the backtest period; otherwise it was in cash, as can be seen from Figure-2b.
Performance of the iM-VIX Timer with SVXY
Performance of the SVXY–Cash model is satisfactory, except for three drawdowns of about -40%. A similar high return with much better drawdowns can be achieved by switching between SVXY, and either QLD or DDM, or IEF.
The model uses a simple ranking system which assumes trading ETFs, rather than investing for longer periods. The one factor system is based on the price changes over a short period. The idea being that ETFs which have experienced a decline over a short period will bounce back, reverting and doing better than ETFs which have not declined in this way.
The model buys SVXY only during up-markets when the VIX is higher than 17 and rising; otherwise during up-markets when the VIX is lower than 17 it buys either QLD or DDM, or IEF when upmarket conditions are absent.
It sells SVXY when
- SVXY has lost more than 7% from a recent high after it was bought,
- or when the 3-day moving average of the VIX becomes less than 13.5.
It sells DDM or QLD when
- DDM or QLD have lost more than 5% from a recent high after they were bought,
- or when down-stock market conditions exist, as indicated by Composite Market Timer Score being less than 50, and when up-market conditions do not exist based on analysts’ Current Year Consensus Estimated Earnings for the S&P500 stocks.
It sells IEF when the Composite Market Timer Score is greater or equal to 50; i.e. when up-stock market conditions prevail.
Simulated performance is shown in Figure-3 and Table-1. The annualized return is about 70% and the maximum drawdown is an acceptable -27%. The model is rebalanced weekly on the first trading day of the week using closing prices, and transaction costs were assumed as 0.1% of the trade amounts to account for commission and slippage.
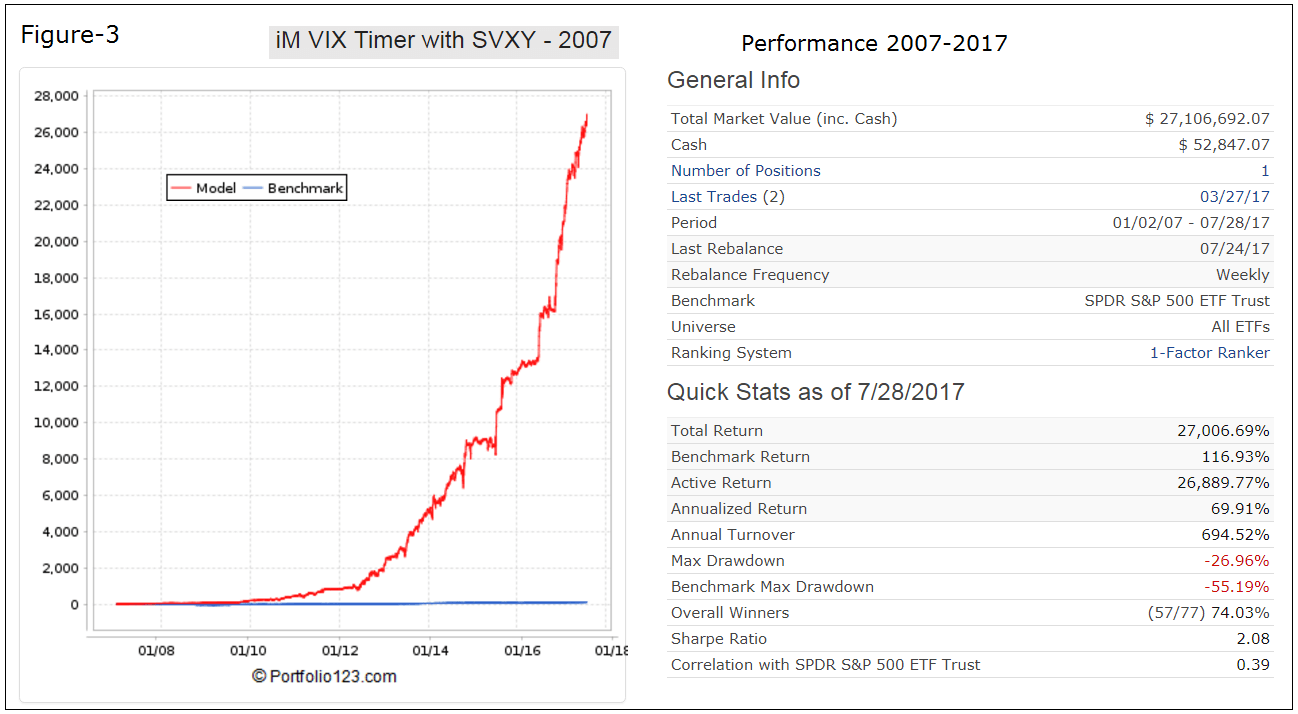

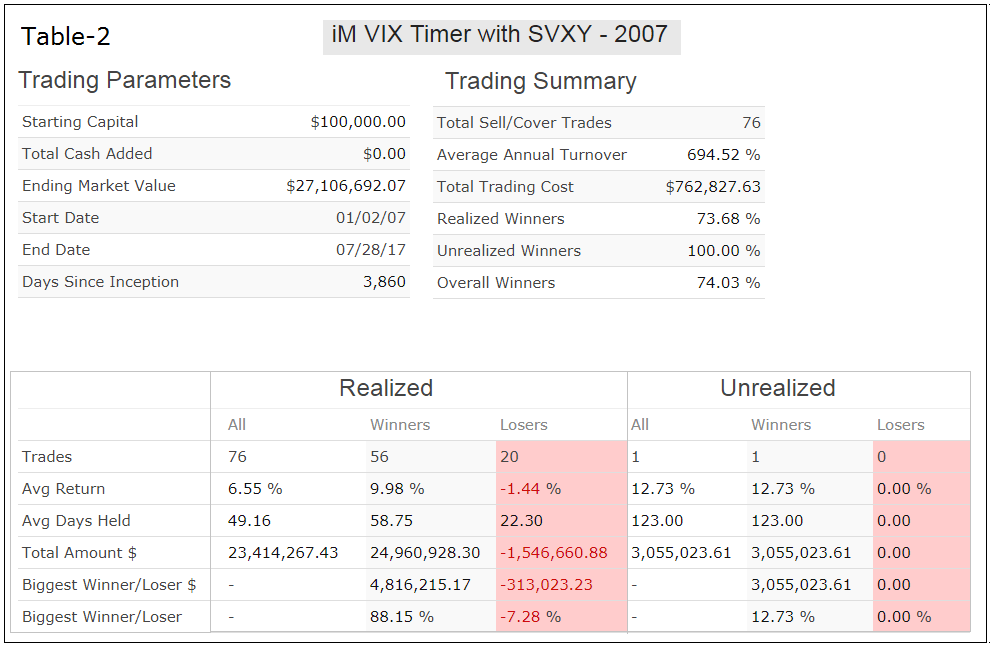
The trading summary is in Table-2. There were only 76 realized trades. The biggest loss of any trade was 7.3%, 74% of all trades were winners and the average holding period was about 50 days. The longest holding period was 90 weeks and 8 trades had the shortest holding period of one week (not shown in the table).
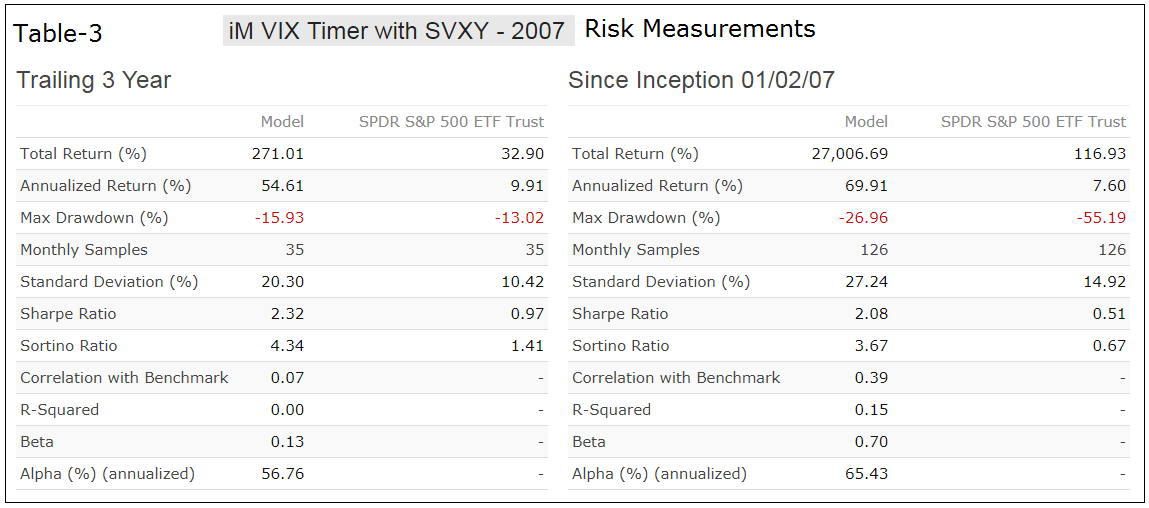
The risk measurements are in Table-3.
Following the model
The iM VIX-Timer with SVXY can be followed by subscribing to it at Portfolio 123 when it will be opened for subscription at the beginning of Nov-2017.
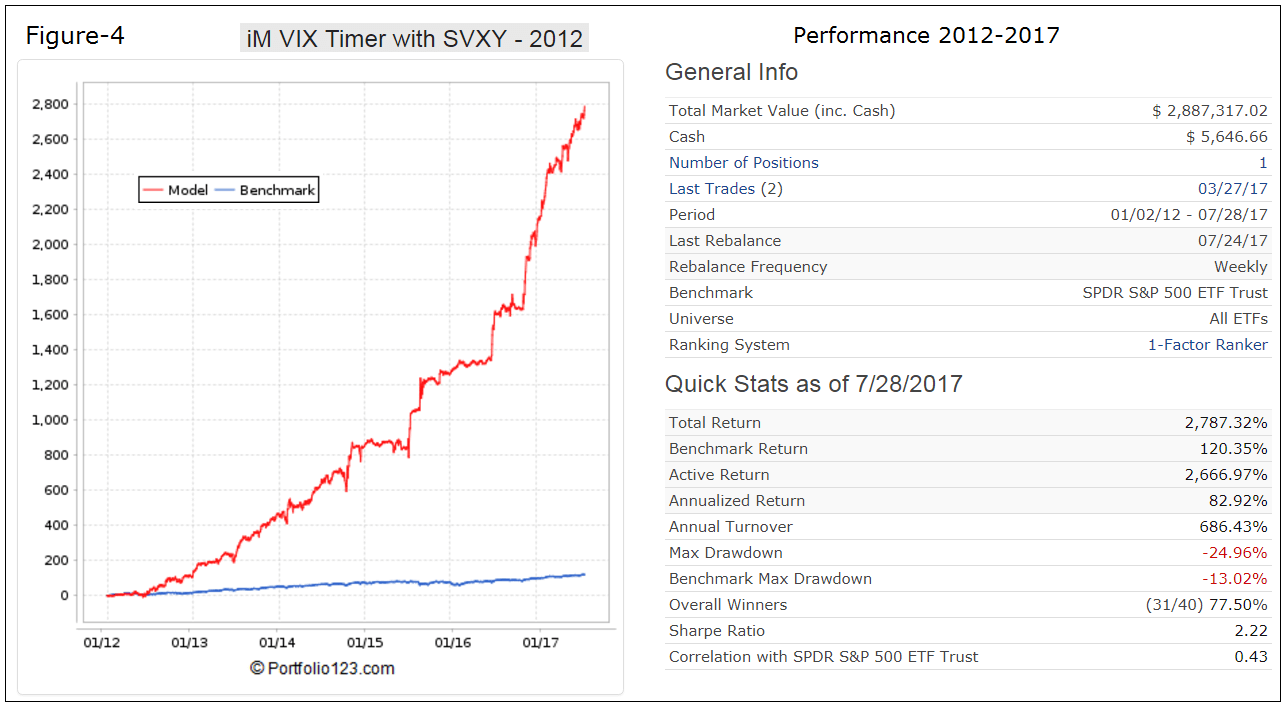
At iMarketSignals we will provide by end August 2017 weekly signals (Gold subscription required) for a similar model, the iM-VIX Timer with ZIV. This model has a simulated annualized return of about 60% from 2011 to 2017 and a maximum drawdown of only -16%.
Disclaimer
Note: All performance results are hypothetical and the result of backtesting over the period 2007 to 2017. No claim is made about future performance. Backtesting involves optimizing parameters by looking at past data. Even if parameter values may be optimal going forward, future returns may generally not be as high as past returns.
Additionally, one must be aware that the ETF SVXY can become valueless when an approximate 130% VIX daily spike occurs. Read more about this in Fred Piards articles: https://seekingalpha.com/article/4144576-xiv-dies-warning-svxy https://seekingalpha.com/article/4147288-vix-spikes-may-kill-svxy-ziv
Very interesting work however I have a question…
Currently this model is in IEF which is held when “upmarket conditions are absent”. We are currently in a bull market… so the question is upmarket conditions of what and what are the parameters of upmarket conditions.
This model, and also the ZIV-Timer currently holds DDM. Why do you believe it is in IEF?
You can read more comments on this model at Seeking Alpha:
https://seekingalpha.com/article/4095356-profiting-market-volatility-anti-vix-etf-svxy
OOPs…misread the table of transactions on P123.
Yes, no problem, those are closed trades with a 30 day lag.
Georg,
This looks good. Can you run correlation between this model and Gold/Stock/Bond Timer and the im-5 ETF Trader? Thanks.
Tom C
Correlation:
VIX-Timer with Gold/Stock/Bond-Timer = 0.41
VIX-Timer with 5ETF-Trader = 0.58
5ETF-Trader with Gold/Stock/Bond-Timer = 0.51
What would the CAGR and max drawdown look like if you substituted SSO for SVXY when the model is in SVXY???
Replacing SVXY with SSO:
Period 01/02/07 – 09/06/17
Benchmark SPDR S&P 500 ETF Trust
Quick Stats as of 9/6/2017
Total Return 6,785.99%
Benchmark Return 115.93%
Active Return 6,670.06%
Annualized Return 48.64%
Annual Turnover 623.28%
Max Drawdown -16.93%
Benchmark Max Drawdown -55.19%
Overall Winners (53/69) 76.81%
Sharpe Ratio 2.14
Georg,
This model and Ziv model are similar, the “only” difference is svxy/ziv(etf), it’s a correct?
Not really. Holdings are also affected by the ranking system.
Dear Georg Is it possible to have trades made since 2007? I saw that you posted those from 2011 for the vix / ziv model, it would be interesting to have these too, thank you
Symbol … Open … Close … Pct
IEF … 3/6/2017 … 3/27/2017 … 0.90%
QLD … 12/5/2016 … 3/6/2017 … 25.50%
IEF … 11/21/2016 … 12/5/2016 … -0.80%
SVXY … 11/7/2016 … 11/21/2016 … 17.30%
IEF … 9/26/2016 … 11/7/2016 … -1.90%
QLD … 9/12/2016 … 9/26/2016 … 2.00%
IEF … 9/6/2016 … 9/12/2016 … -1.00%
DDM … 8/1/2016 … 9/6/2016 … 1.90%
IEF … 7/11/2016 … 8/1/2016 … -0.80%
QLD … 6/27/2016 … 7/11/2016 … 17.10%
IEF … 11/30/2015 … 6/27/2016 … 6.20%
QLD … 11/16/2015 … 11/30/2015 … 4.40%
IEF … 9/14/2015 … 11/16/2015 … -0.90%
QLD … 8/24/2015 … 9/14/2015 … 12.70%
IEF … 7/20/2015 … 8/24/2015 … 2.60%
SVXY … 7/6/2015 … 7/20/2015 … 20.40%
IEF … 6/8/2015 … 7/6/2015 … 0.60%
QLD … 5/4/2015 … 6/8/2015 … -2.30%
IEF … 12/22/2014 … 5/4/2015 … 0.10%
QLD … 12/8/2014 … 12/22/2014 … 0.20%
IEF … 11/17/2014 … 12/8/2014 … 0.20%
SVXY … 10/13/2014 … 11/17/2014 … 28.60%
DDM … 8/4/2014 … 10/13/2014 … -2.80%
QLD … 4/14/2014 … 8/4/2014 … 25.70%
DDM … 3/17/2014 … 4/14/2014 … -1.40%
IEF … 3/10/2014 … 3/17/2014 … 0.50%
SVXY … 2/3/2014 … 3/10/2014 … 15.80%
QLD … 7/22/2013 … 2/3/2014 … 26.60%
SVXY … 6/17/2013 … 7/22/2013 … 24.20%
QLD … 4/8/2013 … 6/17/2013 … 13.40%
IEF … 4/1/2013 … 4/8/2013 … 0.40%
QLD … 1/22/2013 … 4/1/2013 … 3.50%
SVXY … 12/31/2012 … 1/22/2013 … 33.00%
QLD … 11/19/2012 … 12/31/2012 … 4.60%
SVXY … 5/21/2012 … 11/19/2012 … 88.10%
QLD … 5/7/2012 … 5/21/2012 … -7.30%
SVXY … 4/16/2012 … 5/7/2012 … 9.30%
DDM … 1/30/2012 … 4/16/2012 … 4.60%
IEF … 8/29/2011 … 1/30/2012 … 3.10%
QLD … 8/8/2011 … 8/29/2011 … 14.40%
IEF … 7/5/2011 … 8/8/2011 … 5.50%
QLD … 6/20/2011 … 7/5/2011 … 15.40%
DDM … 6/6/2011 … 6/20/2011 … -0.30%
QLD … 5/23/2011 … 6/6/2011 … -4.10%
DDM … 5/9/2011 … 5/23/2011 … -4.50%
SVXY … 3/14/2011 … 5/9/2011 … 34.60%
IEF … 3/7/2011 … 3/14/2011 … 1.00%
SVXY … 1/31/2011 … 3/7/2011 … -6.10%
QLD … 8/16/2010 … 1/31/2011 … 55.10%
DDM … 7/19/2010 … 8/16/2010 … 2.70%
QLD … 6/28/2010 … 7/19/2010 … -2.50%
DDM … 6/7/2010 … 6/28/2010 … 6.20%
IEF … 5/17/2010 … 6/7/2010 … 2.20%
QLD … 5/10/2010 … 5/17/2010 … -3.00%
DDM … 3/1/2010 … 5/10/2010 … 7.30%
IEF … 2/16/2010 … 3/1/2010 … 0.10%
SVXY … 1/25/2010 … 2/16/2010 … 3.10%
IEF … 12/28/2009 … 1/25/2010 … 1.60%
QLD … 11/30/2009 … 12/28/2009 … 12.50%
IEF … 11/16/2009 … 11/30/2009 … 1.20%
QLD … 11/2/2009 … 11/16/2009 … 16.50%
IEF … 10/19/2009 … 11/2/2009 … -1.20%
QLD … 10/5/2009 … 10/19/2009 … 9.50%
IEF … 5/26/2009 … 10/5/2009 … 1.70%
DDM … 3/23/2009 … 5/26/2009 … 17.50%
IEF … 7/2/2007 … 3/23/2009 … 19.10%
DDM … 6/11/2007 … 7/2/2007 … 0.90%
QLD … 5/29/2007 … 6/11/2007 … -0.30%
IEF … 5/21/2007 … 5/29/2007 … -0.90%
QLD … 5/7/2007 … 5/21/2007 … 1.10%
IEF … 4/30/2007 … 5/7/2007 … -0.50%
QLD … 3/5/2007 … 4/30/2007 … 17.80%
IEF … 2/5/2007 … 3/5/2007 … 1.90%
QLD … 1/22/2007 … 2/5/2007 … 1.60%
IEF … 1/16/2007 … 1/22/2007 … -0.20%
QLD … 1/3/2007 … 1/16/2007 … 9.40%
Hello, is the VIX timer still being published? Thank you and many greetings