  |
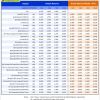
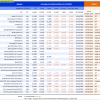
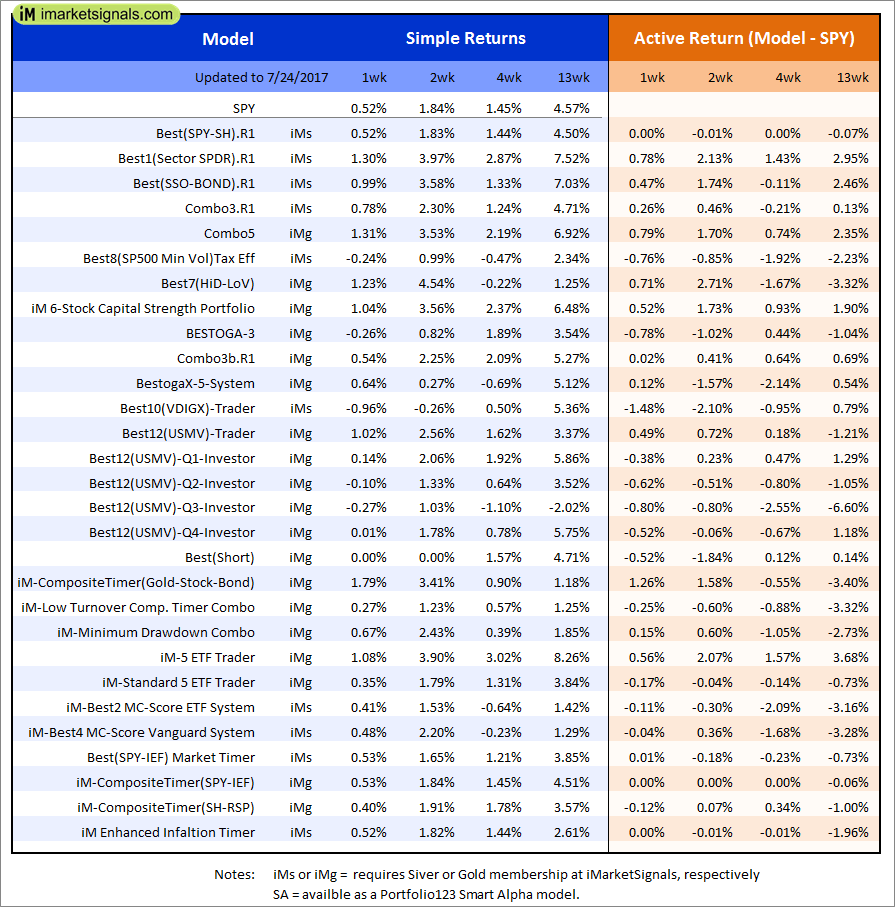
Out of sample performance summary of our models for the past 1, 2, 4 and 13 week periods. The active active return indicates how the models over- or underperformed the benchmark ETF SPY. Also the YTD, and the 1-, 3-, 5- and 10-year annualized returns are shown in the second table |
|
|
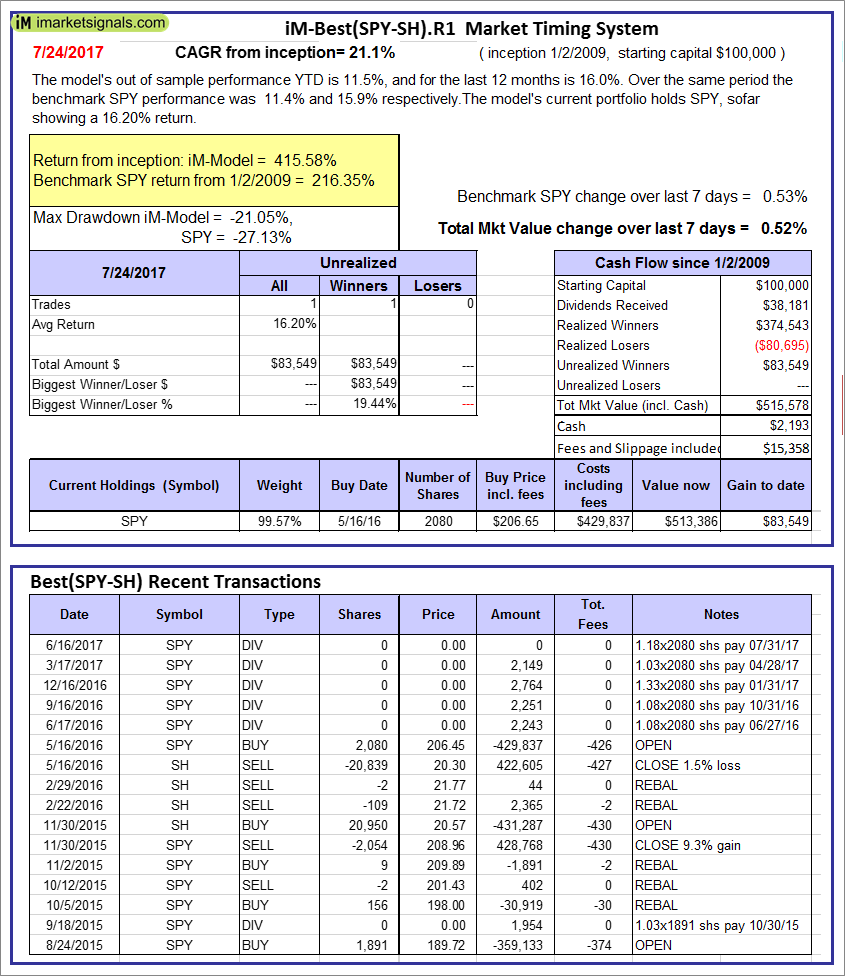
iM-Best(SPY-SH).R1: The model’s out of sample performance YTD is 11.5%, and for the last 12 months is 16.0%. Over the same period the benchmark SPY performance was 11.4% and 15.9% respectively. Over the previous week the market value of Best(SPY-SH) gained 0.52% at a time when SPY gained 0.53%. A starting capital of $100,000 at inception on 1/2/2009 would have grown to $515,578 which includes $2,193 cash and excludes $15,358 spent on fees and slippage. |
|
|
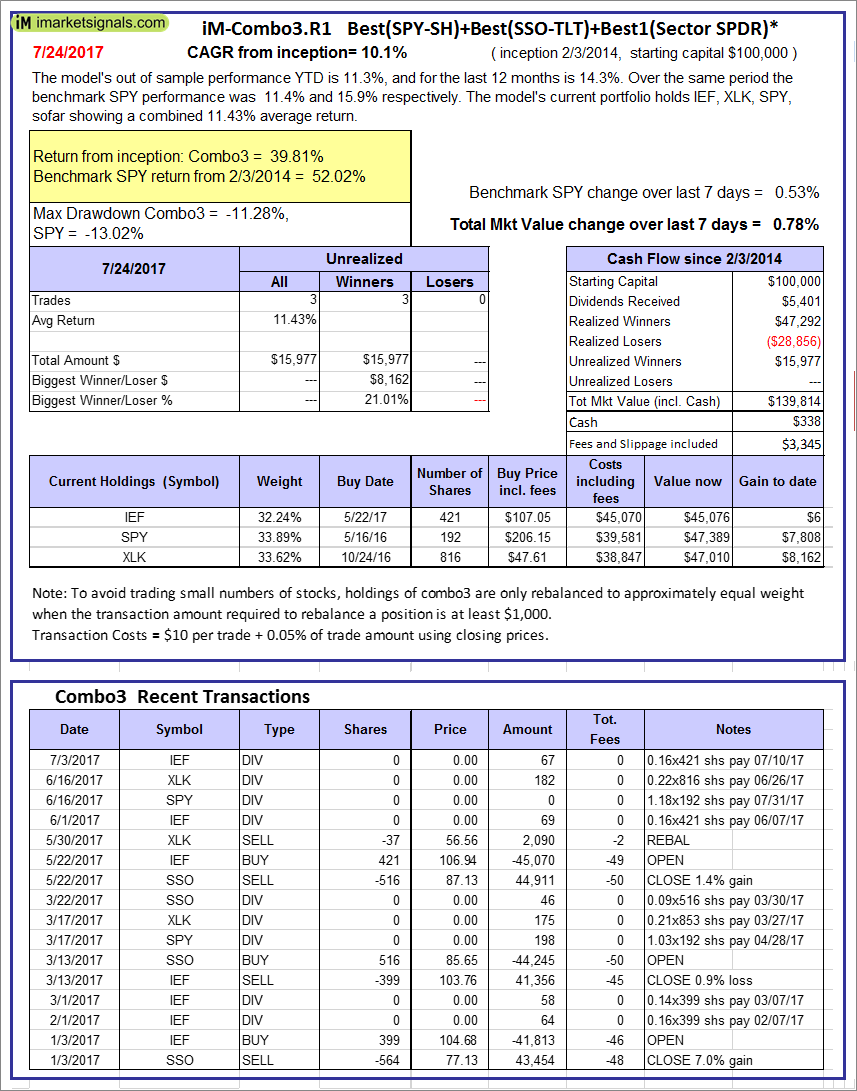
iM-Combo3.R1: The model’s out of sample performance YTD is 11.3%, and for the last 12 months is 14.3%. Over the same period the benchmark SPY performance was 11.4% and 15.9% respectively. Over the previous week the market value of iM-Combo3.R1 gained 0.78% at a time when SPY gained 0.53%. A starting capital of $100,000 at inception on 2/3/2014 would have grown to $139,814 which includes $338 cash and excludes $3,345 spent on fees and slippage. |
|
|
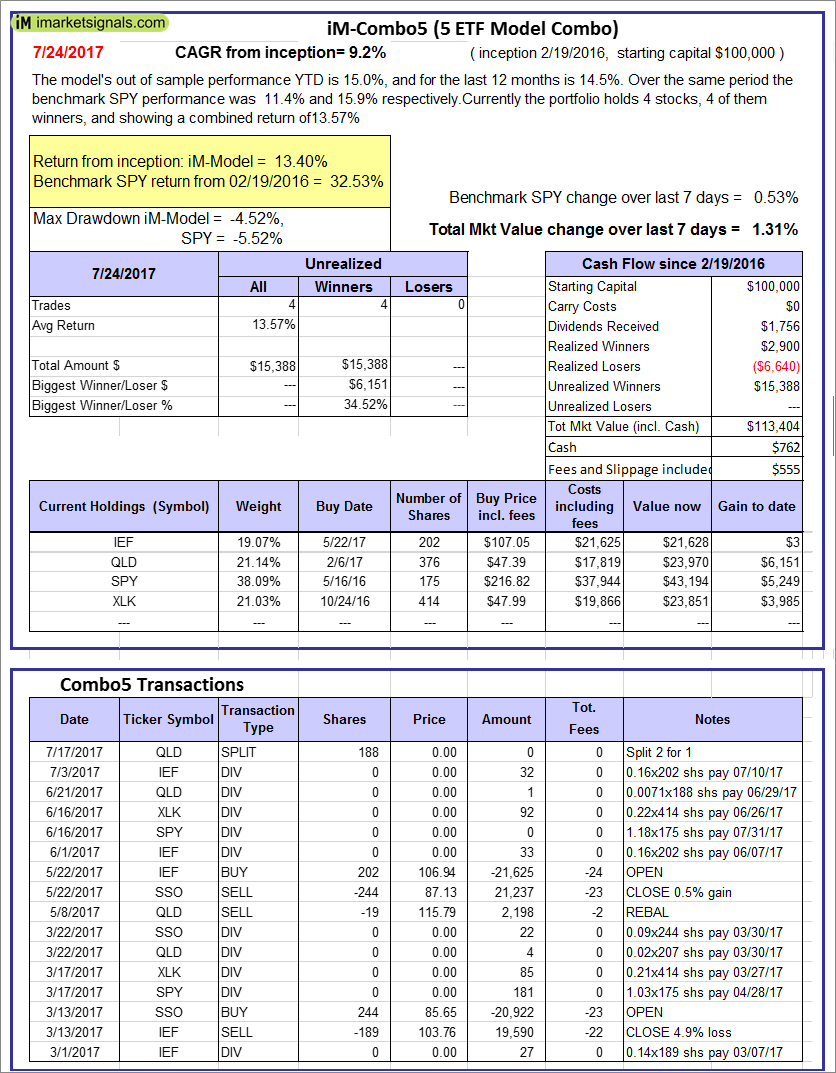
iM-Combo5: The model’s out of sample performance YTD is 15.0%, and for the last 12 months is 14.5%. Over the same period the benchmark SPY performance was 11.4% and 15.9% respectively. Over the previous week the market value of iM-Combo5 gained 1.31% at a time when SPY gained 0.53%. A starting capital of $100,000 at inception on 2/22/2016 would have grown to $113,404 which includes $762 cash and excludes $555 spent on fees and slippage. |
|
|
The iM-Best8(S&P500 Min Vol)Tax-Efficient The model’s out of sample performance YTD is 6.2%, and for the last 12 months is -6.6%. Over the same period the benchmark SPY performance was 11.4% and 15.9% respectively. Over the previous week the market value of iM-Best8(S&P 500)Tax-Eff. gained -0.24% at a time when SPY gained 0.53%. A starting capital of $100,000 at inception on 1/2/2009 would have grown to $417,751 which includes $566 cash and excludes $8,444 spent on fees and slippage. |
|
|
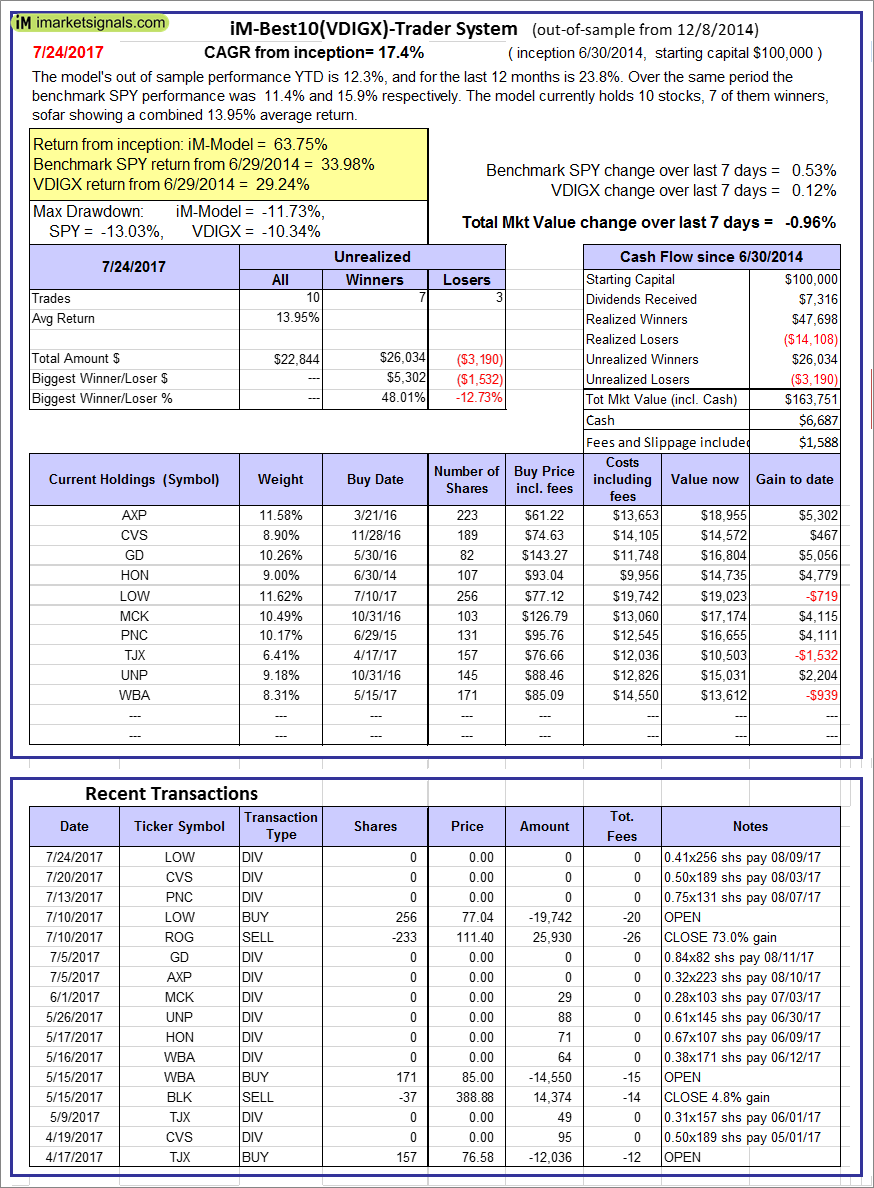
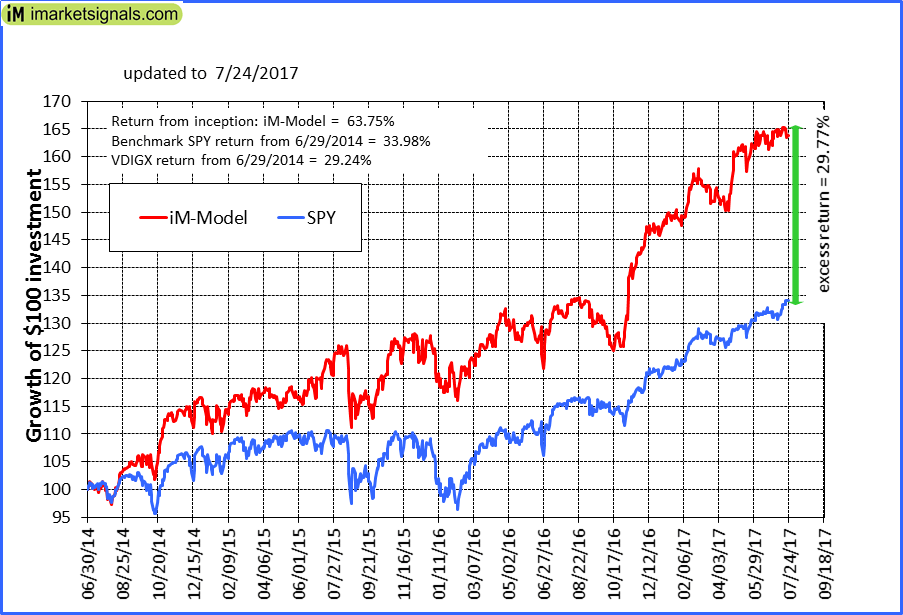
iM-Best10(VDIGX)-Trader: The model’s out of sample performance YTD is 12.3%, and for the last 12 months is 23.8%. Over the same period the benchmark SPY performance was 11.4% and 15.9% respectively. Since inception, on 7/1/2014, the model gained 63.75% while the benchmark SPY gained 33.98% and VDIGX gained 29.24% over the same period. Over the previous week the market value of iM-Best10(VDIGX) gained -0.96% at a time when SPY gained 0.53%. A starting capital of $100,000 at inception on 7/1/2014 would have grown to $163,751 which includes $6,687 cash and excludes $1,588 spent on fees and slippage. |
|
|
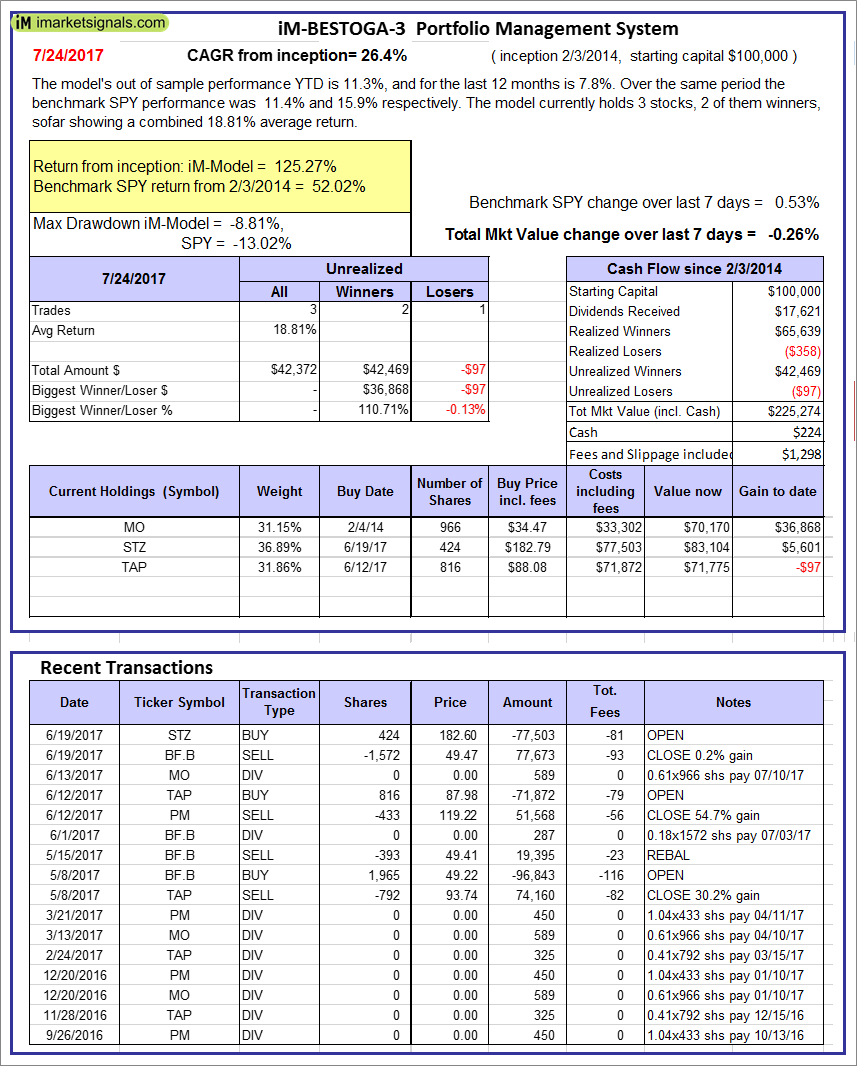
iM-BESTOGA-3: The model’s out of sample performance YTD is 11.3%, and for the last 12 months is 7.8%. Over the same period the benchmark SPY performance was 11.4% and 15.9% respectively. Over the previous week the market value of iM-BESTOGA-3 gained -0.26% at a time when SPY gained 0.53%. A starting capital of $100,000 at inception on 2/3/2014 would have grown to $225,274 which includes $224 cash and excludes $1,298 spent on fees and slippage. |
|
|
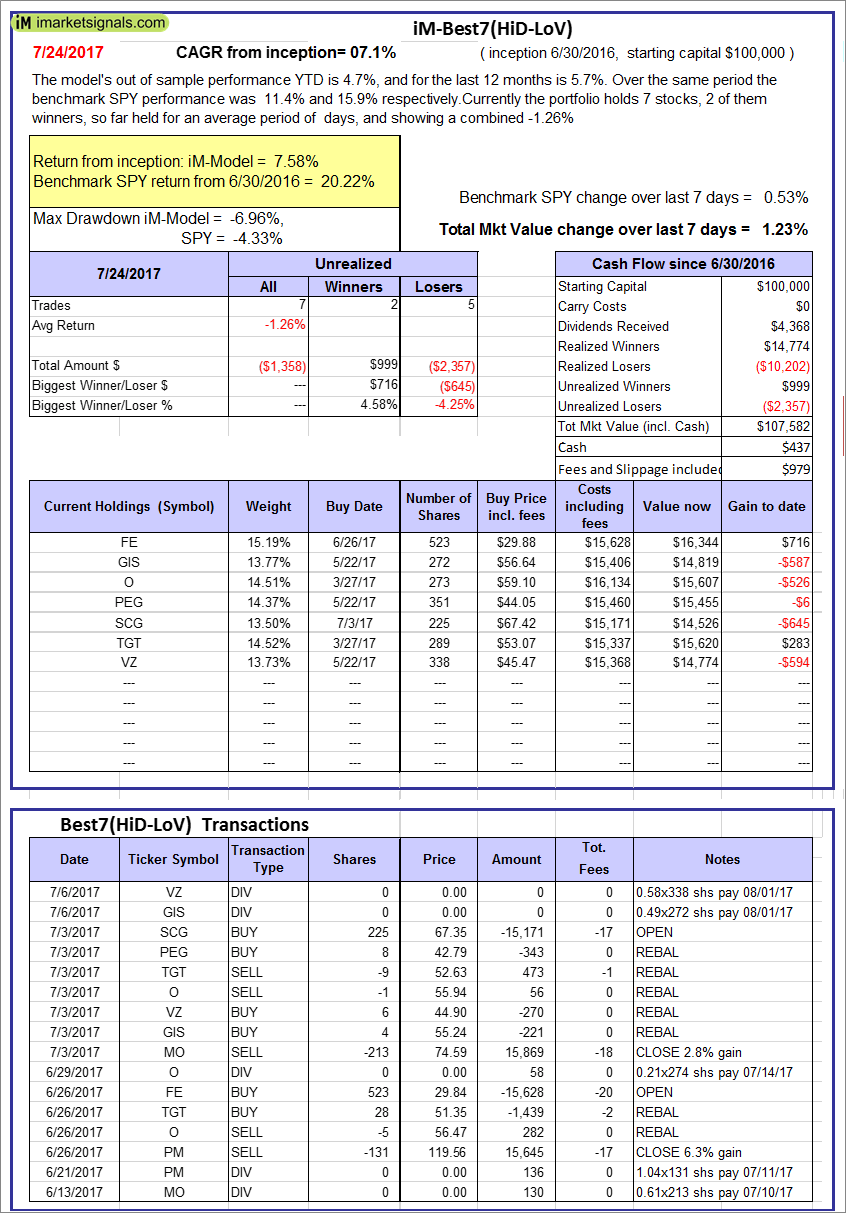
iM-Best7(HiD-LoV): The model’s out of sample performance YTD is 4.7%, and for the last 12 months is 5.7%. Over the same period the benchmark SPY performance was 11.4% and 15.9% respectively. Over the previous week the market value of iM-BESTOGA-3 gained 1.23% at a time when SPY gained 0.53%. A starting capital of $100,000 at inception on 6/30/2016 would have grown to $107,582 which includes $437 cash and excludes $979 spent on fees and slippage. |
|
|
iM 6-Stock Capital Strength Portfolio: The model’s out of sample performance YTD is 23.1%, and since inception 30.2%. Over the same period the benchmark SPY performance was 11.4% and 17.9% respectively. Over the previous week the market value of the iM 6-Stock Capital Strength Portfolio gained 1.04% at a time when SPY gained 0.53%. A starting capital of $100,000 at inception on 10/28/2016 would have grown to $130,180 which includes $1,885 cash and excludes $210 spent on fees and slippage. |
|
|
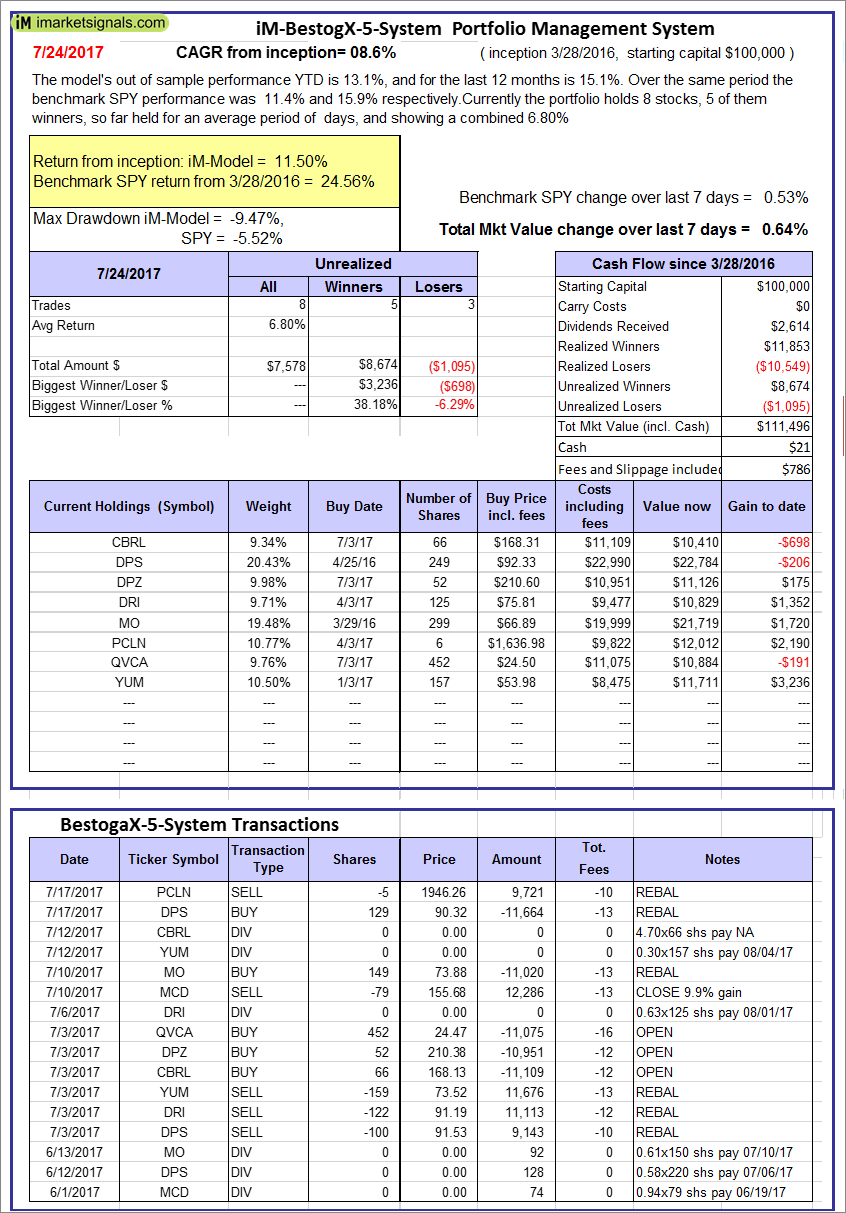
iM-BestogaX5-System: The model’s out of sample performance YTD is 13.1%, and for the last 12 months is 15.1%. Over the same period the benchmark SPY performance was 11.4% and 15.9% respectively. Over the previous week the market value of iM-Best8(S&P 500)Tax-Eff. gained 0.64% at a time when SPY gained 0.53%. A starting capital of $100,000 at inception on 3/28/2016 would have grown to $111,496 which includes $21 cash and excludes $786 spent on fees and slippage. |
|
|
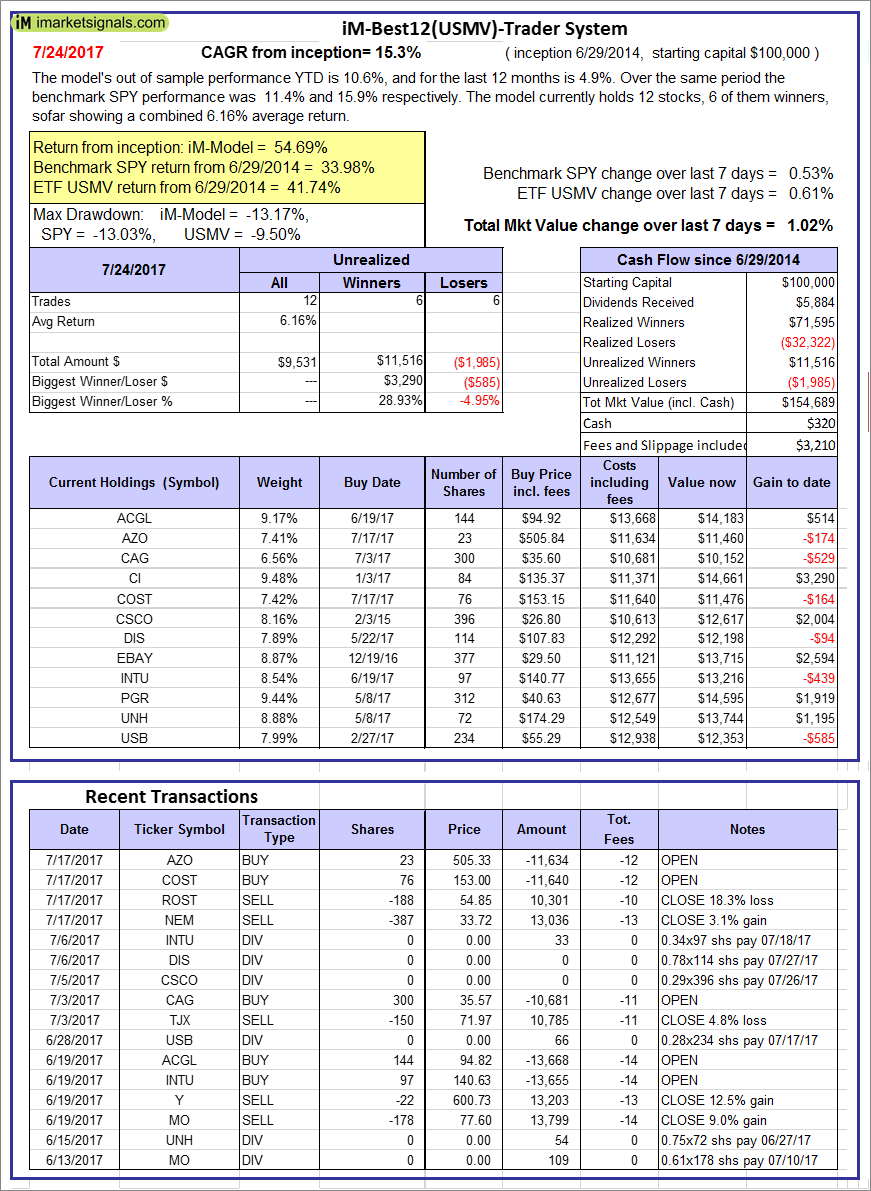
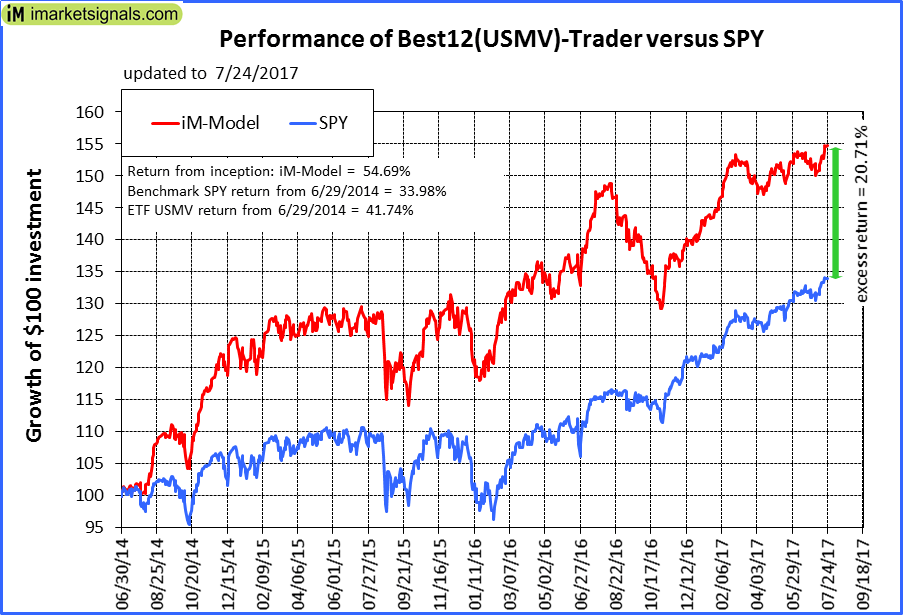
iM-Best12(USMV)-Trader: The model’s out of sample performance YTD is 10.6%, and for the last 12 months is 4.9%. Over the same period the benchmark SPY performance was 11.4% and 15.9% respectively. Since inception, on 6/30/2014, the model gained 54.69% while the benchmark SPY gained 33.98% and the ETF USMV gained 41.74% over the same period. Over the previous week the market value of iM-Best12(USMV)-Trader gained 1.02% at a time when SPY gained 0.53%. A starting capital of $100,000 at inception on 6/30/2014 would have grown to $154,689 which includes $320 cash and excludes $3,210 spent on fees and slippage. |
|
|
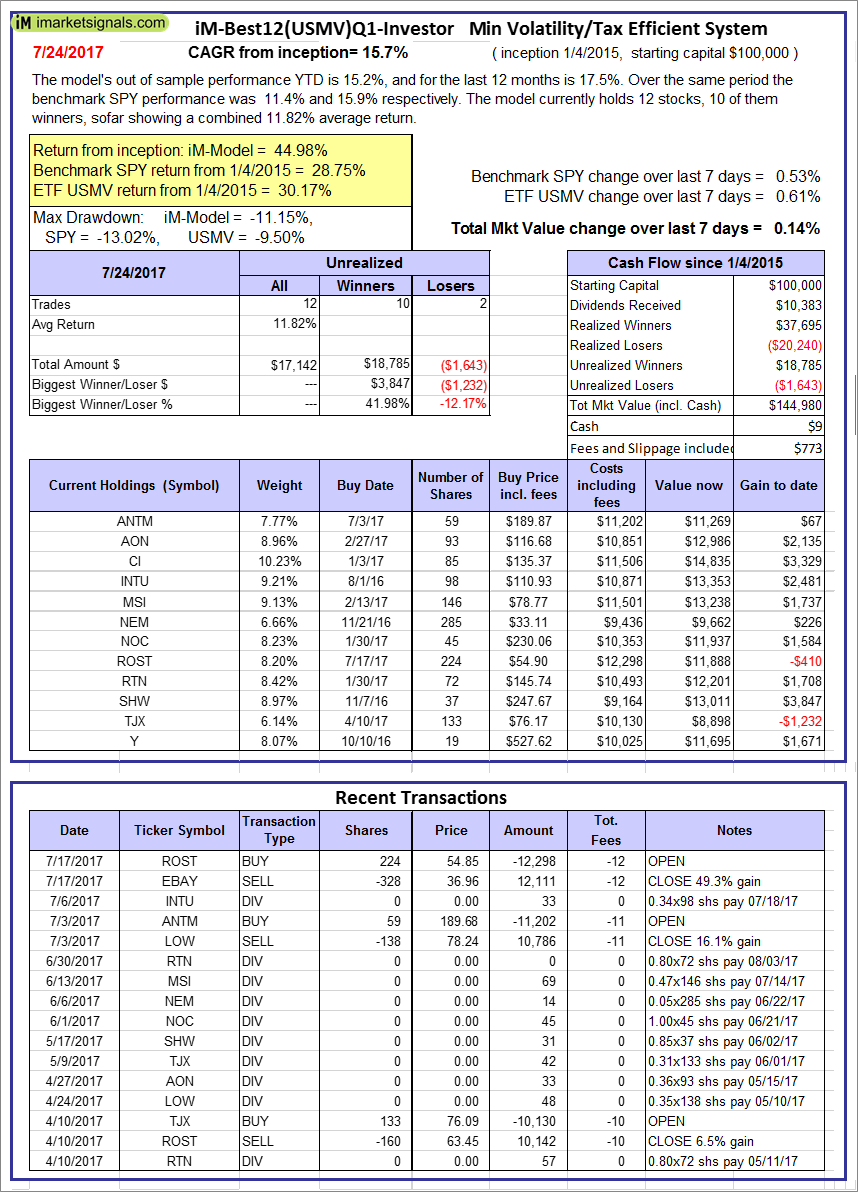
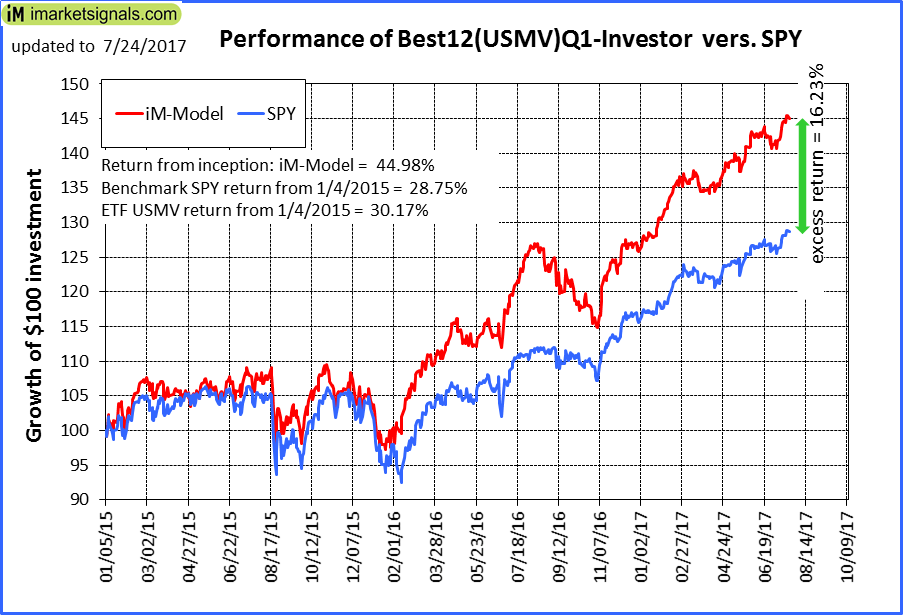
iM-Best12(USMV)Q1-Investor: The model’s out of sample performance YTD is 15.2%, and for the last 12 months is 17.5%. Over the same period the benchmark SPY performance was 11.4% and 15.9% respectively. Since inception, on 1/5/2015, the model gained 44.98% while the benchmark SPY gained 28.75% and the ETF USMV gained 30.17% over the same period. Over the previous week the market value of iM-Best12(USMV)Q1 gained 0.14% at a time when SPY gained 0.53%. A starting capital of $100,000 at inception on 1/5/2015 would have grown to $144,980 which includes $9 cash and excludes $773 spent on fees and slippage. |
|
|
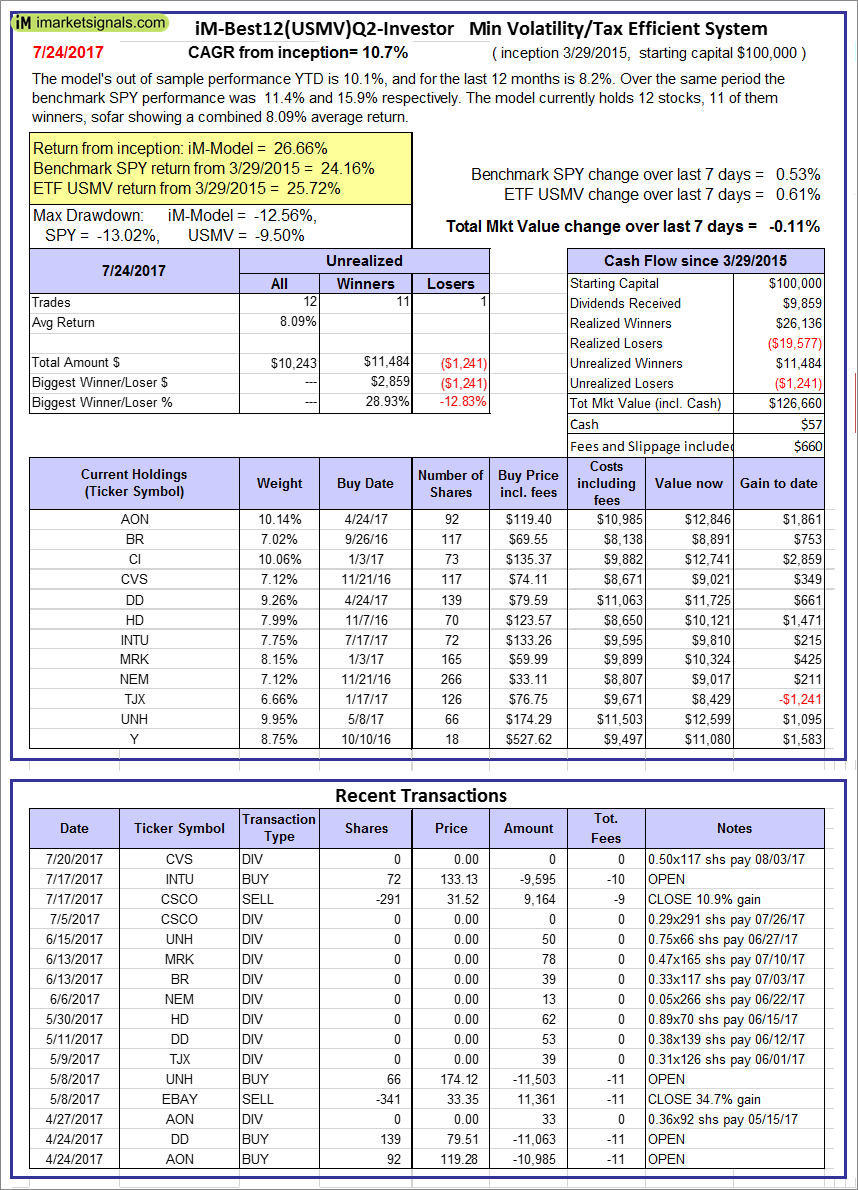
iM-Best12(USMV)Q2-Investor: The model’s out of sample performance YTD is 10.1%, and for the last 12 months is 8.2%. Over the same period the benchmark SPY performance was 11.4% and 15.9% respectively. Since inception, on 3/30/2015, the model gained 26.66% while the benchmark SPY gained 24.16% and the ETF USMV gained 25.72% over the same period. Over the previous week the market value of iM-Best12(USMV)Q2 gained -0.11% at a time when SPY gained 0.53%. A starting capital of $100,000 at inception on 3/30/2015 would have grown to $126,660 which includes $57 cash and excludes $660 spent on fees and slippage. |
|
|
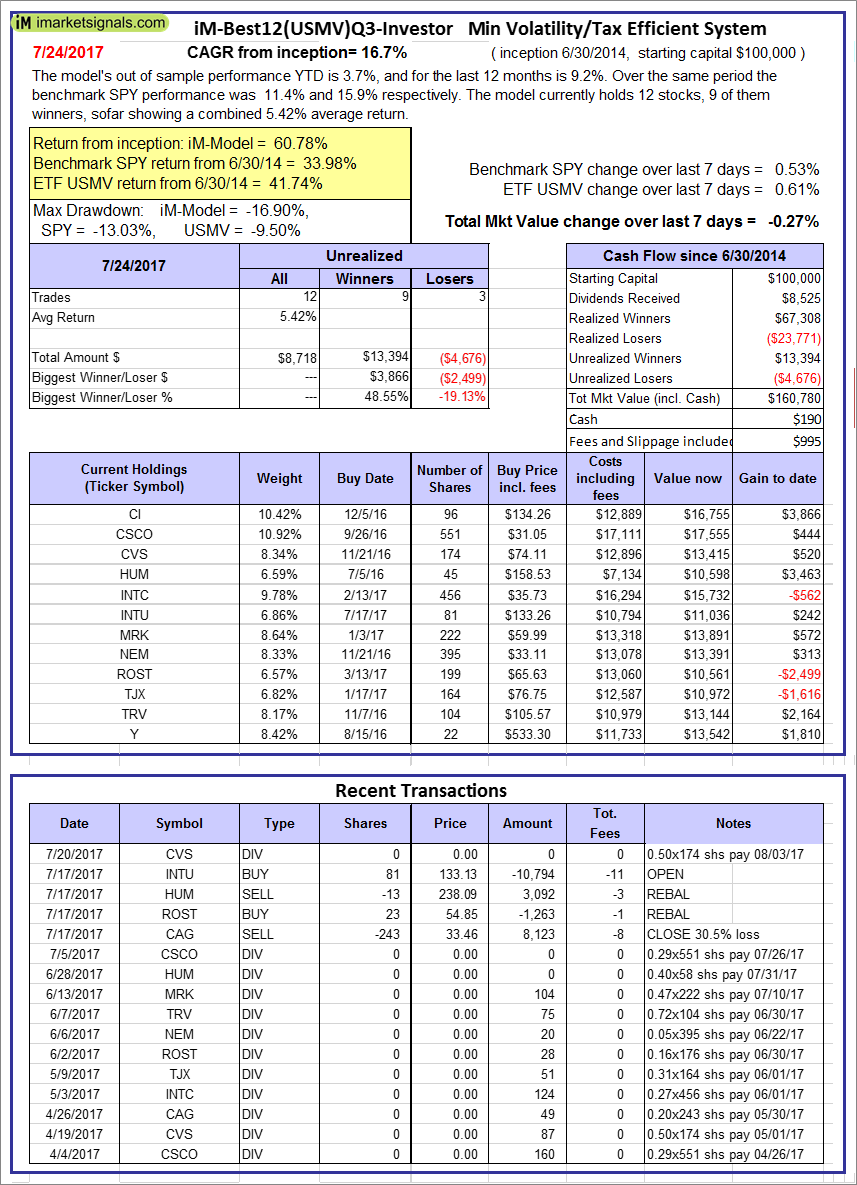
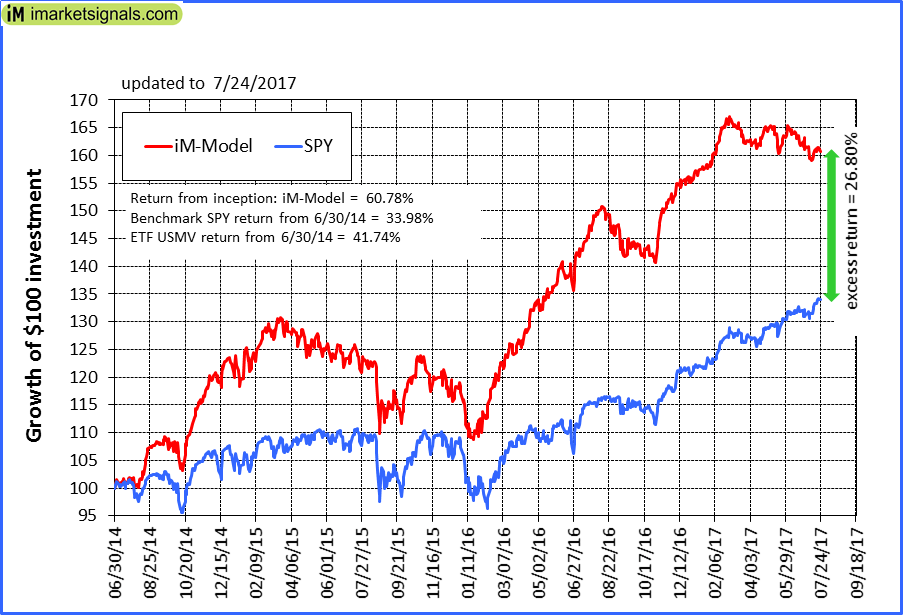
iM-Best12(USMV)Q3-Investor: The model’s out of sample performance YTD is 3.7%, and for the last 12 months is 9.2%. Over the same period the benchmark SPY performance was 11.4% and 15.9% respectively. Since inception, on 7/1/2014, the model gained 60.78% while the benchmark SPY gained 33.98% and the ETF USMV gained 41.74% over the same period. Over the previous week the market value of iM-Best12(USMV)Q3 gained -0.27% at a time when SPY gained 0.53%. A starting capital of $100,000 at inception on 7/1/2014 would have grown to $160,780 which includes $190 cash and excludes $995 spent on fees and slippage. |
|
|
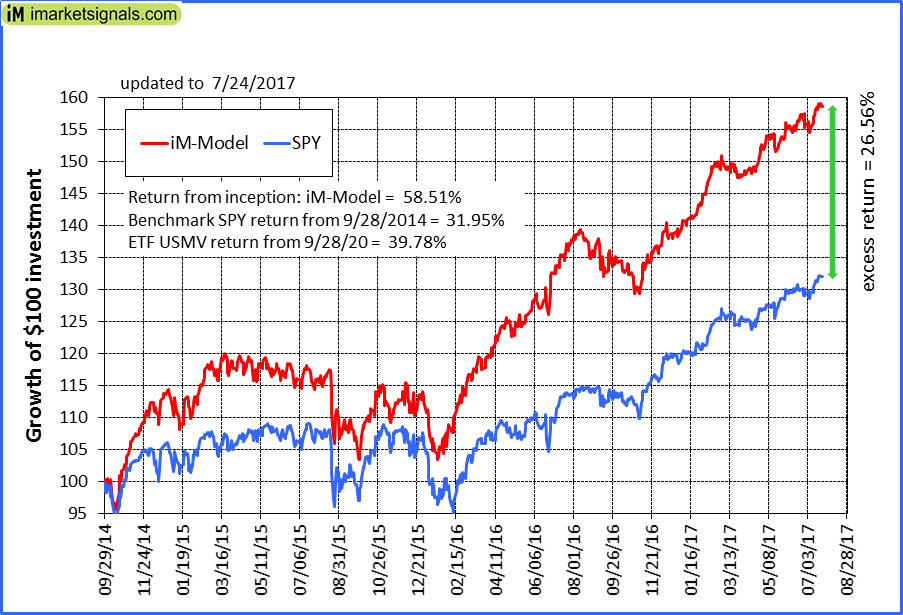
iM-Best12(USMV)Q4-Investor: Since inception, on 9/29/2014, the model gained 58.51% while the benchmark SPY gained 31.95% and the ETF USMV gained 39.78% over the same period. Over the previous week the market value of iM-Best12(USMV)Q4 gained 0.00% at a time when SPY gained 0.53%. A starting capital of $100,000 at inception on 9/29/2014 would have grown to $158,505 which includes -$23 cash and excludes $869 spent on fees and slippage. |
|
|
Average Performance of iM-Best12(USMV)Q1+Q2+Q3+Q4-Investor resulted in an excess return of 33.28% over SPY. (see iM-USMV Investor Portfolio) |
|
|
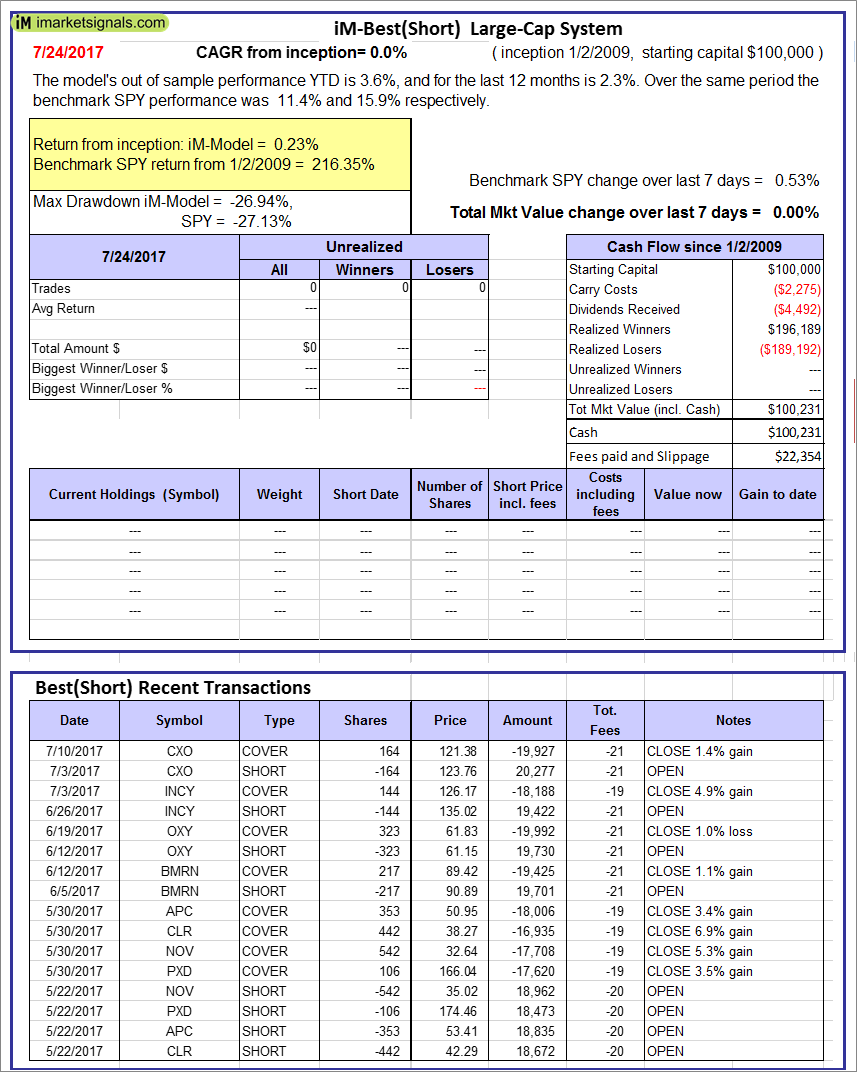
iM-Best(Short): The model’s out of sample performance YTD is 3.6%, and for the last 12 months is 2.3%. Over the same period the benchmark SPY performance was 11.4% and 15.9% respectively. Over the previous week the market value of iM-Best(Short) gained 0.00% at a time when SPY gained 0.53%. Over the period 1/2/2009 to 7/24/2017 the starting capital of $100,000 would have grown to $100,231 which includes $100,231 cash and excludes $22,354 spent on fees and slippage. |
|
|
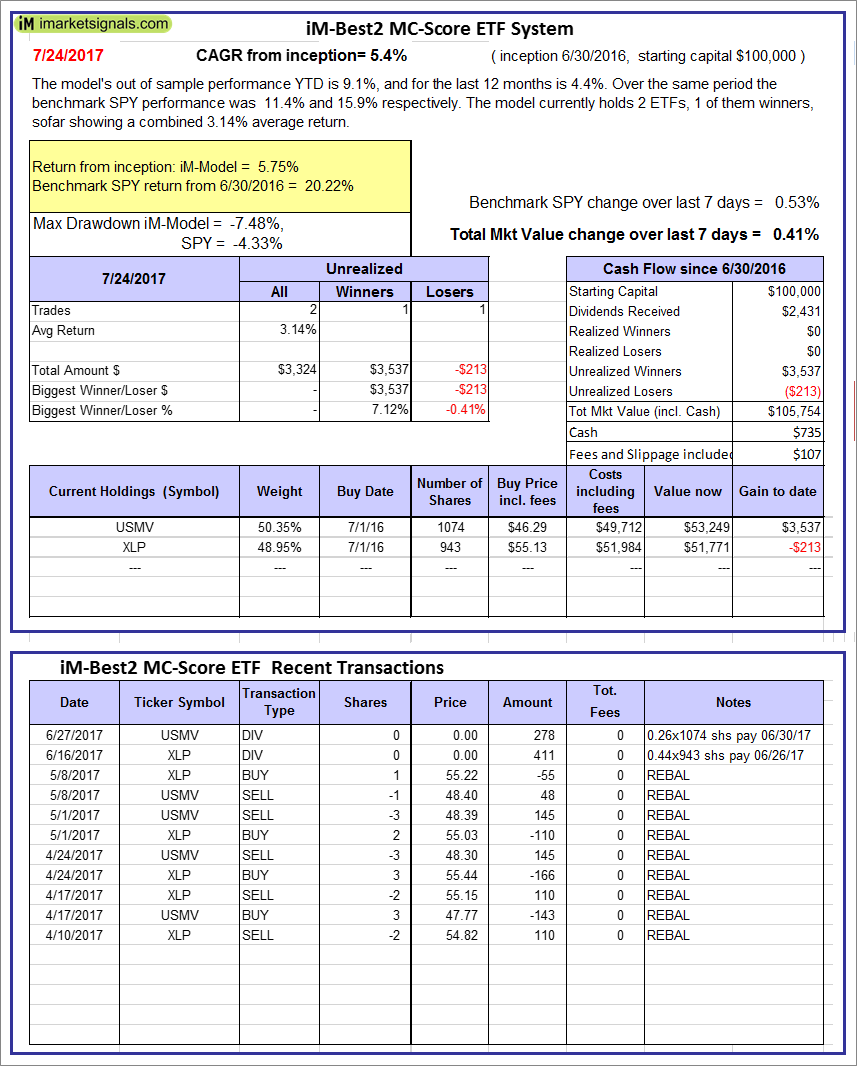
iM-Best2 MC-Score ETF System: The model’s out of sample performance YTD is 9.1%, and for the last 12 months is 4.4%. Over the same period the benchmark SPY performance was 11.4% and 15.9% respectively. Over the previous week the market value of the iM-Best2 MC-Score ETF System gained 0.41% at a time when SPY gained 0.53%. A starting capital of $100,000 at inception on 6/30/2016 would have grown to $105,754 which includes $735 cash and excludes $107 spent on fees and slippage. |
|
|
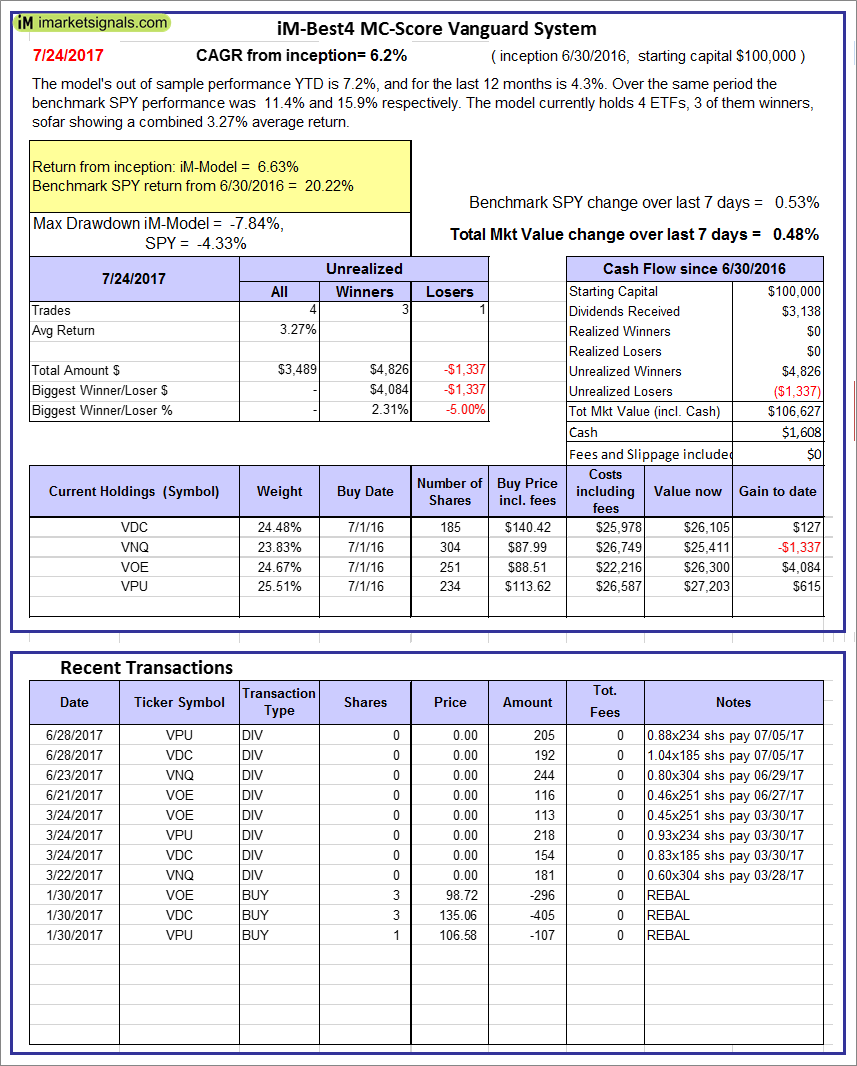
iM-Best4 MC-Score Vanguard System: The model’s out of sample performance YTD is 7.2%, and for the last 12 months is 4.3%. Over the same period the benchmark SPY performance was 11.4% and 15.9% respectively. Over the previous week the market value of the iM-Best4 MC-Score Vanguard System gained 0.48% at a time when SPY gained 0.53%. A starting capital of $100,000 at inception on 6/30/2016 would have grown to $106,627 which includes $1,608 cash and excludes $00 spent on fees and slippage. |
|
|
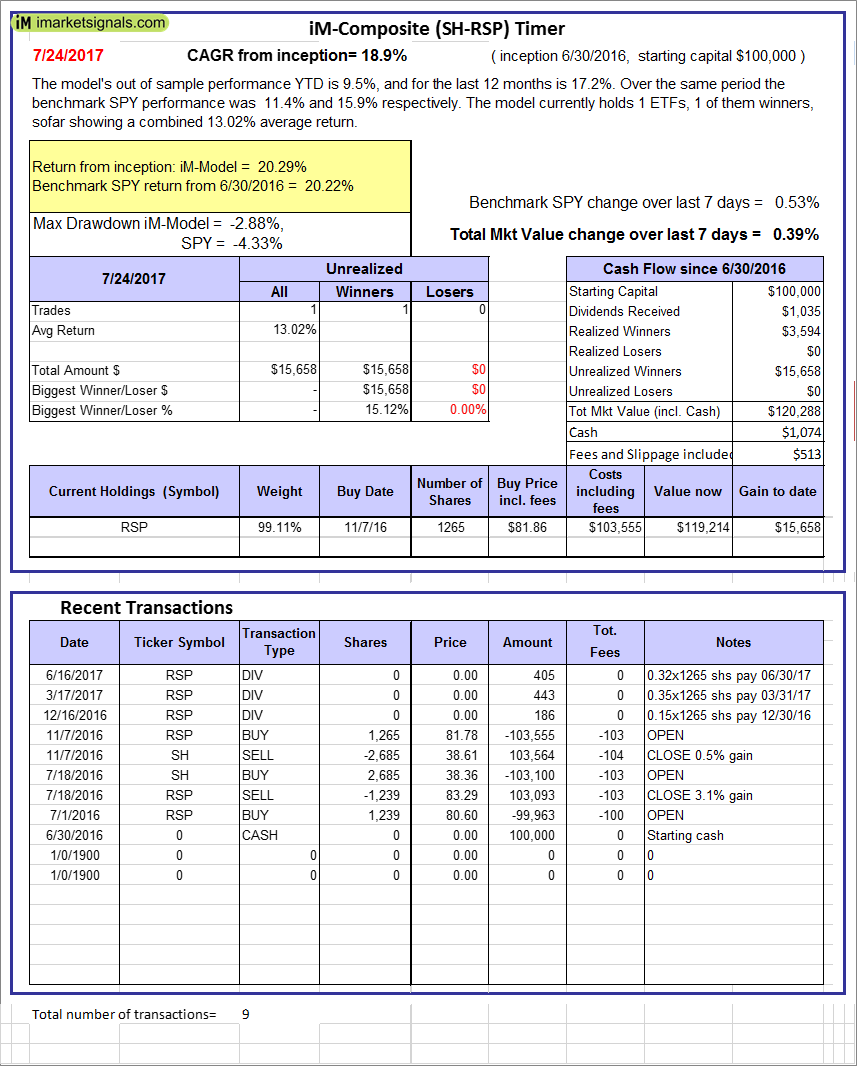
iM-Composite (SH-RSP) Timer: The model’s out of sample performance YTD is 9.5%, and for the last 12 months is 17.2%. Over the same period the benchmark SPY performance was 11.4% and 15.9% respectively. Over the previous week the market value of the iM-Composite (SH-RSP) Timer gained 0.39% at a time when SPY gained 0.53%. A starting capital of $100,000 at inception on 6/30/2016 would have grown to $120,288 which includes $1,074 cash and excludes $513 spent on fees and slippage. |
|
|
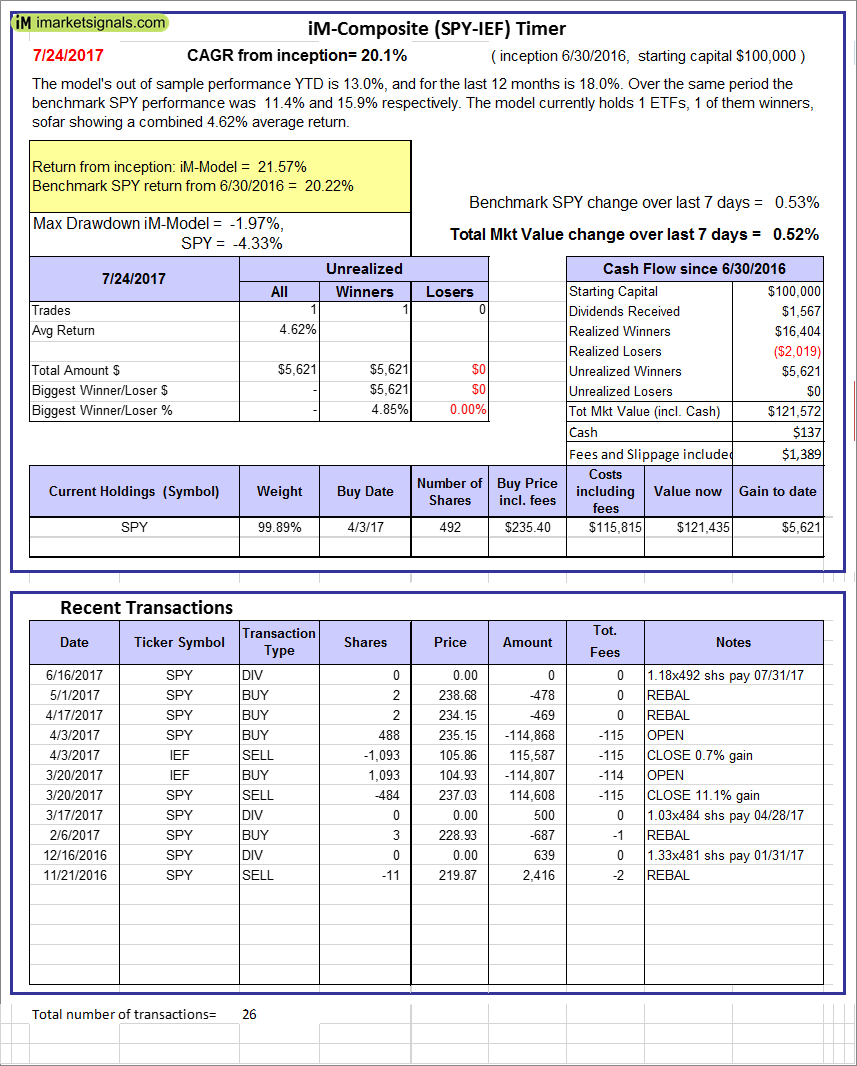
iM-Composite (SPY-IEF) Timer: The model’s out of sample performance YTD is 13.0%, and for the last 12 months is 18.0%. Over the same period the benchmark SPY performance was 11.4% and 15.9% respectively. Over the previous week the market value of the iM-Composite (SPY-IEF) Timer gained 0.52% at a time when SPY gained 0.53%. A starting capital of $100,000 at inception on 6/30/2016 would have grown to $121,572 which includes $137 cash and excludes $1,389 spent on fees and slippage. |
|
|
iM-Composite(Gold-Stocks-Bond) Timer: The model’s out of sample performance YTD is 19.6%, and for the last 12 months is 23.7%. Over the same period the benchmark SPY performance was 11.4% and 15.9% respectively. Over the previous week the market value of the iM-Composite(Gold-Stocks-Bond) Timer gained 1.78% at a time when SPY gained 0.53%. A starting capital of $100,000 at inception on 6/30/2016 would have grown to $124,246 which includes $53 cash and excludes $1,955 spent on fees and slippage. |
|
|
iM-Low Turnover Composite Timer Combo: The model’s out of sample performance from inception is 2.6%. The benchmark SPY performance over the same period is 6.1%. Over the previous week the market value of the iM-Low Turnover Composite Timer Combo gained 0.27% at a time when SPY gained 0.53%. A starting capital of $100,000 at inception on 3/24/27 would have grown to $102,619 which includes $595 cash and excludes $69 spent on fees and slippage. |
|
|
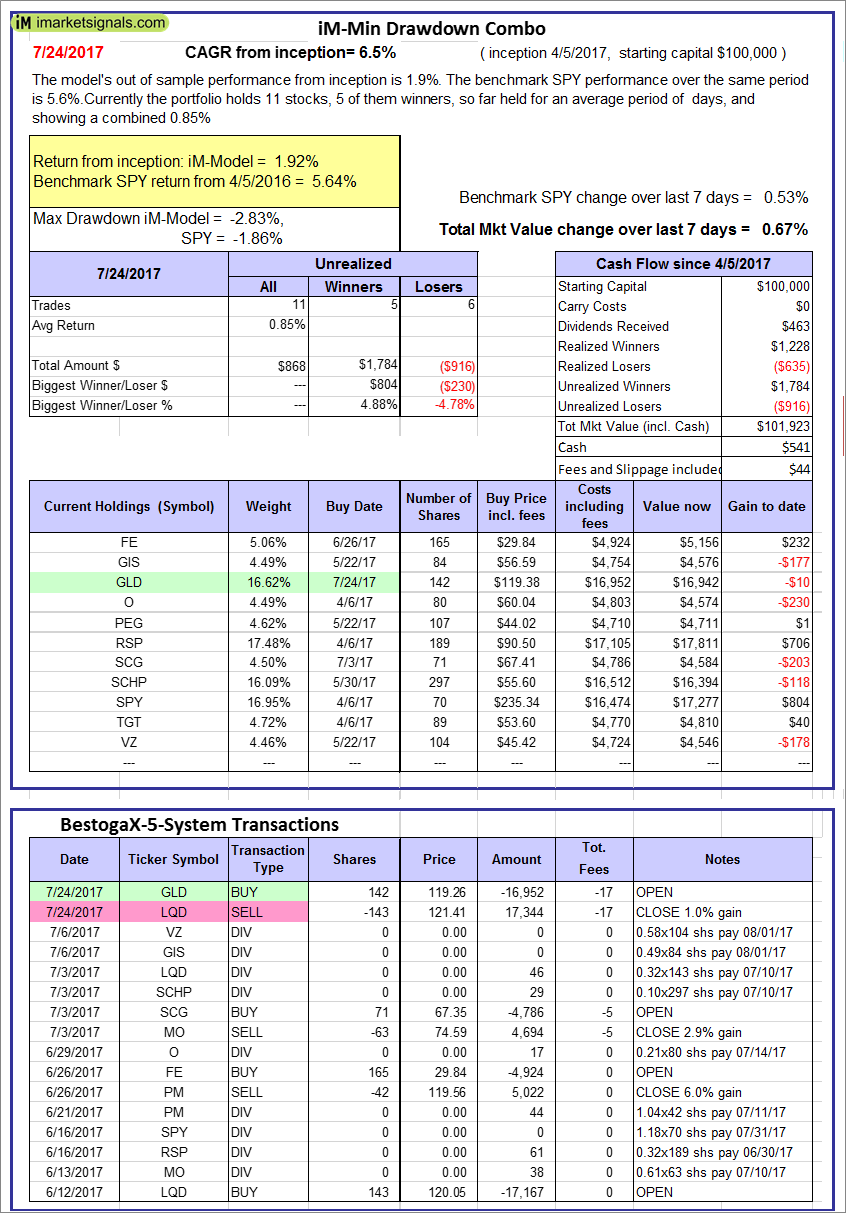
iM-Min Drawdown Combo: The model’s out of sample performance from inception is 1.9%. The benchmark SPY performance over the same period is 5.6%. Over the previous week the market value of the iM-Min Drawdown Combo gained 0.67% at a time when SPY gained 0.53%. A starting capital of $100,000 at inception on 4/5/2017 would have grown to $101,923 which includes $541 cash and excludes $44 spent on fees and slippage. |
|
|
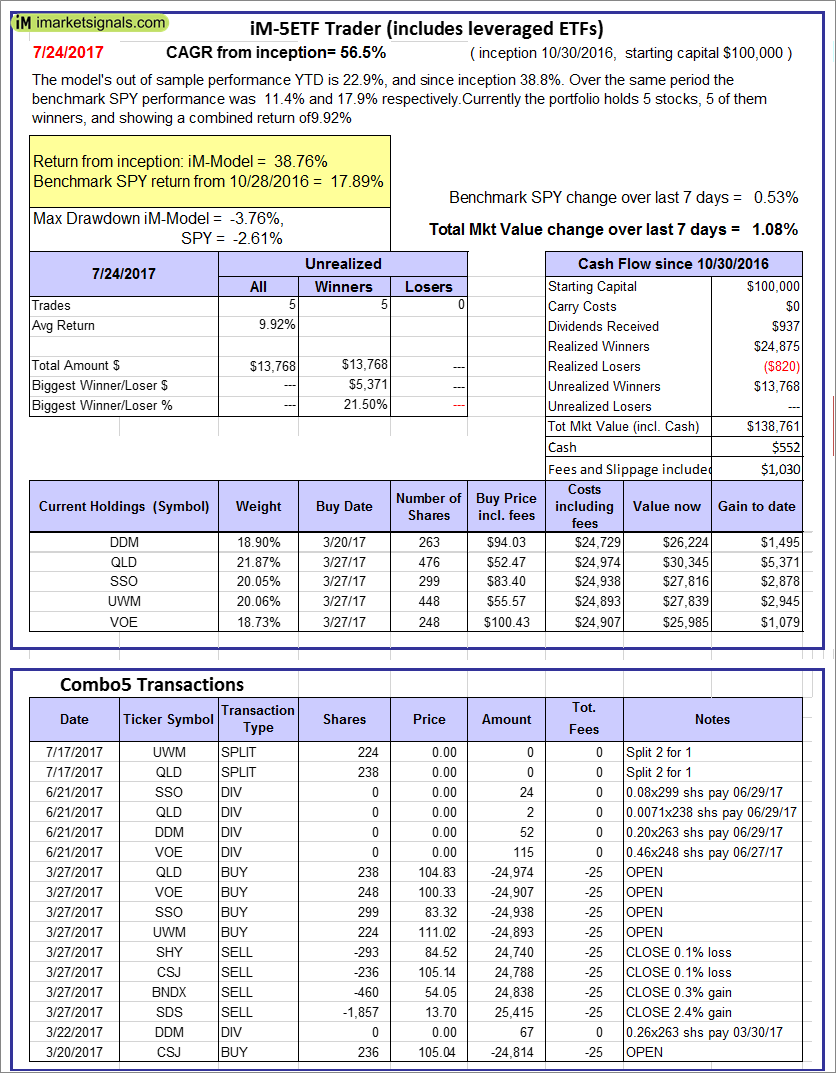
iM-5ETF Trader (includes leveraged ETFs): The model’s out of sample performance YTD is 12.2%, and since inception 15.3%. Over the same period the benchmark SPY performance was 11.4% and 17.9% respectively. Over the previous week the market value of the iM-5ETF Trader (includes leveraged ETFs) gained 1.08% at a time when SPY gained 0.53%. A starting capital of $100,000 at inception on 10/30/2016 would have grown to $138,761 which includes $552 cash and excludes $1,030 spent on fees and slippage. |
|
|
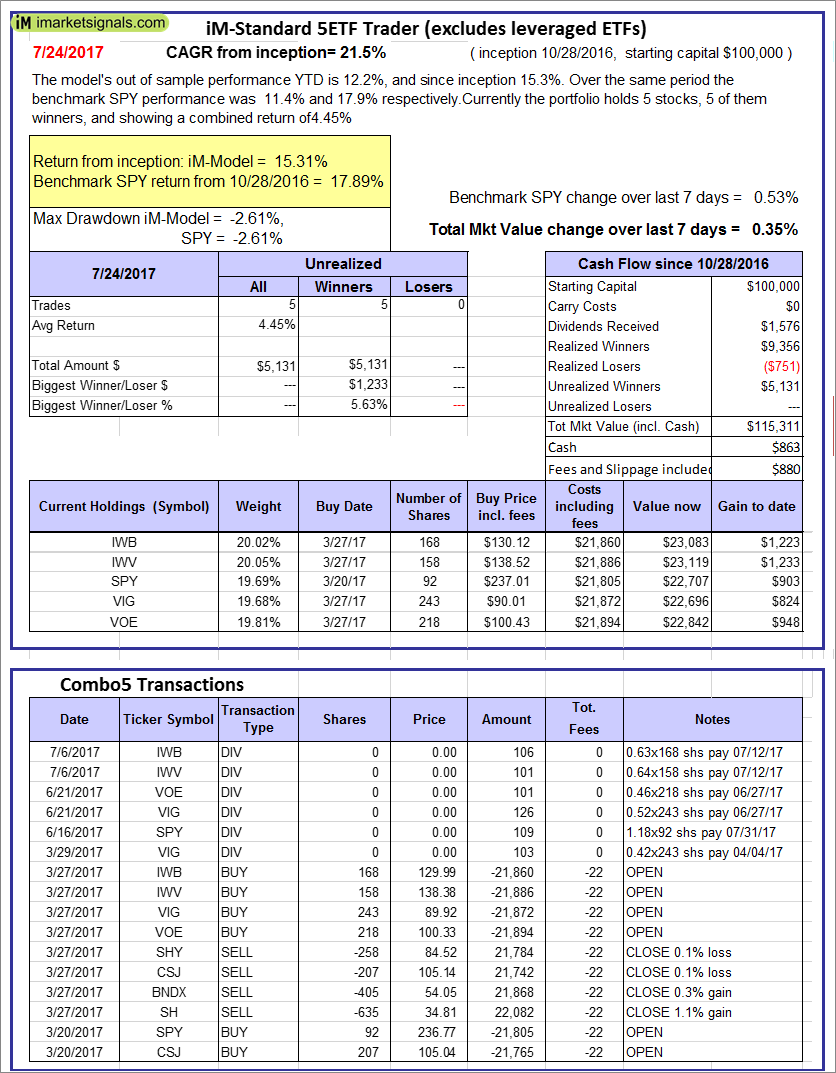
iM-Standard 5ETF Trader (excludes leveraged ETFs): The model’s out of sample performance YTD is 12.2%, and since inception 15.3%. Over the same period the benchmark SPY performance was 11.4% and 17.9% respectively. Over the previous week the market value of the iM-Standard 5ETF Trader (excludes leveraged ETFs) gained 0.35% at a time when SPY gained 0.53%. A starting capital of $100,000 at inception on 10/30/2016 would have grown to $115,311 which includes $863 cash and excludes $880 spent on fees and slippage. |


Leave a Reply
You must be logged in to post a comment.