- This system invests in well capitalized companies with strong market positions, which pay good dividends, have price appreciation potential, and provide a degree of downside protection during bear markets.
- The portfolio holds six large-cap stocks selected from a universe of twenty Russell 1000 Index stocks with Capital Strength type characteristics, rebalanced quarterly in January, April, July and October.
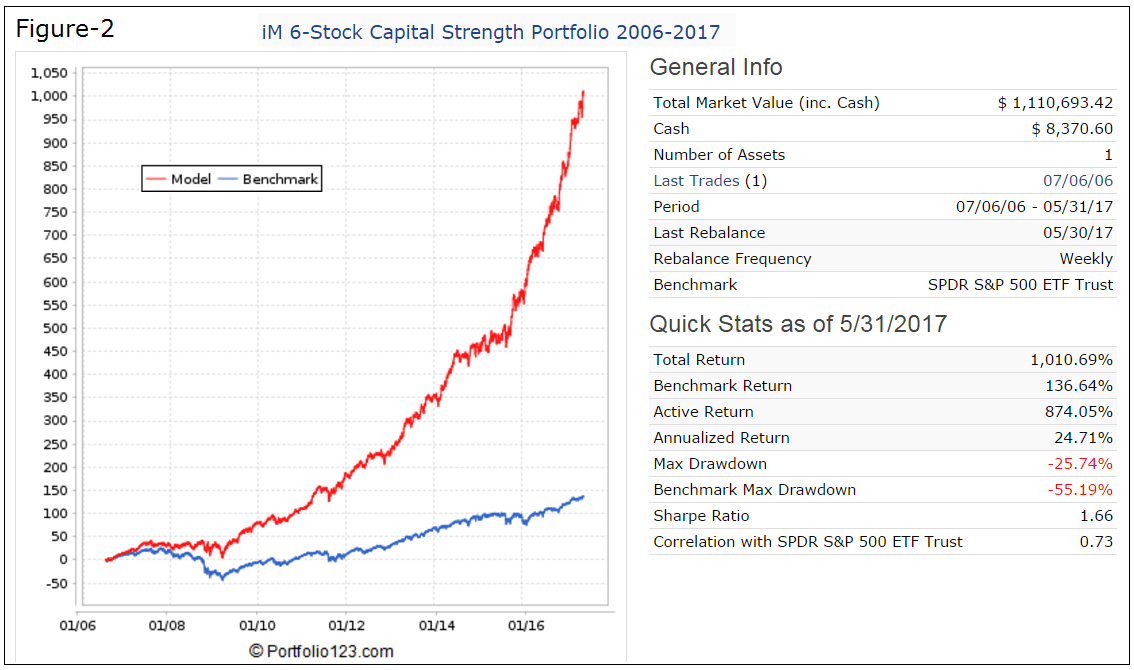
- A backtest, from 7/6/2006 (inception of FTCS) to 5/31/2017, showed a 24.7% annualized return with a maximum drawdown of -25.7%, and low average annual turnover of about 80%.
- Over the same period the First Trust Capital Strength ETF (FTCS), which selects stocks from the NASDAQ Index, produced only 9.63% annualized return with a maximum drawdown of -53.6%.
- FTCS’s performance is not much better than that for SPY (the ETF tracking the S&P 500), which over this period returned 8.25% annualized, with a maximum drawdown of -55.2%.
Investors holding FTCS are probably well satisfied with the performance of this 50-stock ETF with gains of 13.2% this year, and 17.7% over one year, to May-31. However, one can do much better by designing one’s own capital strength universe and portfolio. The system described here is the iM 6-Stock Capital Strength Portfolio which always holds six stocks selected from the iM-Capital Strength Universe. The backtest showed high gains of 19.7% for this year, and 42.9% over one year, to May-31-2017.
The iM-Capital Strength Universe
The Capital Strength IndexSM stock qualification criteria were modified to select stocks for the iM-Capital Strength Universe. The stocks come from the Russell 1000 Index and must:
- have a minimum three-month average daily dollar Trading Volume of $10-million;
- have a Cost of Capital less than the Return on Capital;
- after meeting criteria 1 and 2, be in the top 500 securities by Market Capitalization;
- have at least $1-billion in Cash or $1.1-billion of Short Term Investments;
- have a Long Term Debt to Market-Cap ratio less than 30%;
- have a Return on Equity greater than 15%;
- have a compound annual growth rate of Earnings per Share over the last 3 years greater than 2.5%;
- and have a Short Interest Ratio of 9 days or less.
The universe is then reduced to 20 stocks by sorting eligible companies according to the Sales percent change (recent Quarter vs Quarter 1 year ago), and Average Dividend Yield over the last 60 months.
The Ranking System
Stocks are ranked by a dividend yield-and-growth combination ranking system with four factors:
- Dividend Yield (%), using the Indicated Annual Dividend;
- Dividend Percent Change, Year over Year (%);
- Dividend Growth Rate, 3 Years (%);
- Dividend Yield, 5 Year Average (%).
Factor-1 has a weight of 70% and the remaining 10% each.
Buy Rules
Stocks may not occupy more than 40% of any specific sector of the Global Industry Classification Standard. The only other buy rule is for stocks to have 3- and 5-year Beta values less than 1.30 during weak economic conditions as signaled by the iM Composite Market Timer.
Sell Rules
If current positions fall out of the universe then these stocks are only sold at time of rebalancing, but stocks subject to corporate mergers or offers to buy are sold immediately.
Trading Effort
The average annual turnover for this system from 2000 to 2017 was only about 80%. Stocks are equally weighted initially and on each rebalancing effective date. The portfolio is reconstituted and rebalanced quarterly, on the first trading day of the last week of January, April, July, and October, which corresponds within a few days to the rebalancing times of the Capital Strength Index.
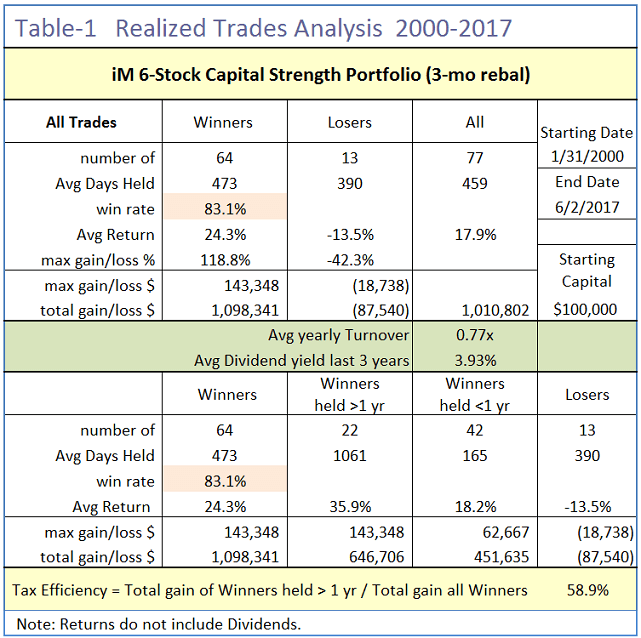
Thus, very little effort is required to follow this model as there were only 77 realized trades from 2000 to 2017. Also 35% of all trades had a holding period longer than one year, providing tax efficiency if traded in an account which is not tax deferred. Additionally there were 128 minor adjustment trades resulting from rebalancing.
|
Holding period |
Pct. of all trades |
Number of trades 2000-2017 |
|
7-21 days |
– |
0 |
|
22-42 days |
– |
0 |
|
43-92 days |
27.3% |
21 |
|
93-183 days |
22.1% |
17 |
|
184-240 days |
– |
0 |
|
241-365 days |
15.6% |
12 |
|
More than a year |
35.1% |
27 |
Table-1 shows further details of all realized trades from the backtest. The system produced a win rate of 73% and provided an average 3.9% dividend yield over the last three years. The average return for all 77 trades was 17.9%.
Performance Comparison with First Trust Capital Strength ETF and other Funds
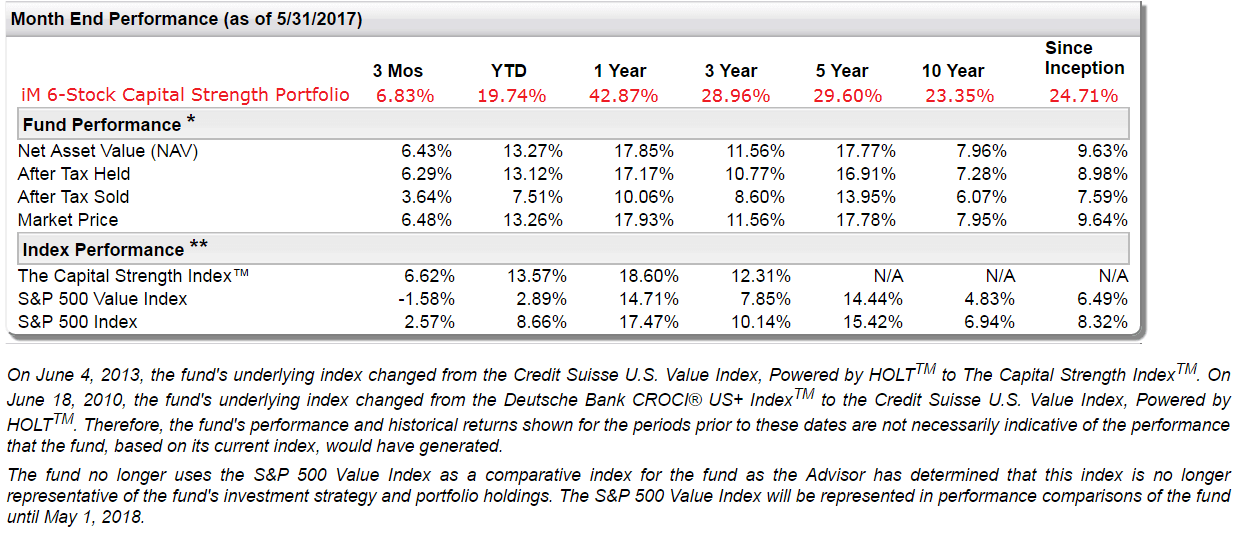
The performance comparison is shown in the table below (which comes from the First Trust website) with the iM 6-Stock Capital Strength Portfolio returns superimposed and shown in red. The beginning date of the backtest simulation was the same as the inception date of FTCS, Jul-6-2006. It is apparent that for all periods iM 6-Stock Capital Strength Portfolio out-performed the ETF FTCS, the Capital Strength Index, the S&P 500 Value Index, and the S&P 500 Index.
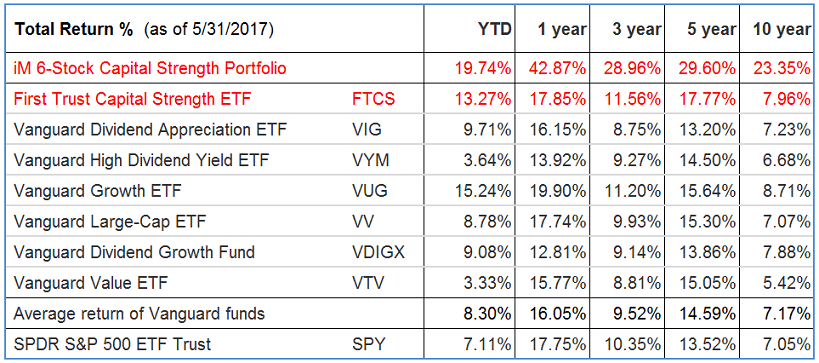
Additional performance comparisons are shown in the table below. It is apparent that for all periods the iM 6-Stock Capital Strength Portfolio significantly out-performed ETFs FTCS, the Vanguard Large-Caps, and SPY.
Performance 2000-2017
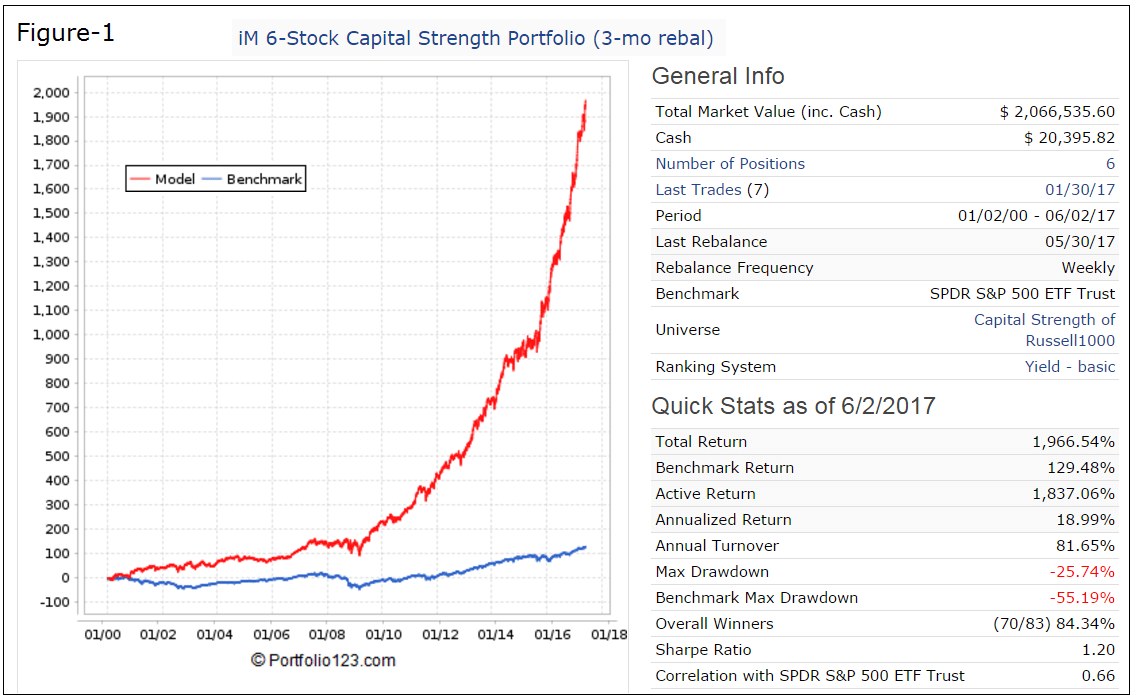
Performance from Jan-2000 to May-2017 is shown in Figure-1. The model produced an annualized return of 19.0% with a -25.7% maximum drawdown. An initial investment of $100 would have grown to $2,066 from Jan-2000 to end of May-2017. The maximum drawdown was significantly less than for benchmark SPY, the ETF tracking the S&P500, which can be attributed to the superior performance of Capital Strength type stocks during market downturns.
This model shows a very low average annual turnover of about 81% (0.8 x). The average holding period of a position was 459 days and share price was taken as the closing price for the day. Trading cost, including slippage, was taken as approximately 0.15% of trade amounts.
Performance 2006-2017
Performance from Jul-2006 to May-2017 is shown in Figure-2, which is an extract from the overall performance shown in Figure-1 beginning at the inception of ETF FTCS. The model produced an annualized return of 24.7% with a -25.7% maximum drawdown, while FTCS produced only a 9.63% annualized return with a maximum drawdown of -53.6% over this period.
Performance 2009-2017
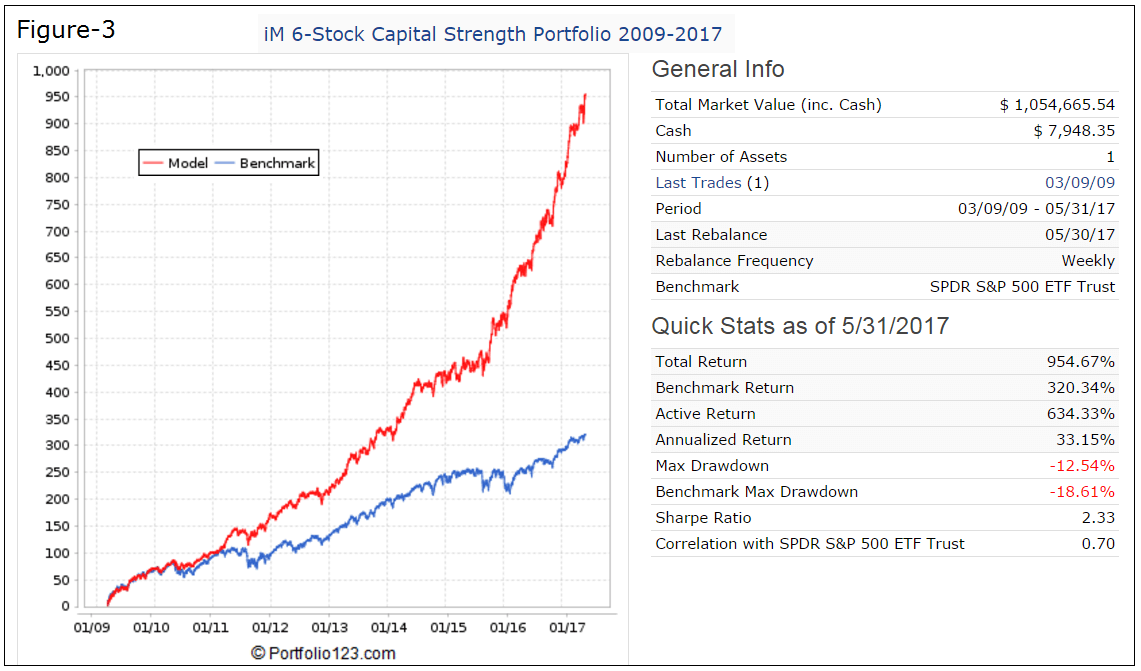
The simulated performance from Mar-9-2009 to May-31-2017 is shown in Figure-3. The start date for this period is the date when the S&P 500 was at its lowest level during the financial crisis recession. For the approximately 8-year long backtest period the simulated annualized return was 33.2% with a maximum drawdown of -12.5% producing about three times the total return of SPDR S&P 500 ETF (SPY) with lower drawdown.
Risk Measurements of the iM 6-Stock Capital Strength Portfolio
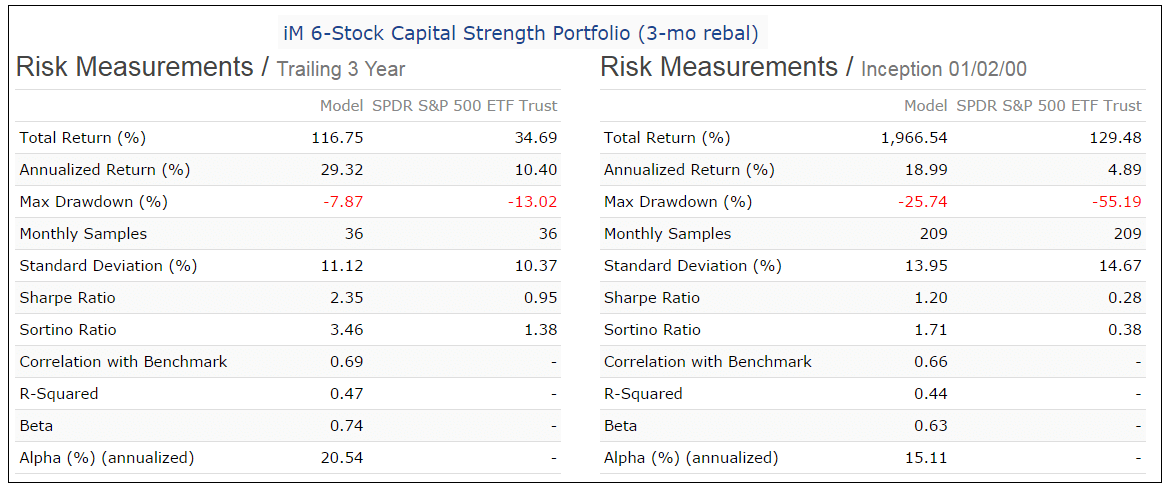
Risk measurements are from Portfolio 123. The iM 6-Stock Capital Strength Portfolio appears to be less risky than buy-and-hold of SPY, as confirmed by the low Standard Deviation and Beta, and high Sharpe- and Sortino Ratios. Alpha indicated excess returns relative to return of the benchmark SPY is about 15% annualized.
Portfolio holdings of the iM 6-Stock Capital Strength Portfolio
|
Holdings 6/11/2017 |
|||||
|
Ticker |
Name |
MktCap $-Billion |
|
Sector Code |
Yield (%) |
|
BA |
Boeing Co |
115.2 |
INDUSTRIAL |
3.03 |
|
|
BBY |
Best Buy Co Inc |
18.6 |
DISCRETIONARY |
2.28 |
|
|
CSCO |
Cisco Systems Inc |
159.8 |
TECH |
3.63 |
|
|
EMR |
Emerson Electric Co. |
38.2 |
INDUSTRIAL |
3.24 |
|
|
HPQ |
HP Inc |
31.9 |
TECH |
2.80 |
|
|
MO |
Altria Group Inc |
145.4 |
|
STAPLE |
3.25 |
Following the model
The backtest indicates above market returns with drawdowns better than for the broader market, as one would expect from a system investing in Capital Strength type stocks.
Sufficient information has been provided here to replicate this model by anybody having basic financial modelling knowhow and access to comprehensive stock data such as is available at Portfolio 123. However, on iMarketSignals we will also report the performance and the quarterly trading signals.
Appendix
Performance of the iM 20-Stock Capital Strength Universe 2006-2017
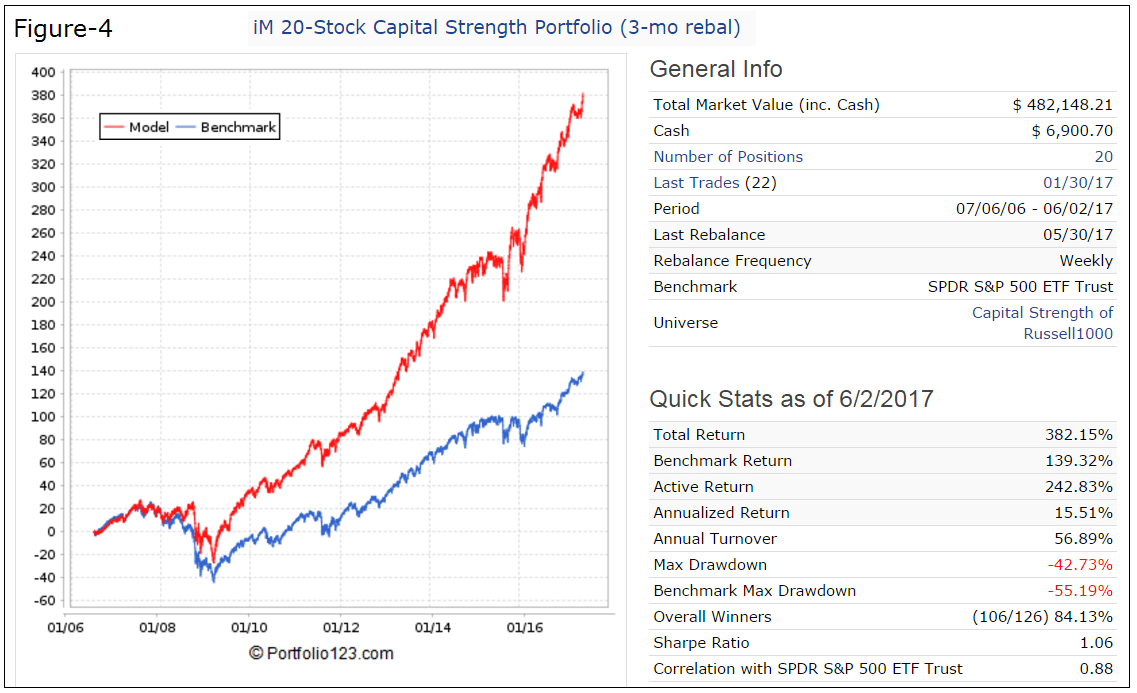
The portfolio of 20 stocks is reconstituted and rebalanced quarterly, on the first trading day of the last week of January, April, July, and October. Performance can be directly compared with FTCS, since there are no buy or sell rules and the model is always fully invested.
Performance from Jul-2006 to end of May-2017 is shown in Figure-4. The model produced an annualized return of 15.5% with a -42.7% maximum drawdown. An initial investment of $100 would have grown to $482.
This universe has a very low average annual turnover of about 56% (0.6 x). The average holding period of a position was 530 days and share price was taken as the closing price for the day. Trading cost, including slippage, was taken as approximately 0.15% of trade amounts.
Performance YTD 1-Year 3-Year 5-Year 10-Year
to 5/31/2017 9.44% 21.25% 21.32% 20.58% 15.24%
It is apparent that for all periods, except YTD, the iM 20-Stock Capital Strength Universe out-performed ETF FTCS, the Vanguard large-cap funds listed further up, and SPY by a wide margin.
Holdings of the iM 20-Stock Capital Strength Universe
|
Holdings 6/11/2017 |
||||
| Ticker | Name | MktCap | SectorCode | Yield |
| BA | Boeing Co | 115.1 | INDUSTRIAL | 2.99 |
| BAX | Baxter International Inc | 32.0 | HEALTHCARE | 1.09 |
| BBY | Best Buy Co Inc | 17.8 | DISCRETIONARY | 2.34 |
| CLX | Clorox Co (The) | 17.7 | STAPLE | 2.45 |
| CSCO | Cisco Systems Inc | 156.8 | TECH | 3.7 |
| DD | E. I. du Pont de Nemours and Co | 71.9 | MATERIALS | 1.83 |
| DPS | Dr Pepper Snapple Group Inc | 16.8 | STAPLE | 2.54 |
| EMR | Emerson Electric Co. | 39.1 | INDUSTRIAL | 3.16 |
| GD | General Dynamics Corp | 60.2 | INDUSTRIAL | 1.68 |
| HAS | Hasbro Inc. | 13.5 | DISCRETIONARY | 2.11 |
| IPG | Interpublic Group of Companies Inc. (The) | 9.5 | DISCRETIONARY | 2.99 |
| JNJ | Johnson & Johnson | 354.5 | HEALTHCARE | 2.55 |
| KMB | Kimberly-Clark Corp | 45.7 | STAPLE | 3.01 |
| MMM | 3M Co | 123.6 | INDUSTRIAL | 2.27 |
| MO | Altria Group Inc | 146.0 | STAPLE | 3.23 |
| RAI | Reynolds American Inc | 93.2 | STAPLE | 3.12 |
| RPM | RPM International Inc | 7.4 | MATERIALS | 2.16 |
| RTN | Raytheon Co. | 46.8 | INDUSTRIAL | 1.98 |
| WSM | Williams-Sonoma Inc. | 4.2 | DISCRETIONARY | 3.22 |
| WSO | Watsco Inc. | 5.2 | INDUSTRIAL | 2.87 |
Disclaimer
Note: All performance results are hypothetical and the result of backtesting over the period 2000 to 2017. No claim is made about future performance.

George –
You say this is a 3 month rebalance, but in the simulation it shows rebalance as weekly. Am i missing something here?
Yes, that is the case, but the model follows the sell rules which have been specified to rebalance only quarterly. Here are the realized trades:
Symbol — Open — Close — Days
ABT 1/31/2000 10/30/2000 273
K 1/31/2000 7/29/2002 910
SHW 1/31/2000 7/31/2000 182
EMR 1/31/2000 7/31/2000 182
CPB 1/31/2000 10/29/2001 637
HON 7/31/2000 10/30/2000 91
PBI 7/31/2000 7/29/2002 728
KODK 7/31/2000 10/27/2003 1183
ROK 10/30/2000 1/29/2001 91
SHW 10/30/2000 10/29/2001 364
GPC 1/29/2001 7/25/2005 1638
CVX 10/29/2001 7/26/2004 1001
HSH^14 10/29/2001 10/28/2002 364
AT.2^07 7/29/2002 10/28/2002 91
MRK 7/29/2002 4/28/2003 273
PBI 10/28/2002 4/28/2003 182
SGP^09 10/28/2002 1/26/2004 455
ABT 4/28/2003 10/27/2003 182
T 4/28/2003 1/31/2005 644
MRK 10/27/2003 7/30/2007 1372
AVY 10/27/2003 4/26/2004 182
HSH^14 1/26/2004 10/30/2006 1008
XOM 4/26/2004 7/26/2004 91
LB 7/26/2004 10/25/2004 91
MMC 7/26/2004 4/25/2005 273
KO 10/25/2004 1/31/2005 98
AJG 1/31/2005 4/30/2012 2646
PPG 1/31/2005 4/25/2005 84
BMY 4/25/2005 10/31/2012 2746
KMB 4/25/2005 1/29/2007 644
AVY 7/25/2005 10/31/2005 98
PPG 10/31/2005 7/31/2006 273
VFC 7/31/2006 10/30/2006 91
MAS 10/30/2006 1/29/2007 91
DD 10/30/2006 4/28/2008 546
CVX 1/29/2007 10/29/2007 273
EXC 1/29/2007 4/30/2007 91
DOW 4/30/2007 10/29/2007 182
MCHP 10/29/2007 1/31/2011 1190
MAT 10/29/2007 7/28/2008 273
GPC 4/28/2008 10/27/2008 182
PAYX 7/28/2008 1/31/2011 917
MAT 10/27/2008 7/27/2009 273
VFC 10/27/2008 1/26/2009 91
GPC 1/26/2009 4/27/2009 91
MRK 4/27/2009 1/25/2010 273
CVX 7/27/2009 4/26/2010 273
SYY 1/25/2010 4/26/2010 91
LO^15 4/26/2010 4/28/2014 1463
JNJ 4/26/2010 7/26/2010 91
KMB 7/26/2010 10/25/2010 91
LLY 10/25/2010 10/31/2012 737
HRB 1/31/2011 4/25/2011 84
KMB 1/31/2011 4/25/2011 84
MO 4/25/2011 4/30/2012 371
RTN 4/25/2011 10/31/2012 555
RAI 4/30/2012 7/25/2016 1547
HAS 4/30/2012 4/29/2013 364
INTC 10/31/2012 7/28/2014 635
MCHP 10/31/2012 4/29/2013 180
SCCO 10/31/2012 1/28/2013 89
LMT 1/28/2013 7/25/2016 1274
RTN 4/29/2013 10/28/2013 182
SCCO 4/29/2013 7/29/2013 91
MXIM 7/29/2013 1/27/2014 182
COP 10/28/2013 4/27/2015 546
CVX 1/27/2014 4/28/2014 91
MAT 4/28/2014 7/25/2016 819
MCD 7/28/2014 1/25/2016 546
XLNX 4/27/2015 10/26/2015 182
MRK 10/26/2015 4/25/2016 182
EMR 1/25/2016 4/25/2016 91
LVS 7/25/2016 10/31/2016 98
HPQ 7/25/2016 10/31/2016 98
GPC 10/31/2016 1/30/2017 91
Can you provide the CUSIP or historical prices on trading/re-balancing days for HSH^14, AT.2^07, SGP^09, LO^15?
^14, etc. indicates the year when the stock was de-listed.
HSH^14, Hillshire Brands Co (HSH^14) – NYSE
AT.2^07, ALLTEL Corp (AT.2^07) – NYSE
SGP^09, Schering-Plough (SGP^09) – NYSE
LO^15, Lorillard Inc (LO^15) – NYSE
Very interesting thanks. I’m reproducing this in Portfolio123 to understand what it’s doing.
1) How did you implement cost of capital?
2) To reduce the universe to 20 stocks, how do you sort by both the sales growth and dividend yield? Do you sort by the sum of the two?
Georg, Another great portfolio. Wondering about hedging with combo
65% 6 stock and 35% SH/RSP?
These two models have a very low correlation of 0.11 to each other.
Better combo allocation would be 50:50
Period 12/31/99 – 06/09/17
Last Rebalance 06/05/17
Rebalance Frequency Weekly
Benchmark S&P 500
Quick Stats as of 6/9/2017
Total Return 3,777.17%
Benchmark Return 65.51%
Active Return 3,711.66%
Annualized Return 23.33%
Max Drawdown -26.67%
Benchmark Max Drawdown -56.78%
Sharpe Ratio 1.65
Georg, yet another wonderful portfolio. I am currently using two others and am very pleased with the results. Where will you be posting the Quarterly results for this portfolio? Is this only available via subscription to P123?? Please advise. Thanks!
The Capital Strength Stocks of the Russell 1000 is updated quarterly; the next update will only be at the end of July. It will be reported in the Gold section of iM, not on P123. Performance reports will also start at the end of July.
If one were to invest in this portfolio which option would be best
To invest in all 6 stocks
or to invest as each new buy recommendation?
Thank You
We are not Financial Advisors, therefore we cannot answer your question.
Georg, This is a nice model. The thoughts behind it make a lot of sense. This will work great for our taxable reserve account. I was wondering if the returns and max drawdown would improve over quarterly rebalancing. Have you ran the model with more frequent re-balancing with ranges from weekly to monthly? If so, could you provide the results. For those with tax deferred accounts (IRAs, Solo(k)s, etc., this could be an advantage. Mike
This model’s returns do not improve much with more frequent rebalancing, because the stocks in the 20 position universe are all of high quality. There is not much to be gained by frequently replacing a good stock with another good stock that is marginally higher ranked.
Nice. Can you provide the chart that shows the annual returns vs the benchmark (including the values)? Thanks.
Can you review your 6-stock Capital Strength holdings and your 20-stock CS holdings. I thought you picked the 6 highest ranking from the 20 list. If so, it appears either the 20 rankings are off or the published 6 holdings are off. Also, the latest trade date for the 6 holdings should be ‘July’ and it shows as January. Thanks.
Thank you for bringing the incorrect date to our attention. It has now been corrected. The applicable 20 stock list would be as of 7/30/2017, not the current list.
The results in the Appendix for 20 stocks is are quite good. Can you provide the quick stats for the same period (3 mo rebal) with just 10 stocks?
Georg, you provided the annual returns of the tax-efficient version of this model vs the S&P 500. Is the same information available for this model as well? Thanks.
Georg & Anton:
Great model. I have 2 questions:
1)If we were at quarter end (i.e. 4/30/19), my understanding is that IPG, PAYX & WSO would be replaced because they have fallen out of the top 20, correct? and,
2)When the replacements are selected, (assuming, the stocks don’t go over the industry weighting) are they selected from the current ranking list from top to bottom? Currently, that would mean adding: CLX, PKG & CHRW.
Just trying to completely understand process.
Thanks in advance for your work and your reply,
JMc
Please read my comment below, which also applies to your question.
This is quarterly rebalance time and the model is moving Paychex out.
IPG & PFE are not in this week’s 20 universe.
Why are they not being swapped out?
Thanks
IPG and PFE are not in the currently generated universe, but they were not sold because of rank.
Positions are forced into the model Universe when they would otherwise fall out but still satisfy rank requirements. Therefore the Universe for the model can hold more than 20 stocks, unlike the weekly generated universe which is limited to 20 stocks.
When IPG and PFE eventually become lower ranked than other/newer positions in the Universe they will be sold and will be no longer in the model Universe.
Hi Georg,
Can you comment what you mean precisely with:
“after meeting criteria 1 and 2, be in the top 500 securities by Market Capitalization”
It suggests that after applying rule 1 and rule 2 you’re still left with 500+ symbols out of the Russell 1000 but I doubt if that will ever be true.
PV
Currently, after applying rule 1 and rule 2 there are 547 stocks left.
Rule 3 reduces this to 500.
Georg,
“The universe is then reduced to 20 stocks by sorting eligible companies according to the Sales percent change (recent Quarter vs Quarter 1 year ago), and Average Dividend Yield over the last 60 months”.
When sorting on two variables, its either a double sort or a single sort on a formula applied to the two variables. I presume it’s a formula in this case, perhaps the sum of the two percentages. Can you confirm or otherwise share the formula?
PV
1st sort: according to the Sales percent change (recent Quarter vs Quarter 1 year ago),
2nd sort: according to Average Dividend Yield over the last 60 months.