
- If the unemployment rate is higher than three months ago the model exits the stock market and enters the bond market, and re-enters the market when the unemployment rate is equal or lower than where it was three months ago.
- From 2001 to 2016 switching between bonds and stocks provided significant benefits. This strategy would have produced an average annual return of 13.0% versus only 5.2% for buy&hold stocks.
- Using long-term data from 1973 to 2016 for stocks and bonds confirms the unemployment rate (UNEMP) as a profitable stock market timer.
- From 1973 to 2001 buy&hold stocks was an acceptable strategy. Market timing with UNEMP during this period provided no disadvantage, as both strategies delivered the same 13.4% average annual return.
For the period 2001-2016 the buy&hold strategy no longer worked! It is likely that it will also not work in the future due to increasing stock market volatility. For this reason some investor use simple market timing, mostly momentum driven, to exit and enter the markets according to market direction. Instead of relying on just one market timer, many uncorrelated market timing strategies can be designed from the comprehensive and diverse financial data that is readily available, and then combining them in a robust composite market timing model. We designed six such component timers using following:
- Unemployment Rate (UNEMP),
- Performance ratio of the Hi-Beta and Lo-Beta stocks of the S&P 500,
- TED Spread,
- Market Climate Score,
- iM Standard Timer,
- CBOE Volatility Index (^VIX),
This article describes the first of these timers; the description of the other five can be found here.
Market Timing by Unemployment Rate
This market timer rules are simple:
- Rule for exiting the stock market: If the unemployment rate is higher than three months ago; the model exits the stock market and enters the bond market.
- Rule for exiting the bond market: If the unemployment rate is equal or lower than where it was three months ago; the model exits the bond market and enters the stock market.
For the period 2001 to 2016, a backtest verified the performance of this timer. We used the on-line portfolio simulation platform Portfolio 123, which also provides extended price data for ETFs prior to their inception dates calculated from their proxies.
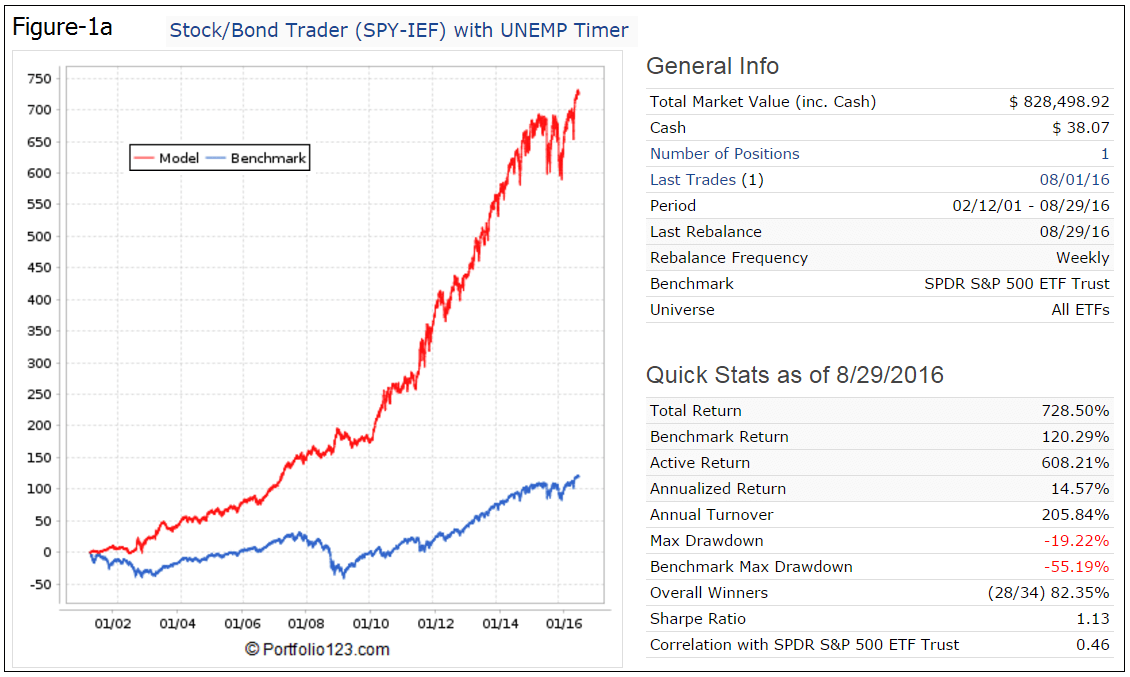
The P123 backtest elected either (SPY), the ETF tracking the S&P 500, or (LQD) as the bond fund. The P123 backtest performance is shown in Figure-1, giving an average annual return of 13.4%. (Performance when switching between SPY and (IEF) is shown in Figure-1a in the Appendix.)
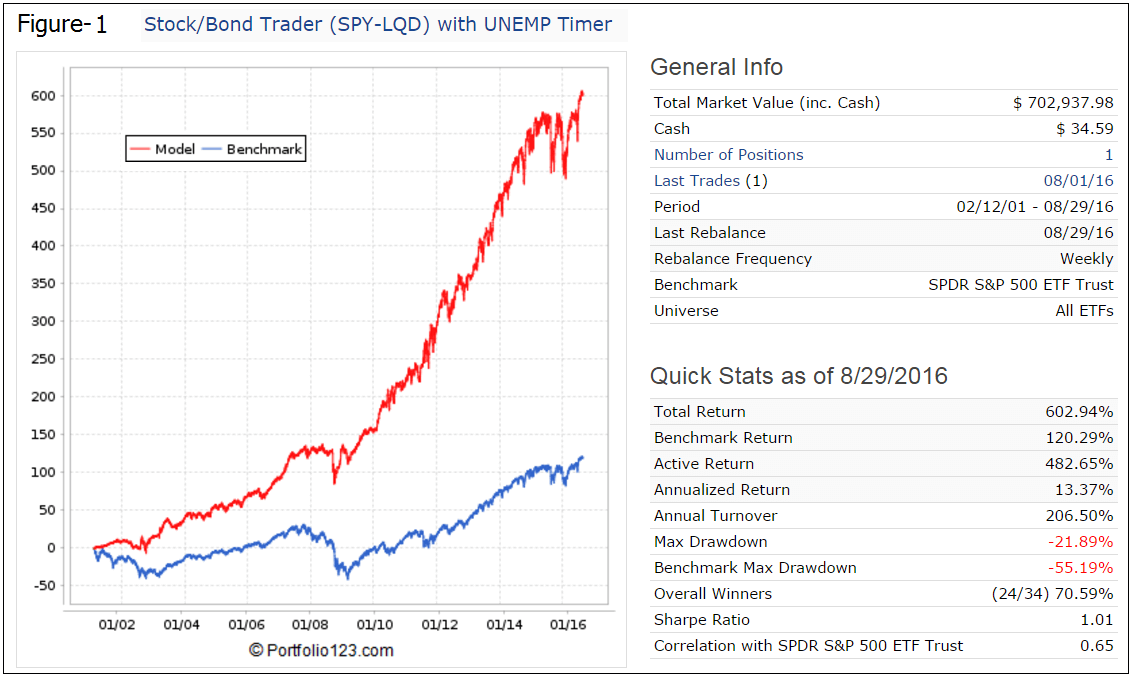
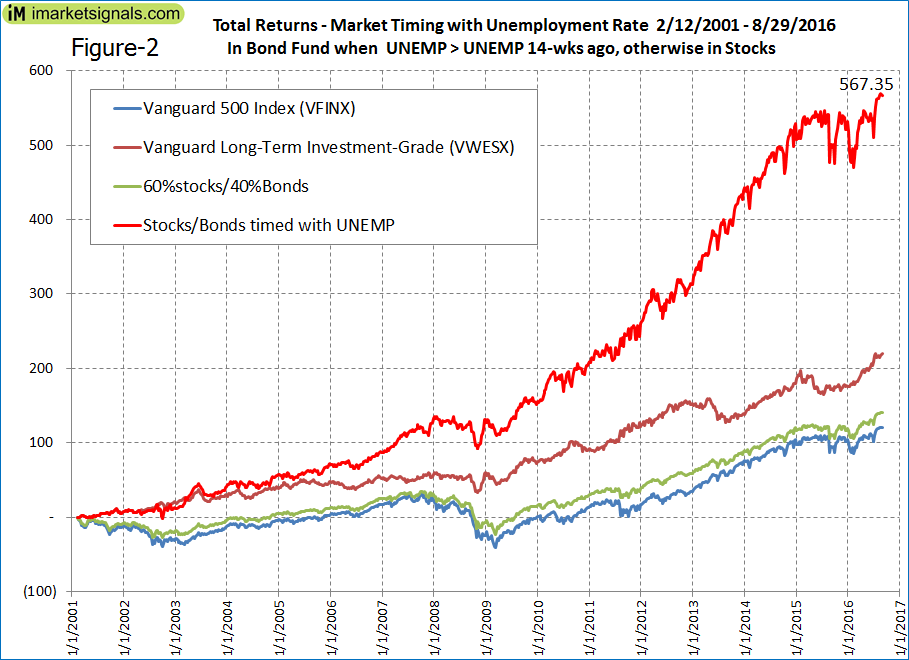
To extend this backtest we selected (VFINX) to represent the stock market performance with dividends reinvested, and (VWESX) for bonds; long term data for these are available. First we tested our choice by reproducing the P123 results in MS-Excel for the same period as the P123 backtest, and obtained 13.0% annualized return against the 13,37% of P123. Also, the total return for both analysis is equally close, 603% for the P123 backtest, and 567% for the excel analysis. (The spreadsheet analysis uses weekly data, and 14 weeks were assumed to represent 3 months. See Figure-2)
In Figure-3 the red graph represents the performance of the model from 1974 to 2016. Over this period the spreadsheet analysis of the model produced 3.0-times more than the S&P500 with dividends reinvested, and 3.7-times more than a buy-and-hold investment of 60% stocks and 40% bonds.
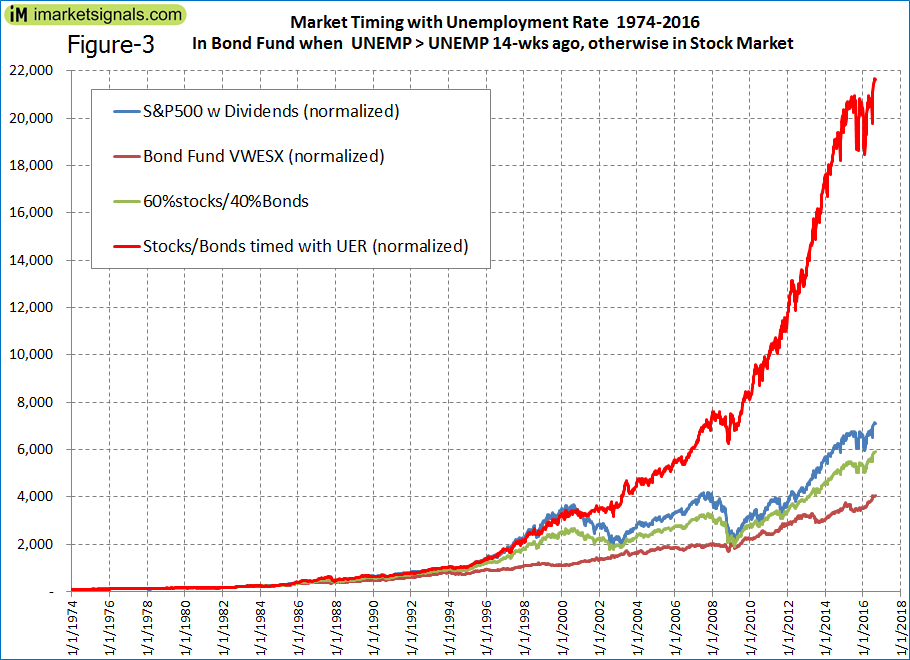
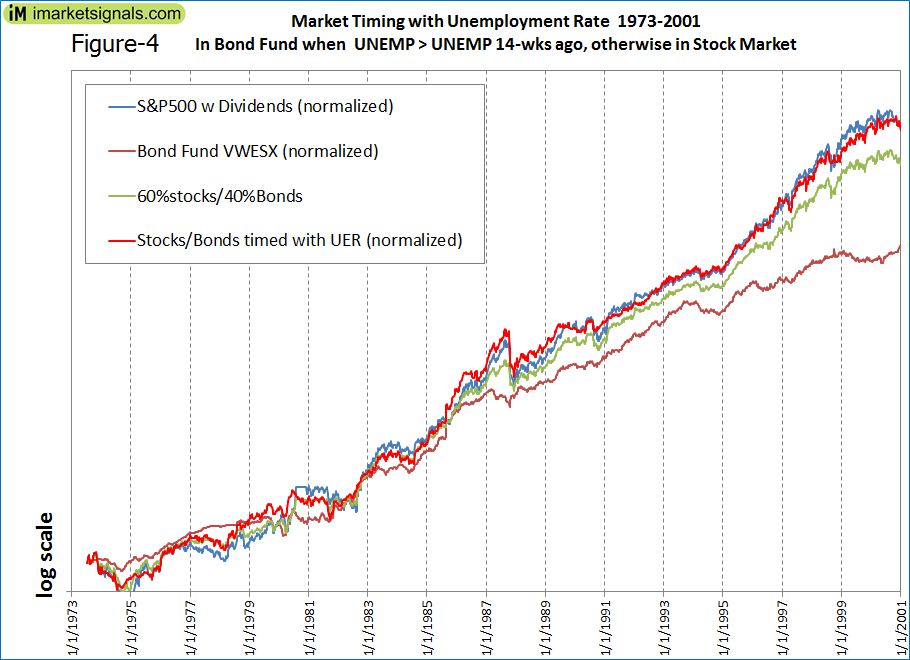
Figure-4 shows the performance from 1973 to 2001. It is plotted to a log-scale to provide a better picture of relative performance. The model closely tracked the performance of stocks, and did not provide any significant disadvantage (or advantage) over buy&hold stocks during this period.
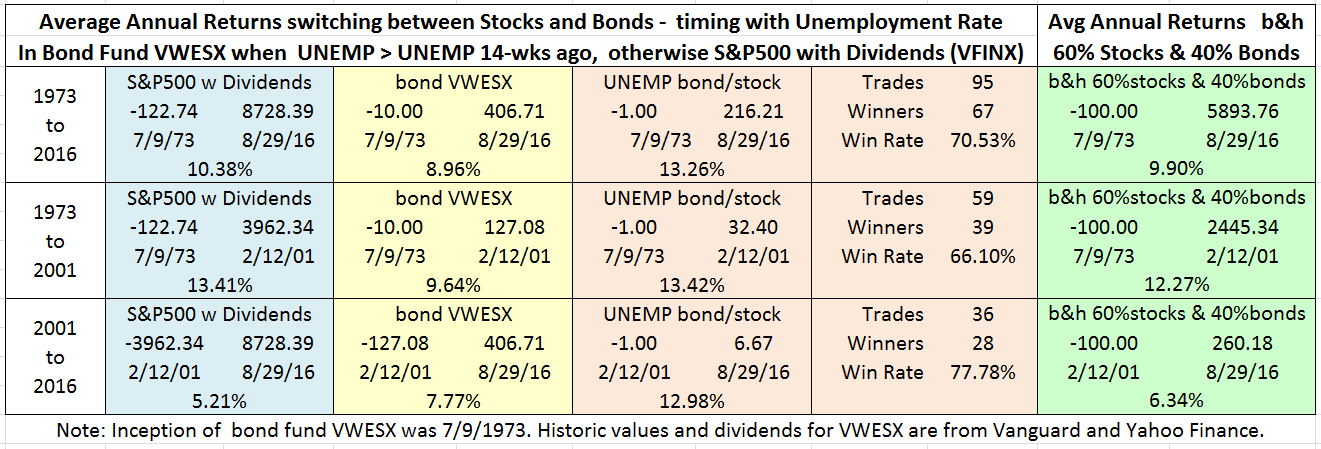
The table below shows the Annual Average Returns for various periods.
- From 1973 to 2016 (43 years) the model produced 13.3% versus 10.4% for the S&P500 with dividends reinvested.
- From 1973 to 2001 (28 years) the model matched the stock market return of 13.4%.
- The best performance was over the last 15 years, 2001 to 2016, when the model produced 13.0% versus 5.2% for the stock market. The maximum drawdown during this period was -18%, occurring in Nov-2008. During this period buy&hold stocks was a poor strategy.
- For all periods the model delivered higher returns than buy&hold 60% stocks and 40% bonds, the asset allocation recommended by most retirement fund providers.
Conclusion
From the analysis it appears that the Unemployment Rate can profitably be used as a market timer. From 2001 to 2016 the buy&hold strategy no longer worked, and it is unlikely to work in the future as well, due to stock market volatility increasing. Timing provided the same return from 1973 to 2001 as buy&hold stocks; it can be considered free insurance against major market down-turns, as occurred from 2001 to 2003, and 2008 to 2009.
Although this model performed well over the past 16 years, there is no guarantee that it will perform well in the future too. Also, rising interest rates with concurrent diminishing returns from bonds may reduce the effectiveness of bond/stock timing models.
Appendix
In the analysis we used the bond fund VWESX because it is one of the oldest funds for which we have data from inception onward. For comparison purposes, with the other timers, we show the performance with IEF in Figure 1a below.
Nice work as usual. I am sure this captured the recessionary periods and the move to bonds was profitable. How many times did the model move to bonds and when it did what percentage of the time was the return from the bonds greater than the return from stocks?
1 – 07/09/73 – 01/14/74 – stock return … -7.62%
2 – 01/14/74 – 05/13/74 – bond return … -2.88%
3 – 05/13/74 – 07/15/74 – stock return … -7.00%
4 – 07/15/74 – 08/11/75 – bond return … 10.26%
5 – 08/11/75 – 08/09/76 – stock return … 24.07%
6 – 08/09/76 – 10/11/76 – bond return … 3.10%
7 – 10/11/76 – 01/10/77 – stock return … 4.45%
8 – 01/10/77 – 02/14/77 – bond return … -0.10%
9 – 02/14/77 – 08/14/78 – stock return … 10.49%
10 – 08/14/78 – 09/11/78 – bond return … 1.51%
11 – 09/11/78 – 10/09/78 – stock return … -1.85%
12 – 10/09/78 – 11/13/78 – bond return … -0.65%
13 – 11/13/78 – 02/12/79 – stock return … 6.76%
14 – 02/12/79 – 03/12/79 – bond return … 0.12%
15 – 03/12/79 – 09/10/79 – stock return … 11.22%
16 – 09/10/79 – 12/10/79 – bond return … -4.01%
17 – 12/10/79 – 01/14/80 – stock return … 2.94%
18 – 01/14/80 – 12/08/80 – bond return … 2.29%
19 – 12/08/80 – 04/13/81 – stock return … 3.47%
20 – 04/13/81 – 05/11/81 – bond return … -2.08%
21 – 05/11/81 – 06/15/81 – stock return … 3.40%
22 – 06/15/81 – 08/10/81 – bond return … -3.50%
23 – 08/10/81 – 10/12/81 – stock return … -7.76%
24 – 10/12/81 – 02/14/83 – bond return … 37.43%
25 – 02/14/83 – 09/10/84 – stock return … 17.89%
26 – 09/10/84 – 11/12/84 – bond return … 6.89%
27 – 11/12/84 – 07/15/85 – stock return … 18.31%
28 – 07/15/85 – 09/09/85 – bond return … 14.02%
29 – 09/09/85 – 03/17/86 – stock return … 26.99%
30 – 03/17/86 – 06/16/86 – bond return … 1.36%
31 – 06/16/86 – 12/08/86 – stock return … 3.69%
32 – 12/08/86 – 12/22/86 – bond return … 0.23%
33 – 12/22/86 – 07/10/89 – stock return … 40.02%
34 – 07/10/89 – 08/14/89 – bond return … -0.23%
35 – 08/14/89 – 11/13/89 – stock return … -2.19%
36 – 11/13/89 – 03/12/90 – bond return … -1.87%
37 – 03/12/90 – 06/11/90 – stock return … 8.31%
38 – 06/11/90 – 07/09/90 – bond return … -0.27%
39 – 07/09/90 – 08/13/90 – stock return … -5.24%
40 – 08/13/90 – 09/09/91 – bond return … 18.20%
41 – 09/09/91 – 11/11/91 – stock return … -0.38%
42 – 11/11/91 – 09/14/92 – bond return … 15.36%
43 – 09/14/92 – 05/15/95 – stock return … 37.16%
44 – 05/15/95 – 08/14/95 – bond return … 0.95%
45 – 08/14/95 – 09/11/95 – stock return … 2.75%
46 – 09/11/95 – 10/09/95 – bond return … 2.14%
47 – 10/09/95 – 02/12/96 – stock return … 15.22%
48 – 02/12/96 – 03/11/96 – bond return … -4.80%
49 – 03/11/96 – 06/10/96 – stock return … 5.40%
50 – 06/10/96 – 07/15/96 – bond return … 1.06%
51 – 07/15/96 – 12/09/96 – stock return … 20.97%
52 – 12/09/96 – 03/10/97 – bond return … -1.09%
53 – 03/10/97 – 08/10/98 – stock return … 35.69%
54 – 08/10/98 – 11/09/98 – bond return … 0.24%
55 – 11/09/98 – 07/12/99 – stock return … 24.53%
56 – 07/12/99 – 08/09/99 – bond return … -3.44%
57 – 08/09/99 – 08/14/00 – stock return … 15.92%
58 – 08/14/00 – 10/09/00 – bond return … 0.44%
59 – 10/09/00 – 02/12/01 – stock return … -4.46%
60 – 02/12/01 – 04/15/02 – bond return … 8.42%
61 – 04/15/02 – 05/13/02 – stock return … -2.44%
62 – 05/13/02 – 08/12/02 – bond return … 5.40%
63 – 08/12/02 – 12/09/02 – stock return … -0.79%
64 – 12/09/02 – 03/10/03 – bond return … 6.54%
65 – 03/10/03 – 05/12/03 – stock return … 17.15%
66 – 05/12/03 – 09/08/03 – bond return … -5.15%
67 – 09/08/03 – 04/12/04 – stock return … 12.09%
68 – 04/12/04 – 05/10/04 – bond return … -4.61%
69 – 05/10/04 – 12/12/05 – stock return … 19.45%
70 – 12/12/05 – 01/09/06 – bond return … 2.29%
71 – 01/09/06 – 09/11/06 – stock return … 2.13%
72 – 09/11/06 – 10/09/06 – bond return … 1.80%
73 – 10/09/06 – 02/12/07 – stock return … 6.78%
74 – 02/12/07 – 03/12/07 – bond return … 2.50%
75 – 03/12/07 – 07/09/07 – stock return … 9.49%
76 – 07/09/07 – 10/08/07 – bond return … 3.56%
77 – 10/08/07 – 10/22/07 – stock return … -2.89%
78 – 10/22/07 – 11/12/07 – bond return … -0.28%
79 – 11/12/07 – 12/10/07 – stock return … 5.83%
80 – 12/10/07 – 05/12/08 – bond return … 1.85%
81 – 05/12/08 – 06/09/08 – stock return … -2.73%
82 – 06/09/08 – 02/08/10 – bond return … 14.92%
83 – 02/08/10 – 05/10/10 – stock return … 10.15%
84 – 05/10/10 – 06/14/10 – bond return … 0.49%
85 – 06/14/10 – 10/11/10 – stock return … 7.60%
86 – 10/11/10 – 11/08/10 – bond return … -2.40%
87 – 11/08/10 – 12/13/10 – stock return … 1.69%
88 – 12/13/10 – 01/10/11 – bond return … 1.13%
89 – 01/10/11 – 07/11/11 – stock return … 4.90%
90 – 07/11/11 – 10/10/11 – bond return … 4.91%
91 – 10/10/11 – 08/06/12 – stock return … 18.63%
92 – 08/06/12 – 09/04/12 – bond return … 0.47%
93 – 09/04/12 – 05/09/16 – stock return … 57.72%
94 – 05/09/16 – 06/06/16 – bond return … 0.92%
95 – 06/06/16 – 08/29/16 – stock return … 3.85%
This model is tested over the period of the greatest bond bull market in history. Doesn’t this imply that future performance of this model may disappoint? In fact, this may be a problem for all your systems that have a bond component. Can you discuss this? Thanks.
The model was tested from 1973 onward. The bond bull market started at the end of 1981 when the 10-yr Treasury yield was about 15%. In July 1973 the 10-yr yield was 7.4% and rose to 15.2% in August 1981.
From 7/9/73 to 8/10/81 the model’s avg annual return would have been 6.23%, Buy&Hold stocks 7.74%, bond fund VWESX 4.56%, and b&h 60%Stocks & 40%Bonds 6.55%.
The model underperformed b&h stocks, but returned about the same as 60/40 stocks/bonds.
Since we don’t know the future, it is hoped that the model should provide insurance against major market downturns and still provide reasonable returns.
Can you run the backtest substituting SH for bonds?
Using SH instead of VWESX returns are:
1973-2016 CAGR= 12.00%
1973-2001 CAGR= 11.31%
2001-2016 CAGR= 13.24%
We have calculated the value of SH prior to its inception using the formula from Jian Zhang with an interest rate= 3-mo T-Bill rate and a fund expense ratio= 1.0%.
https://www.math.nyu.edu/faculty/avellane/thesis_Zhang.pdf
Georg,
The ticked up in August to 3.9. Are we comparing this number to 3.8 (5/2018) or 4.0 (6/2018) ? See below.
4/2018 UER = 3.9
5/2018 UER = 3.8
6/2018 UER = 4.0
7/2018 UER = 3.9
8/2018 UER = 3.9 (most recent data available on UER)
If we are comparing to 8/2018 to 5/2018, we should be in bonds because the unemployment rate is higher. If we are comparing 8/2018 to 6/2018 we should still be in stocks 3.93.9 (4/2018). Your clarification would be greatly appreciated.
The timer should exit stocks soon, either end of this week or next week, depending when P123 updates the monthly number.