
- Two trading models are compared which select periodically 8 large-cap minimum volatility stocks from the Health Care, Consumer Staples, and Utilities sectors of the S&P 500.
- The models only differ from each other with regard to hedging, and sell rules which extend stock holding periods for one model to longer than one year.
- Backtests over a 15.5 year period show similar average annualized returns of about 36% for both models, but the number of realized trades differ, 148 versus 618.
- The analysis shows that in this case, and perhaps in general, frequently trading minimum volatility stocks does not necessarily produce better returns than for one year minimum holding periods.
The Minimum Volatility Stock Universe of the S&P 500
The S&P 500 is widely regarded as the best single gauge of large-cap U.S. equities and includes 500 leading companies. The present analysis compared the performance of the various S&P 500 market sectors, and found that stocks from the Health Care, Consumer Staples, and Utilities sectors exhibited lower drawdowns than the broader market and also showed reasonable returns over an extended period of time. This minimum volatility stock universe of the S&P 500 currently holds 117 large-cap stocks (market cap ranging from $4- to $277-billion), with 111 stocks in this universe 15 years ago.
The Models
The models compared are the Best8(S&P500 Min-Volatility)-Tax Efficient which holds positions mostly longer than one year, and the Best8(S&P500 Min-Volatility) which trades frequently. For both models the inception date was Jan-2-2000 and starting capital was $20,000. A web-based portfolio simulation platform was used to test the models and generate the hypothetical simulated trades and returns.
The Tax Efficient model differs from the Best8(S&P500 Min-Volatility) system as to the hedge used, but entry and exit rules for the hedge are not different. Also it has additional sell rules to ensure that positions will be held for at least one year so that long term capital gain tax rates would apply, but positions showing a loss greater than 25%, or mergers may be sold earlier. All other parameters, ranking system, etc. are the same for both models.
Performance
In the figures below the red graph represents the model and the blue graph shows the performance of benchmark SPY (the ETF tracking the S&P 500). Figures 1 and 2 show performance comparisons for the two models.
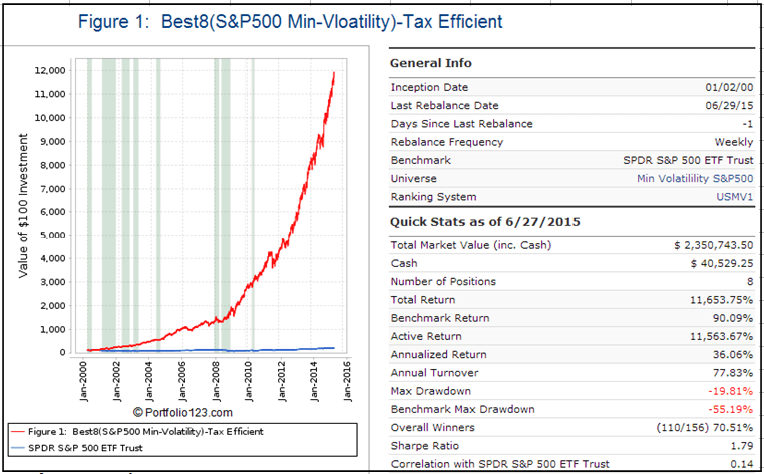
Performance 2000-2015 and hedging with short UPRO, the 3x leveraged Ultrapro S&P500 ProShares ETF. The model uses a hedge ratio of 45% of current holdings during down-market conditions. (Note: The inception date of UPRO was June 23, 2009. Prior to this date values are “synthetic”, derived from the S&P 500.) Annualized Return= 36.1%, Max Drawdown= -19.8%.
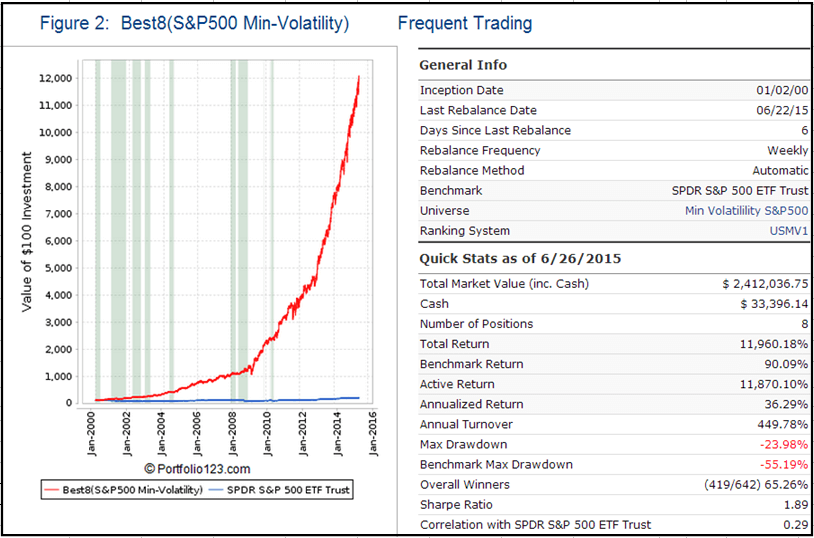
Performance 2000-2015 and hedging with long SH, the -1x leveraged Short ProShares ETF. The model reduces the size of the stock holdings by 60% to buy SH during down-market conditions. (Note: The inception date of SH was June 19, 2006. Prior to this date values are “synthetic”, derived from the S&P 500.) Annualized Return= 36.3%, Max Drawdown= -24.0%.
Tax Efficiency
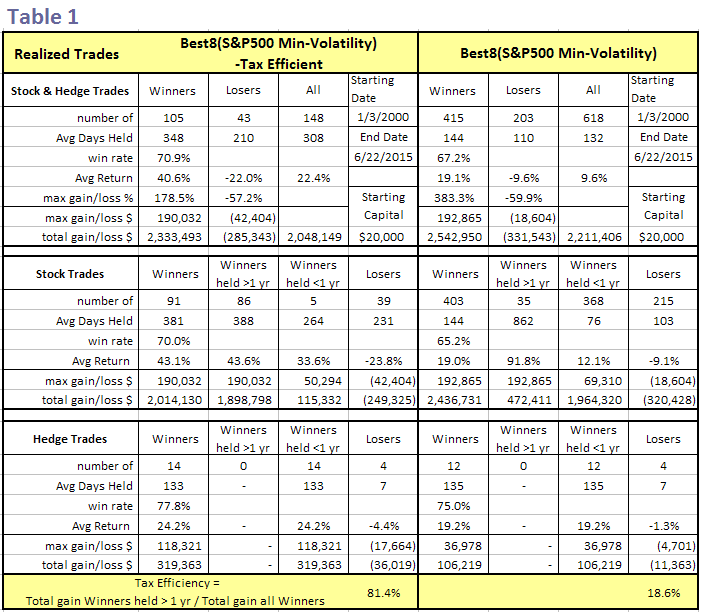
Tax Efficiency was defined as the ratio of Total $ gains of Winners held longer than 1 year to Total $ gains of all Winners, expressed in percent.
An analysis of all the realized trades is shown in Table 1. For the Best8(S&P500 Min-Volatility)-Tax Efficient there were 91 winning stock trades of which 86 had holding periods longer than 1 year, resulting in a 81.4% Tax Efficiency.
By comparison, the Best8(S&P500 Min-Volatility) system had 415 winning stock trades of which 35 had holding periods longer than 1 year, resulting in a Tax Efficiency of only 18.6%.
Since both models show the same annualized return of about 36% it would be more advantageous to follow the Tax Efficient system when trading outside a tax-sheltered account.
Performance of Other Minimum Volatility Stock Models
For one year now we have reported on our website the performance of the Best12(USMV)-Investor and Best12(USMV)-Trader models which periodically select their positions from the holdings of the iShares MSCI USA Minimum Volatility ETF USMV.
The almost 1-year return for the Investor, with a 1-year buy&hold portfolio, was 26.0%, while the Trader model, re-balanced every 2 weeks, returned 29.3%.
An analysis of all the realized trades from 6/30/2014 to 6/22/2015, just short of a full year, is shown in Table 2. For the Investor there were only 3 trades. One trade was a merger and the other two resulted from a price decline of more than 15% from a recent high. Thus the Investor still retained 9 positions of its original portfolio. For the Trader there were 48 realized trades over this period.
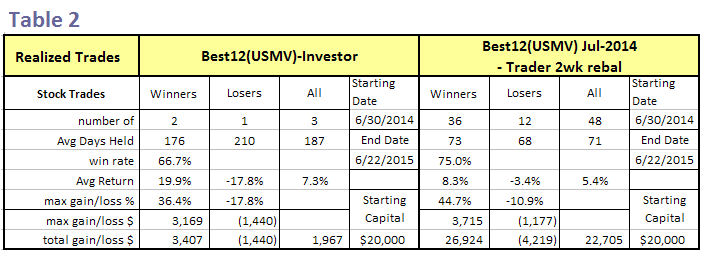
Since the Trader model did not produce significantly higher returns by trading often, the question arises whether frequent trading of large-cap minimum volatility stocks is worthwhile. This analysis, albeit only extending over a one year period, supports the backtest results of the two S&P500 Min-Volatility models, namely that frequent trading of minimum volatility stocks does not necessarily produce better returns than holding those stocks for periods longer than one year before they are sold.
Disclaimer
One should be aware that all results are presented for informational and educational purposes only and shall not be construed as advice to invest in any assets. All investors should make investment choices based upon their own analysis of the asset, its expected returns and risks, or consult a financial adviser.
What were the Best 8 annualized returns without the hedge? Thanks.