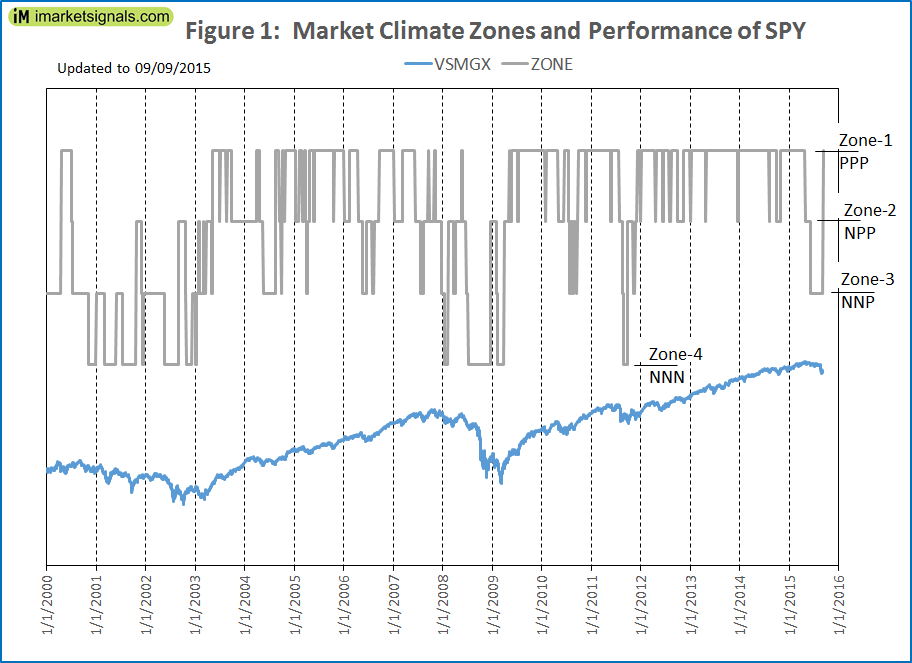
- The Market Climate Grader divides the environment for investment returns into four market climate zones.
- For better returns one should adjust asset allocation according to market climate. As an example, three models were analyzed to highlight the better performance when investing according to market climate.
- Performance for three models which use ETFs with varying risk characteristics are shown. Interestingly, risk measurements for the models are very similar, better than for the benchmarks and component ETFs.
- The simulated performance for all models is much higher than for buy-and-hold of the S&P500 or for the Vanguard LifeStrategy Moderate Growth Fund which holds 60% stocks and 40% bonds.
Market Climate Zones
There are four zones:
- Zone-1: PPP (positive)
- Zone-2: NPP (neutral-positive)
- Zone-3: NNP (neutral-negative)
- Zone-4: NNN (negative)
Figure-1 depicts the market climate zones as determined by our Market Climate Grader and also the performance of SPY. It is evident that during up-market periods Zone-1 prevailed most of the time, while during down-markets Zone-3 and Zone-4 were more often present. Recently the Grader switched from NNP to PPP.
Asset allocation should be in accordance with prevailing market climate. More aggressive (risky) ETFs can be used during up-market periods, while more conservative ETFs with less risk should protect and improve one’s investment during down-market periods.
The Standard ETF Models
Table-1 provides historic performance and risk statistics for our three standard models, Basic, Conservative, and Aggressive, as well as for the benchmarks VSMGX and SPY. A transaction cost of 0.10% of trade amounts was applied to provide for slippage and brokerage fees.
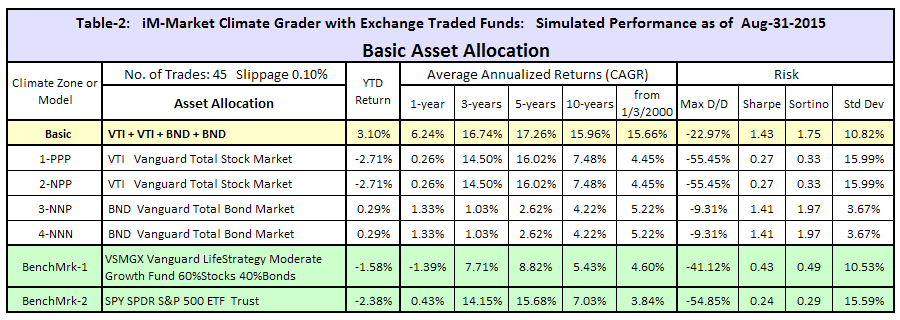
The Basic Model uses only two Vanguard ETFs in the four market climate zones. This resulted in 44 completed trades over the backtest period.
- They are the Vanguard Total Stock Market ETF (VTI),
- and the Vanguard Total Bond Market ETF (BND).
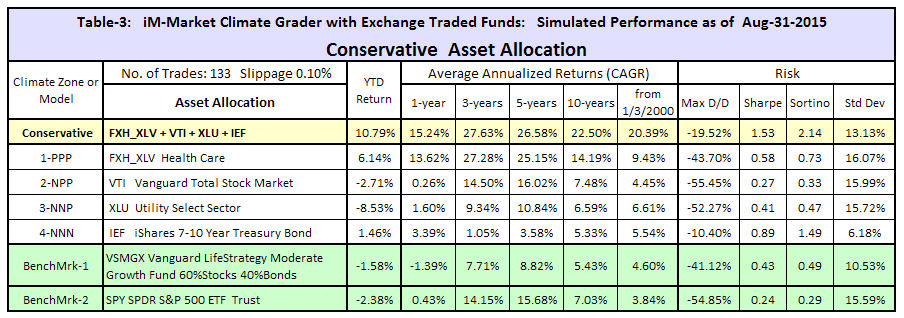
The Conservative Model uses four different ETFs, one for each climate zone. As a result 132 completed trades were generated for this model.
- They are the First Trust Health Care AlphaDEX Fund (FXH), and prior to its inception the Health Care Select Sector SPDR ETF (XLV),
- the Vanguard Total Stock Market ETF (VTI),
- the Utilities Select Sector SPDR ETF (XLU),
- and the iShares 7-10 years Treasury Bond ETF (IEF).
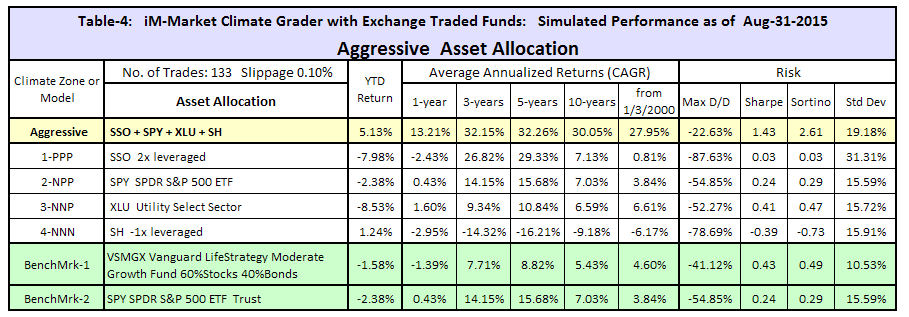
The Aggressive Model also uses four different ETFs.
- They are the 2x leveraged ProShares Ultra S&P500 (SSO),
- the SPDR S&P 500 ETF Trust (SPY),
- the Utilities Select Sector SPDR ETF (XLU),
- and the ProShares Short S&P500 (SH).
It is evident that each model significantly out-performed the benchmarks with less risk, as can be seen from Table-1. Noteworthy is that the risk measurements for all three models are very similar, while annualized returns for periods 3 years and longer are highest for the Aggressive model and lowest for the Basic model.
The performance of the Basic model which holds Vanguard index stock- and bond ETFs only, can be directly compared to that of the Vanguard LifeStrategy Moderate Growth Fund which holds 60% stocks and 40% bonds. The standard deviation of 4-week returns is about 10% for both, but Sharpe- and Sortino ratios, maximum drawdown, and annualized returns are much better for the Basic model – all achieved by following the Market Climate Grader and trading 44-times since January 2000.
Standard Model Performance
Tables-2, -3, and -4 provide performance and risk figures for the Basic, Conservative, and Aggressive models, respectively. Performance and risks for their relevant component ETFs are shown as well. It is evident that each model shows much higher returns than any of its component ETFs would have provided. This is also achieved with less risk as can be seen from the four risk measurements in the tables.
Following the Market Climate Grader Models
From our analysis it is apparent that structuring investments according to the market climate zones should provide better returns than ignoring market climate.
At our website imarketsignals.com, we will provide weekly information of the latest market climate zone as generated by the Market Climate Grader, together with performance updates for our three standard models.
Disclaimer
One should be aware that most of the results shown are from a simulation. These models are presented for informational and educational purposes only and shall not be construed as advice to invest in any assets. Out-of-sample performance may be much different. Backtesting results should be interpreted in light of differences between simulated performance and actual trading, and an understanding that past performance is no guarantee of future results. All investors should make investment choices based upon their own analysis of the asset, its expected returns and risks, or consult a financial adviser.


Hi Georg,
Thanks for another great system!
I noticed in the Risk portion of the allocation table, the MAX DD for the individual ETFs are -50% or more.
Is this the MAX DD for that ETF inclusive of the period that it is not traded by the model?
If there is a trade that has seen such high DD, why is the model MAX DD only 20%-ish?
Thanks!!!
Houston
For the component ETFs and benchmarks the figures are for a constant investment in the funds, with dividends re-invested.
Thanks Georg for a very interesting new system. Best of regards, Brett
Great work as always. Question: does using SH have a positive expectancy in Zone 3? Thanks….
Tom C
We can run this model with any asset allocation.
SSO+SPY+SH+SH
from inception= 26.51%
YTD= 8.36%
1-year= 16.69%
3-years = 33.49%
max D/D= -28.1%
Sharpe= 1.33
Sortino= 2.16
Std Dev= 19.53%
The risk figures are worse than for the standard model, that is why we did not choose this allocation.
Thanks so, clearly XLU is better than SH in Zone 3, I guess the question I had is how does using SH in Zone 3 compare to doing nothing in Zone 3 (Cash), so compared to SSO+SPY+Cash+SH
Tom C
SSO+SPY+Cash+SH
from inception= 24.82%
YTD= 4.18%
1-year= 13.21%
3-years = 31.75%
max D/D= -22.63%
Sharpe= 1.35
Sortino= 2.3
Std Dev= 18.04%
In Zone 4 (Agressive), it appears that buying SH has a negative expectation of gains (-6.17% per year). Why would one not just ride out zone 4 in cash or a bond fund? Am I reading this right?
SSO+SPY+XLU+Cash
Note that SH is not a constant investment, it only gets used in Zone-4 NNN.
from inception= 22.35%
YTD= 5.13%
1-year= 13.21%
3-years = 32.15%
max D/D= -28.1%
Sharpe= 1.28
Sortino= 2.16
Std Dev= 17.16%
For the conservative model would it be more effective to use the results of your Best1(Sector SPDR) model instead of always going with the Health Care sector?
Backtesting for this model can only be done for the same asset allocation. We can’t vary the asset for a particular zone during the backtest.
Very interesting. I’m curious to see what the results would like if SPY was substituted with MDY. Thanks!
SSO+MDY+XLU+SH
from inception= 30.15%
YTD= 5.64%
1-year= 14.07%
3-years = 34.45%
max D/D= -24.71%
Sharpe= 1.50
Sortino= 2.63
Std Dev= 19.64%
Thanks for the analysis. Have you looked at using only the two extreme zones (zone 1 and zone 4) to cut down on trading frequency. What would it look like if one invested in VTI when the indicator signaled zone 1 and only switched to BND when signal dropped to zone 4, and vice versa. Thanks!
Why would one want to be in cash during zone2 and zone3 periods?
To clarify, I wouldn’t consider being in cash during zone 2 and 3. Rather I would only switch from VTI to BND when indicator reaches zone 4, and switch back to VTI only if indicator reaches zone 1. Therefore, there would be instances where one may be invested in VTI while in zone 3 and also invested in BND while in zone 2. I understand that this may lower CAGR, but I’m trying to see if this strategy may be feasible for a 401k account where there are generally restrictions to trading frequency (i.e. no round turns within 30 days).
Thanks!
For 401k accounts there are no trading cost but minimum period before one can repurchase a fund after having sold it is 60 days. Therefore minimum holding period must be 60 days for a new position after selling the previous position. (60 day rule is for Vanguard and TIAA-CREF funds.)
Using VTSMX Tot Stock Mkt Index Fund and VBMFX Tot Bond Mkt Index Fund instead of VTI and BND, respectively, with a min 60 day holding period the model has 29 trades from Jan-2000 to Aug-31-2015. CAGR= 13.71% with a max D/D= -22.9%.
I’m sorry if you have already mentioned this in another forum, but when/where are you going to post updates for this model?
Thanks
Updates of Market Climate Grader zones and holdings of our three standard model are provided on Sundays by email to members with Gold subscriptions.
Is it possible to run the climate grader on other indicies ie ASX? I really like the look of the back testing.
David
The Market Climate Grader has been designed for the US market. That does not mean it cannot be applied to the Australian market, because both markets seem to have similar characteristics. Recently the MAC-US and MAC-AU generated sell signal on the same day.
One needs a general stock market fund and a bond fund. We will investigate this and should be able to produce something useful for Australia as well.
George,
Does the climate grader incorporate 1. recession indicators and 2. Hi Lo
data?
Our recession indicators are not part of the Market Climate Grader algorithm. They provide additional warning signals prior to recessions. The HiLo data is however taken into account.
Georg, When you can would you mind running a scenario for VTI in MCG 1, 2 and 3 and cash in MCG 4. This is for some contingency planning. My spouse is not financially savvy so I want to minimize the trades but still have a tool that stays out of the market during the worst of times. I realize the results will not be great; but I’m sure they are above buy and hold over a long period. Thanks.
The backtest shows higher returns using the (SPY-IEF)Market Timer when holding 100% of VTI for 100%, 75%, 50%, and 25% SPY allocations and only going to Cash for 100% IEF allocation.
The model has 14 trades from Jan-2000 to Aug-31-2015. CAGR= 11.90% with a max D/D= -23.0%. A lot better than buy-and-hold SPY.
Also (SPY-IEF)Market Timer is in the iM-Silver section. Thus it would be more economical to use the Timer if this is all one is interested in.
Thanks!
Hello, I like this model a lot. Why do you not track it monthly on your out of sample performance reports?
Hi, was this model discontinued? Thanks.
Tom C
You must have missed our announcement in our Sunday emails prior to October 15: “Please take note that effective from October 15, 2017 we will discontinue the iM-MCGrader which has been deprecated by the three, recently introduced and superior, composite timer models.”
OK, cool. And those three are 1) Best SPY-IEF Market Timer, 2) Composite Market Timer, and 3) Standard Market Timer?
Thanks.
Tom C