
Market Signals Summary:
Both the MAC-US and MAC-AU generated sell signals two weeks ago, however the IBH stock market models is still invested. The recession indicator COMP is down from last week’s level, and iM-BCIg is also lower than last week’s level. The bond market model avoids high beta (long) bonds, the trend of the yield spread is indeterminate. Both the gold and silver model are invested.
Stock-markets:
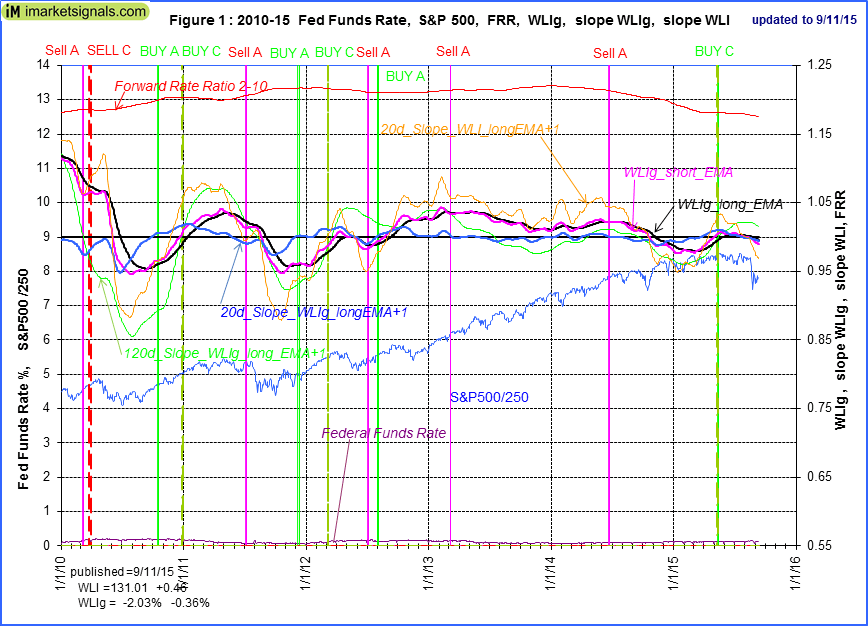 The IBH-model is invested in the markets. The IBH model relies mainly on the long and short EMAs of the U.S. Weekly Leading Index’s growth rate. The IBH-model is described here and the latest rules can be found here .
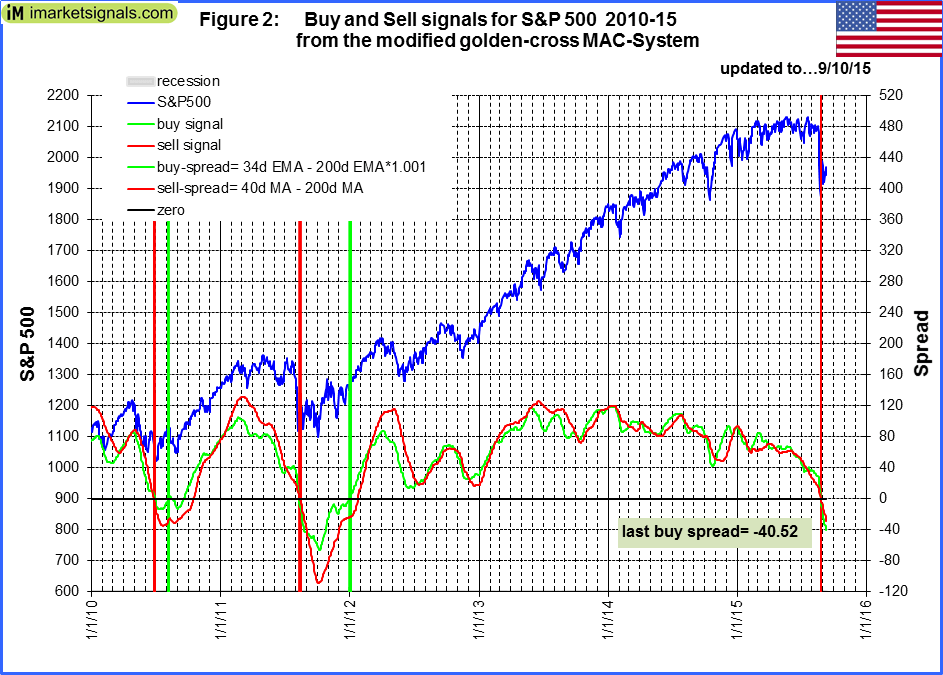 The MAC-US model generated a sell signal one week ago and thus in cash. The buy-spread is down from last week’s level. MAC-US Fig 2 shows the spreads of the moving averages. The buy spread (green graph) has to move above the zero line for a buy signal.
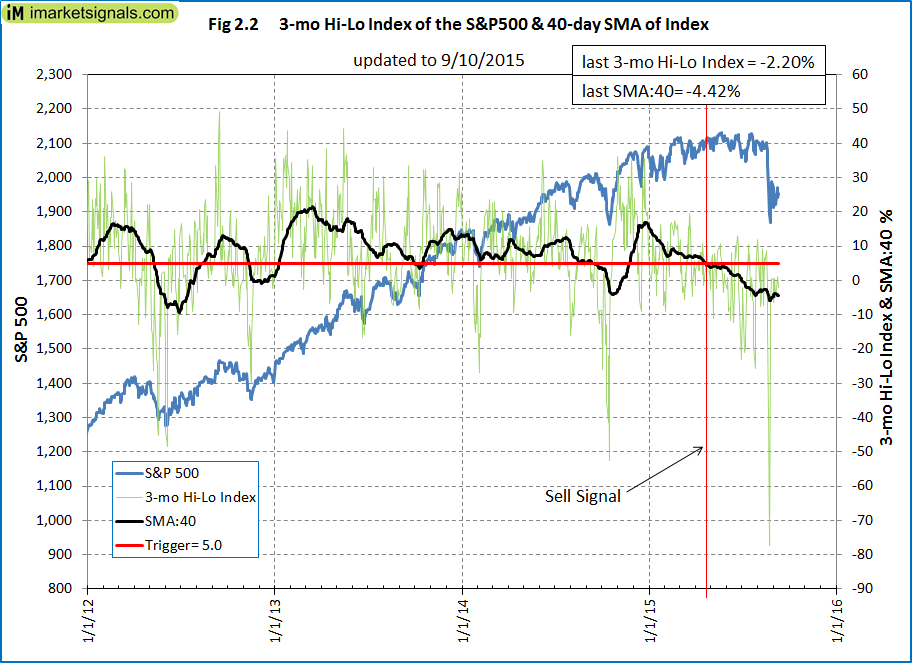 The 3-mo Hi-Lo Index of the S&P500 signaled an exit from the stock market at the end of April 2015. For a buy signal to emerge the 40-day moving average of the index must move from below to above 5.0%.
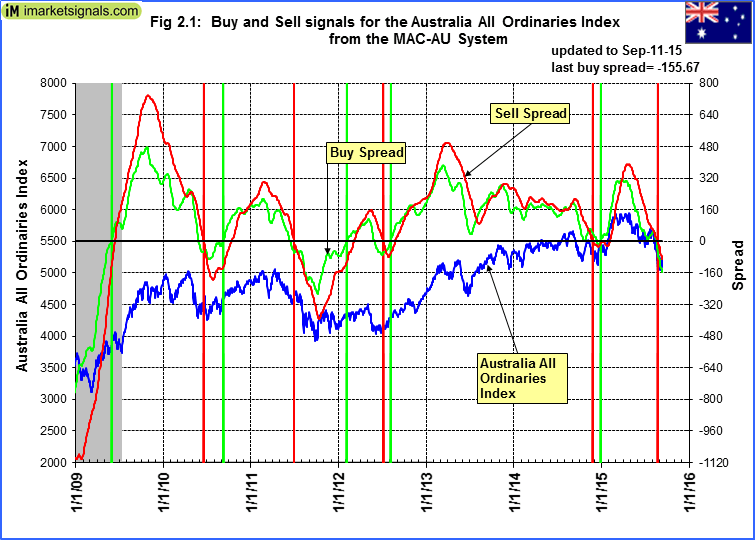 The MAC-AU model generated a sell signal one week ago and thus in cash. The buy-spread is lower than last week’s level. The next buy signal will emerge once the buy spread (green graph) moves above the zero line.
This model and its application is described in MAC-Australia: A Moving Average Crossover System for Superannuation Asset Allocations.[/iM]
Recession:
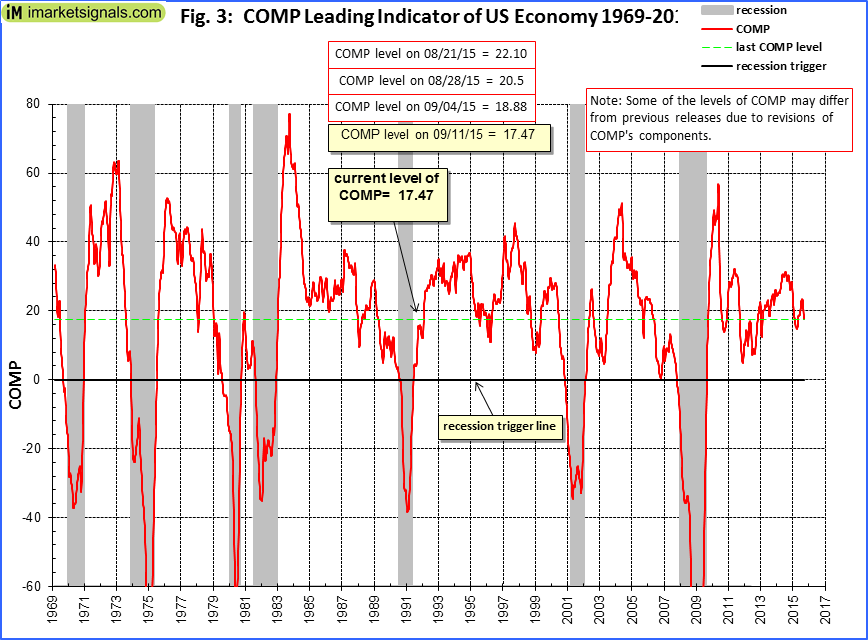 Figure 3 shows COMP is down from last week’s level, and far away from signaling recession. COMP can be used for stock market exit timing as discussed in this article The Use of Recession Indicators in Stock Market Timing.
 Figure 3.1 shows the recession indicator iM-BCIg is down from last week’s level. An imminent recession is not signaled .
Please also refer to the BCI page
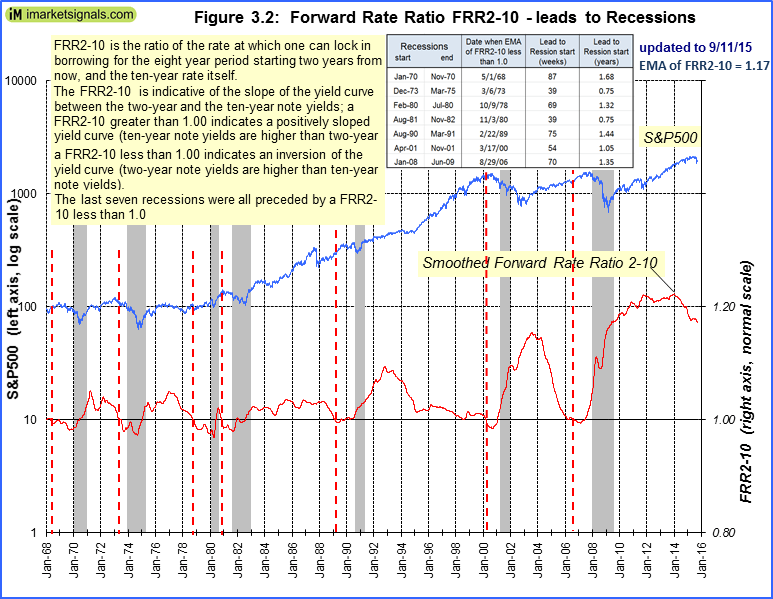 The Forward Rate Ratio between the 2-year and 10-year U.S. Treasury yields (FRR2-10) is near last week’s level and far away from signalling a recession.
A description of this indicator can be found here.
Leave a Reply
You must be logged in to post a comment.