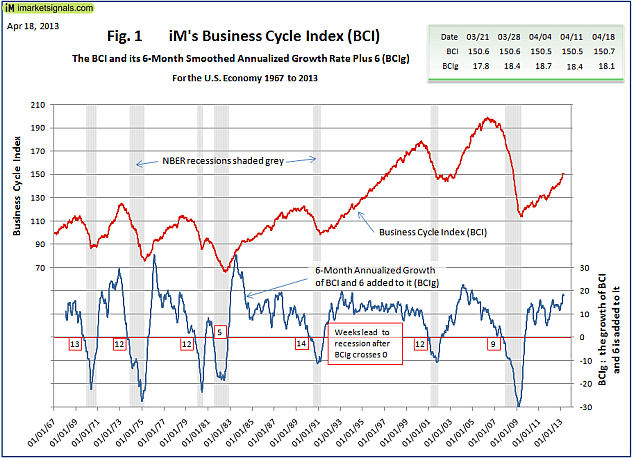
Knowing when the U.S. Economy is heading for recession is paramount for successful investment decisions. We have designed the weekly iMarketSignals Business Cycle Index (BCI) so it would have provided early reliably warnings for the past seven recessions. We achieved recessions leads averaging 11 weeks, all with similar lengths. The absence of false positives, for the analyzed time period of 1967 to 2013, enhances the quality and reliability of the recession warnings.
The project to design a new leading index was initiated by the necessity to replace the Economic Cycle Research Institute’s Weekly Leading Index (WLI) with an indicator with good and reliable recession forecasting characteristics. Refer to Why is M2 Still a Component of ECRI’s WLI? and Does ECRI’s WLI Remain a Usable Indicator?
We developed BCI from the following basic economic data:
1. 10-year treasury yield (daily)
2. 3-month treasury bill yield (daily)
3. S&P500 (daily)
4. Continues Claims Seasonally Adjusted (weekly)
5. All Employees: Total Private Industries (monthly)
6. New houses for sale (monthly)
7. New houses sold (monthly)
The data-set is available from 1967 onwards, a timeframe that encompasses the last seven recessions. When combining the component for the index the “real time” aspect was considered, i.e. the data was only incorporated into the index at its publication date.
The BCI was not specifically designed to be a measure of the strength or weakness of the economy; it was designed to provide high probability recession forecasts (based on past performance). The various parameters of the BCI model, with which the input data are preconditioned and combined, were adjusted to provide the best recession capturing characteristics to the growth rate of BCI, with emphasis on getting the beginning of recessions right.
A superior measure for cyclical analysis is the 6-month smoothed annualized growth rate of an index. (See appendix A for the formula.) We used this method in our approach to obtain BCIg, the growth of BCI plus 6.0% to make zero the recession trigger. This provided recessions leads of 11 weeks on average with a standard deviation of 2.6, giving a Sharpe ratio of 4.2 (See Table 1). This high ratio indicates that all the leads are of similar length. Furthermore, using this method on the historical data we note that there are no false positives, which is also evident form Figure 1 that plots the BCI and BCIg from1967 onwards.
We note that the current configuration of BCI and BCIg (updated to April 18) are far removed from typical past recession configurations. The last five readings of BCI and BCIg are also shown in Figure 1.
The BCI will be maintained and updated every Thursday on the our dedicated page, accessible through the BCI menu item on the black menu bar in the heading section of every page.
click on image to enlarge

| Business Cycle Index from Jan 2013 | ||
| DATE | BCI | BCIg |
| 04/18/13 | 150.70 | 18.08 |
| 04/11/13 | 150.47 | 18.41 |
| 04/04/13 | 150.54 | 18.65 |
| 03/28/13 | 150.56 | 18.44 |
| 03/21/13 | 150.59 | 17.78 |
| 03/14/13 | 150.12 | 16.62 |
| 03/07/13 | 148.90 | 15.58 |
| 02/28/13 | 147.75 | 14.77 |
| 02/21/13 | 146.48 | 14.44 |
| 02/14/13 | 146.35 | 14.61 |
| 02/07/13 | 145.84 | 14.60 |
| 01/31/13 | 145.99 | 14.71 |
| 01/24/13 | 146.09 | 14.40 |
| 01/17/13 | 145.41 | 13.91 |
| 01/10/13 | 145.24 | 13.33 |
| 01/03/13 | 144.21 | 12.74 |


Thank you for this timely replacement of the WLI and WLIg indicators.
Would be nice to get data for 2012 as well in order to track with your figures. Thanks again.
Lance, Please refer to the table on the BCI page (logged in version), which includes the 2012 data.
Thanks Anton; got 2012 data. Any plans to incorporate the BCI calc instead of WLI in the IBH model?
We already have a beta version of the IBH model based on the BCI which we will soon post on the website. This new model will run in parallel with the old IBH model which is based on the WLI.
Hi guys – great work you’re doing. Very curious to see how the IBH model with your BCI turns out in comparison to the old one with WLI. Very keen to see it.