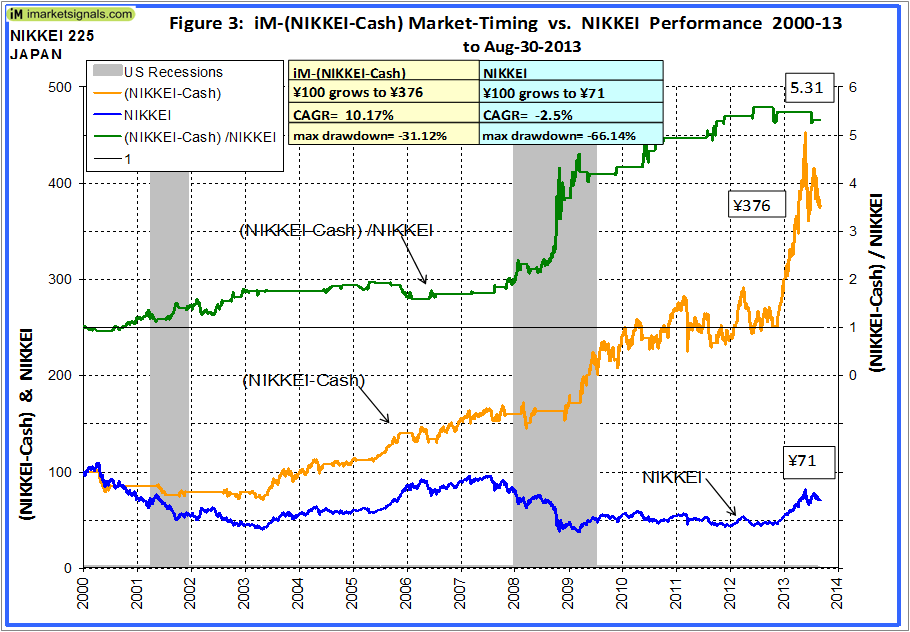
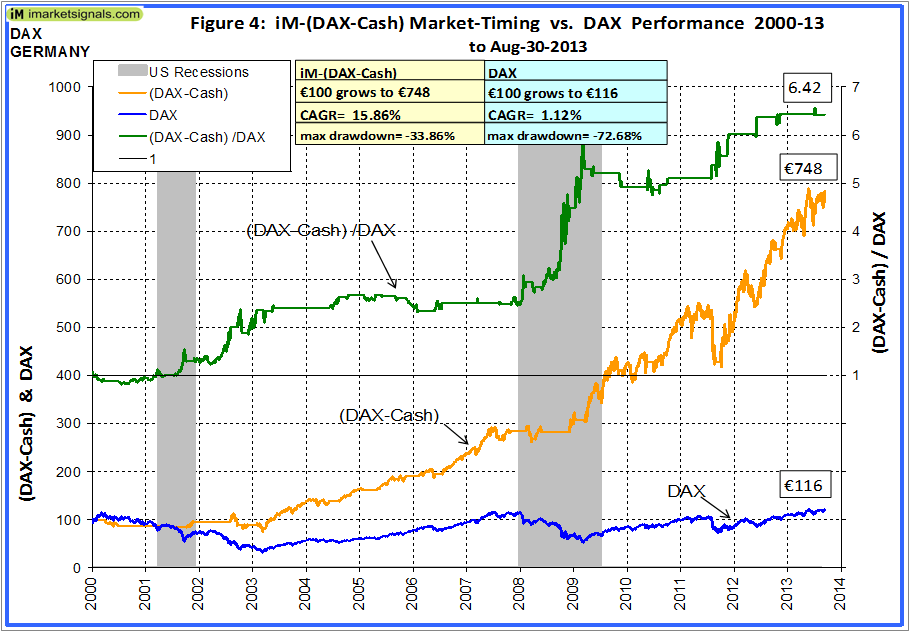
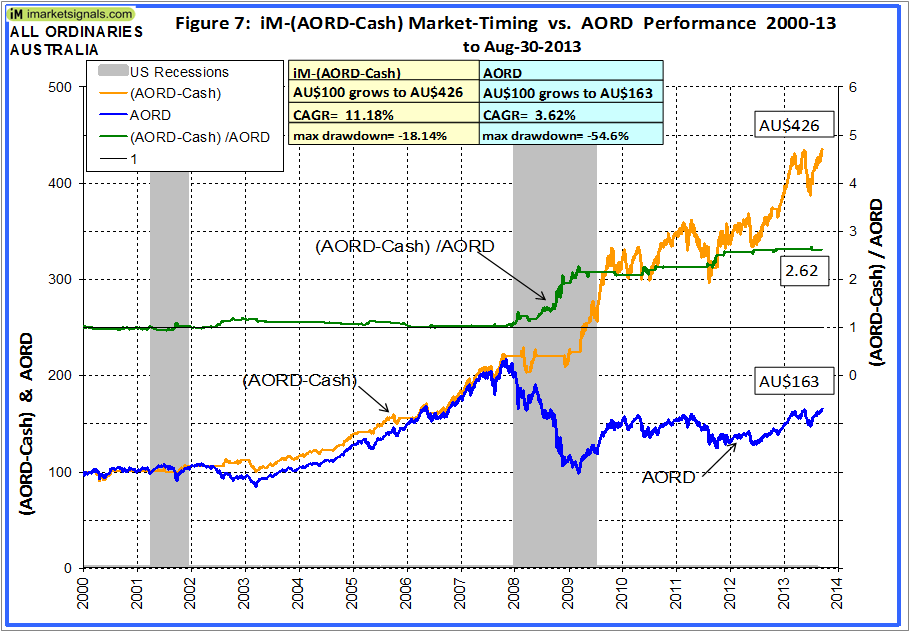
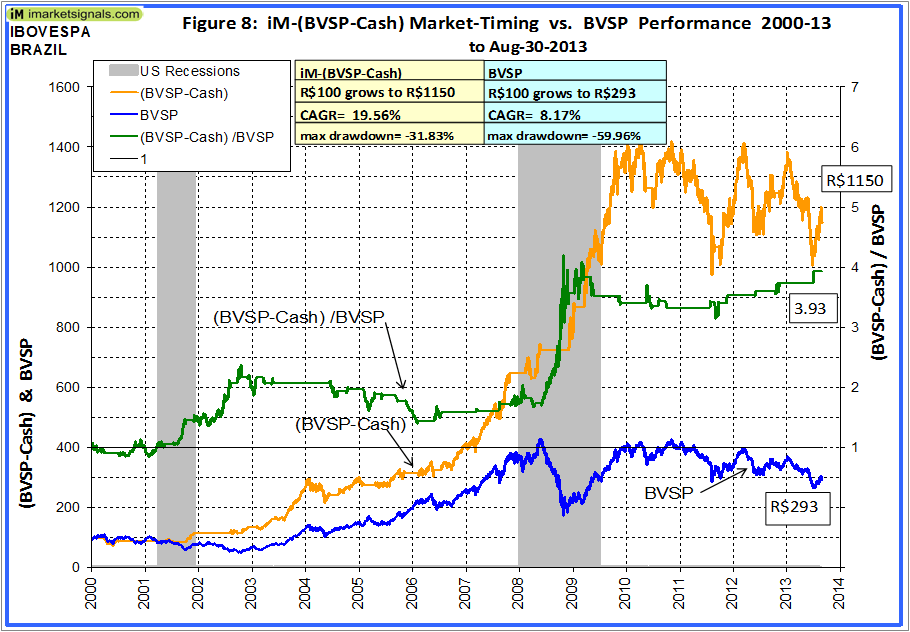
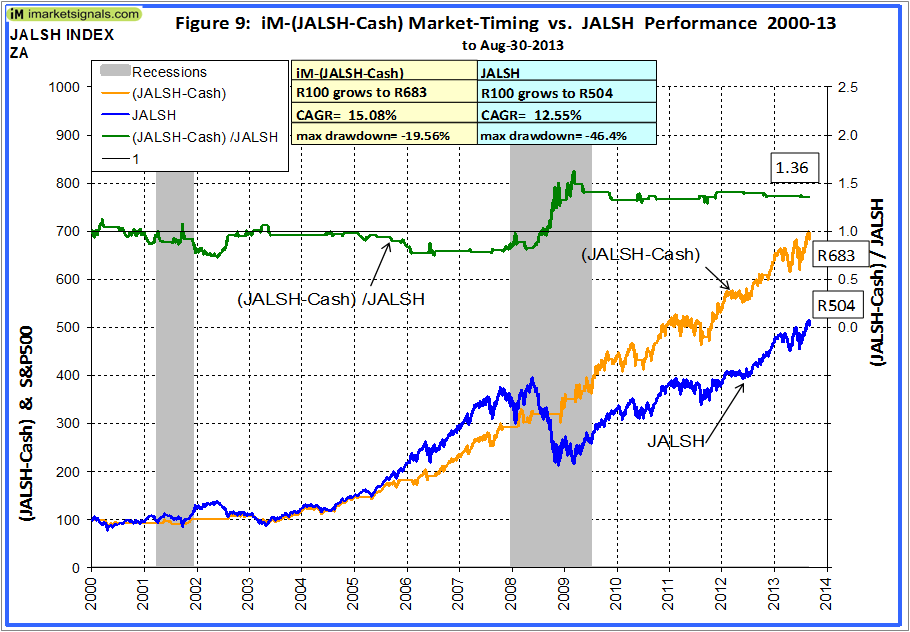
Using the investment periods determined for the US market with the iM-Best(SPY-SH) Market Timing System, we calculated performance figures for 9 major country indices. The system, if followed, would have improved returns from all markets. From January 2000 to August 2013 with market timing, the best performing index in local currency was IBOVESPA – Brazil, and in US-dollars the DAX – Germany, closely followed by Brazil.
Performance
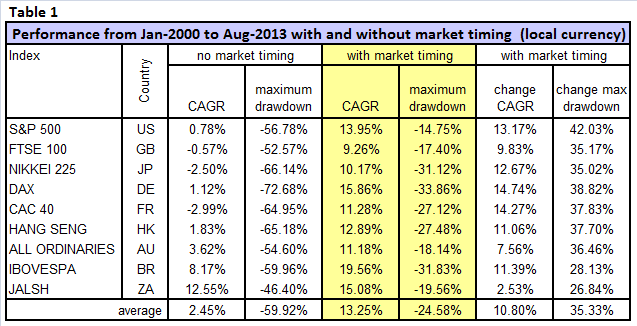
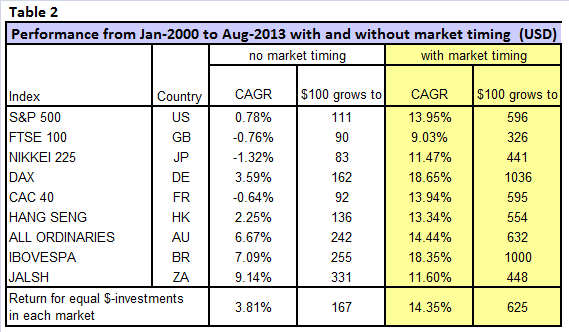
Generally buy-and-hold performance was poor for most markets, except for Australia, South Africa and Brazil. For buy-and-hold, in local currency and US-Dollars the best performing index was JALSH – South Africa. The American, European and Japanese markets all had negligible or negative returns, only South Africa, Brazil and Australia produced somewhat reasonable positive returns, as can be seen in Table 1 and 2. Interestingly, the best performing markets were all in the southern hemisphere.
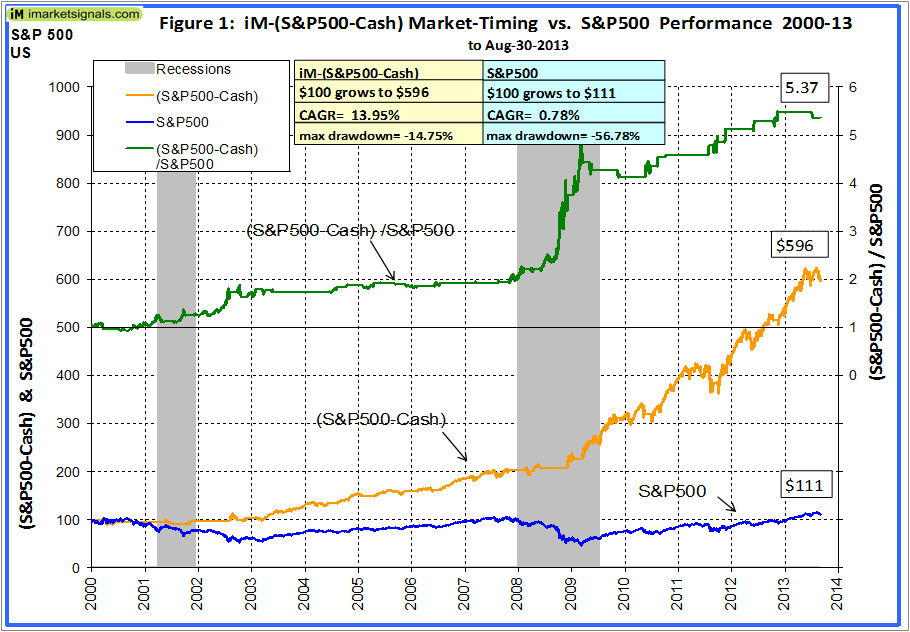
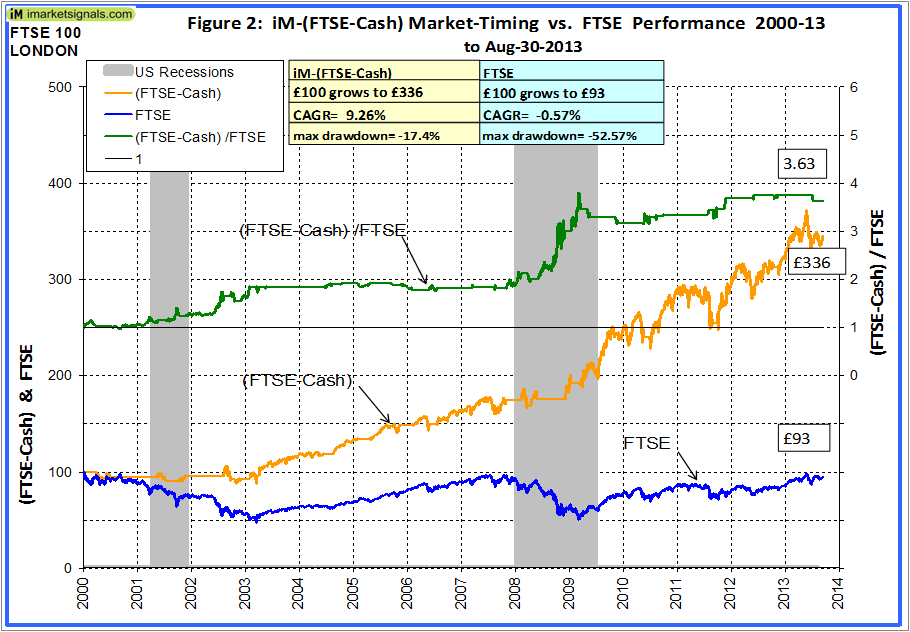
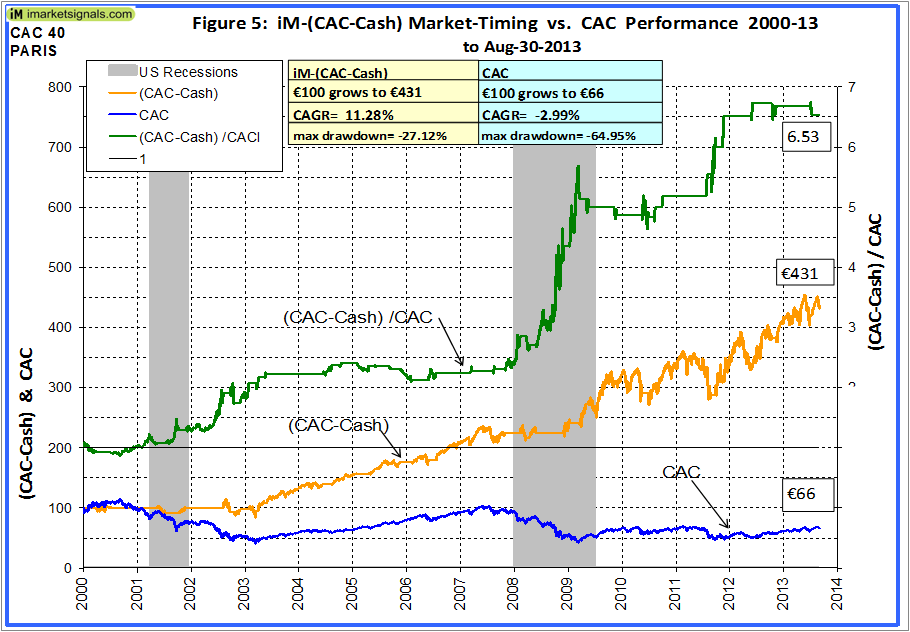
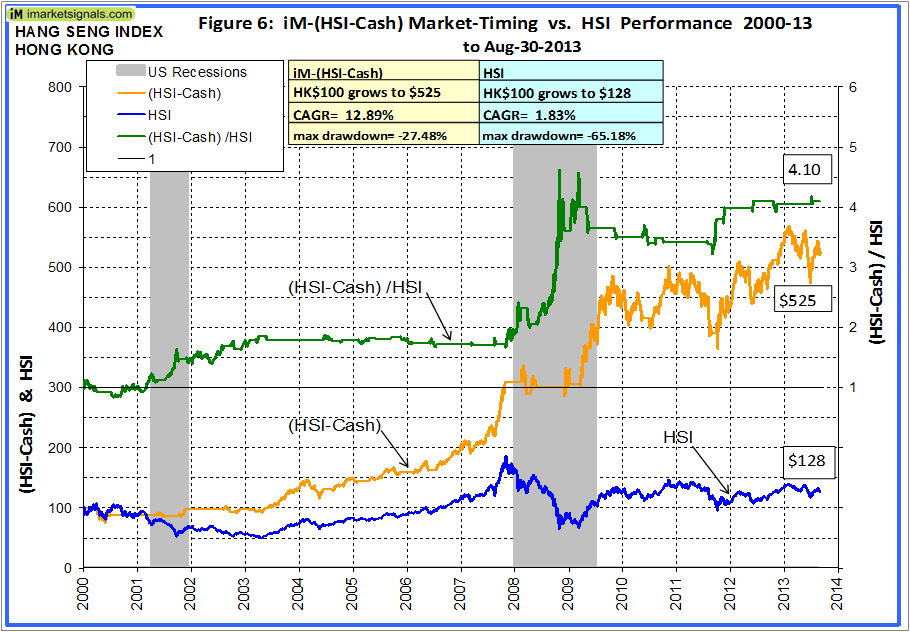
Had one been invested only during the periods when Best(SPY-SH) was long SPY (as listed in Table 3 of iM-Best(SPY-Cash) Market Timing System) and stayed in cash at all other times, then the annualized returns from all markets would have improved on average by about 10.8%. Furthermore the maximum draw-downs would also have been significantly lower, as shown in Table 1 and in Figures 1 to 9. The incremental gain from the South African would have been least, while investor in the German market would have gained most by applying the system.
As shown in Table 2, a US based investor with equal initial dollar investments in all 9 markets would have had an average annualized return of 3.81% for buy-and-hold, versus 14.35% for market timing, all better than the return from the S&P500 alone. Dividend and interest income is not included.
In the figures, the upper green graph is the ratio of the (XXX-Cash) to XXX. A rising ratio graph indicates that the model’s signals improved investment performance. It is evident that most of the added performance would have come during the US recession periods, whereas at other times the market timing model’s contribution to performance was less pronounced. During the 2003-2007 and 2009-2013 bull-market period the model’s signals would have contributed least to performance, and would have caused underperformance for investors in the Australian, Hong Kong, South African and Brazilian markets.
Conclusion
From this analysis it would appear that the signals from the Best(SPY-SH) Market Timing System could be applied successfully to most major markets, not just to the US market for which it was designed. Additionally, the benefits of investment diversification among the major markets was demonstrated, with- and without market timing.
(click on any image image below to enlarge)

So, if I understand correctly, you used your USA based Best(SPY-SH)model to generate buy/sell signals, and when this USA model said buy – then you “bought” foreign markets, that is, you used USA signals to buy foreign markets.
OR (2) – did you adapt your model’s rules to use foreign data to generate signals on the foreign markets?
Thanks
Rob
Rob, I used USA based Best(SPY-SH)model without modifications. When model was long SPY this indicates the investment periods for the world markets. Other times in cash.
Could you please post the results for the IBEX35 Index?
Here are the results for IBEX 35 if signals from Best(SPY-SH) model would have been applied. Instead of a negative annualized growth rate of -2.3% one would have had an annualized growth rate of 8.5% from 2000 to 2013, in Euros. Max drawdown would have been -43% instead of -63%.
The Spanish market was not the place to be.
Hi Georg,
As a recent member I’m just catching up with all the posts, and am excited by this. I’m an expat with funds in another country, and now a method for market timing as well – thank you!
Does this also mean we could apply the same model to internal markets such as Russell 2000 and Russell Micro-cap?
Would be interested to see the growth rate of those if you believe the model applies.
Many thanks
Greg
Greg, If you go to Table 3 of the Best(SPY-SH) model description you will see the periods when the model was in SPY and corresponding returns. You can substitute values for any other ETF instead of SPY and figure out the returns.
The micro-cap ETF IWC has only been around since Aug-2005, so it would not be particularly useful, but IWM has an inception date of May-2000, so it could be used for a comparison.