–

Blog Archives
iM Update* – January 12, 2018
Posted in pmp paid update
No Sight of Next Recession: Business Cycle Index Update 1/11/2018
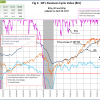
Is your investment strategy protecting your assets from the next recession? Our Business Cycle Index is a tool to help you gauge recession risk.
Posted in BCI
iM-Best Reports – 1/8/2018
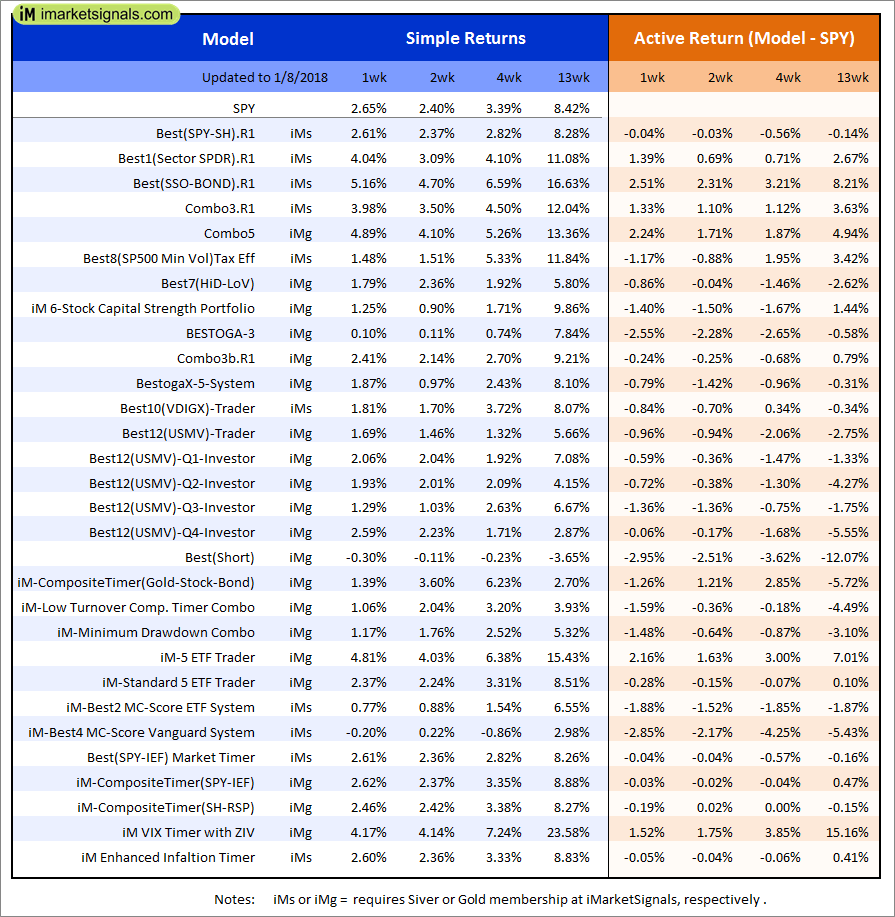 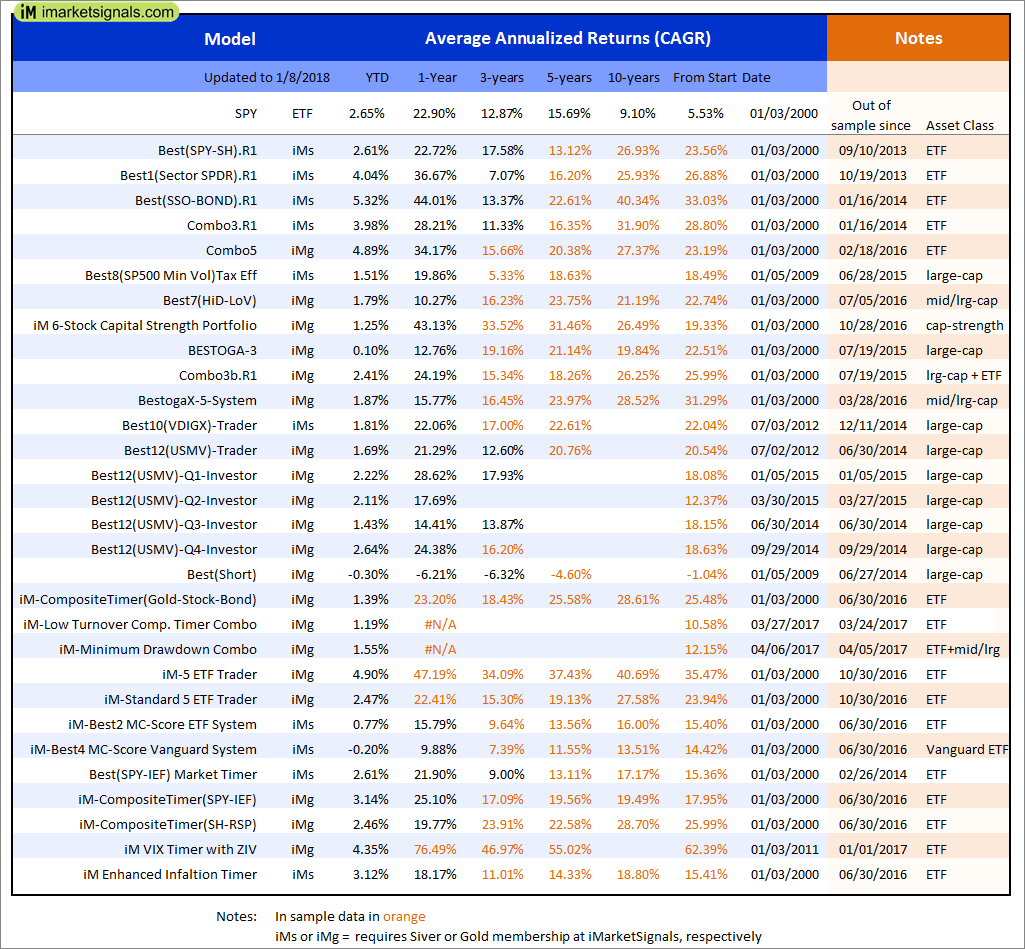 |
Out of sample performance summary of our models for the past 1, 2, 4 and 13 week periods. The active active return indicates how the models over- or underperformed the benchmark ETF SPY. Also the YTD, and the 1-, 3-, 5- and 10-year annualized returns are shown in the second table |
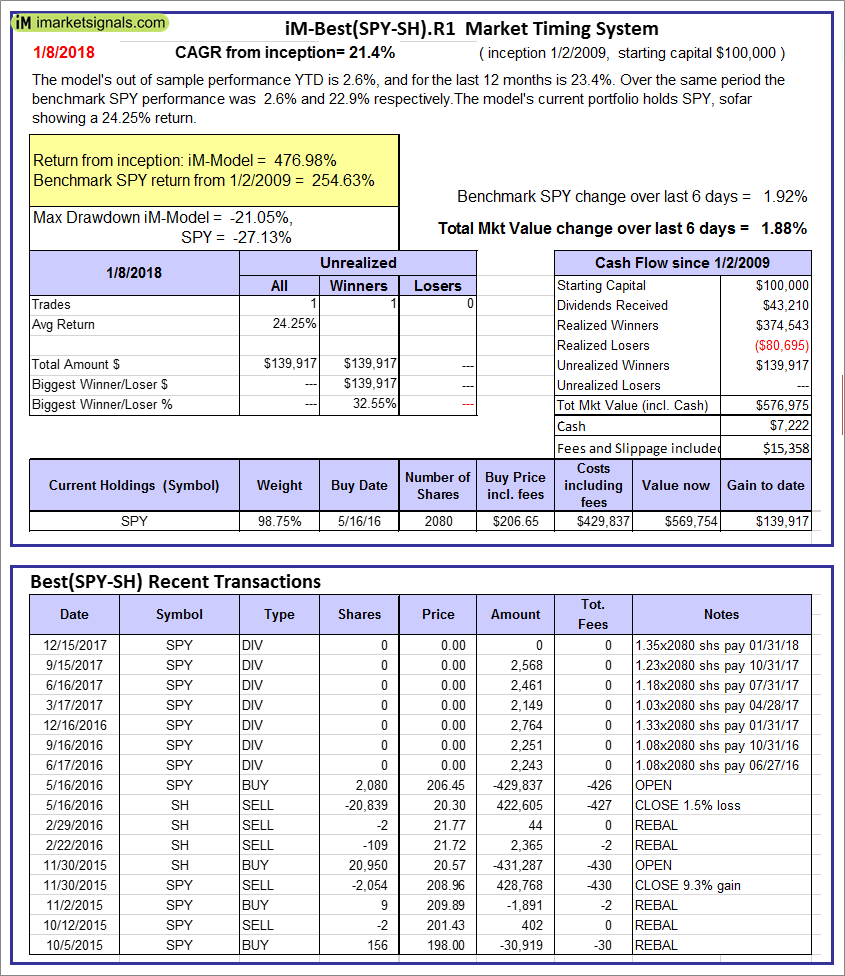 |
iM-Best(SPY-SH).R1: The model’s out of sample performance YTD is 2.6%, and for the last 12 months is 23.4%. Over the same period the benchmark SPY performance was 2.6% and 22.9% respectively. Over the previous week the market value of Best(SPY-SH) gained 1.88% at a time when SPY gained 1.92%. A starting capital of $100,000 at inception on 1/2/2009 would have grown to $576,975 which includes $7,222 cash and excludes $15,358 spent on fees and slippage. |
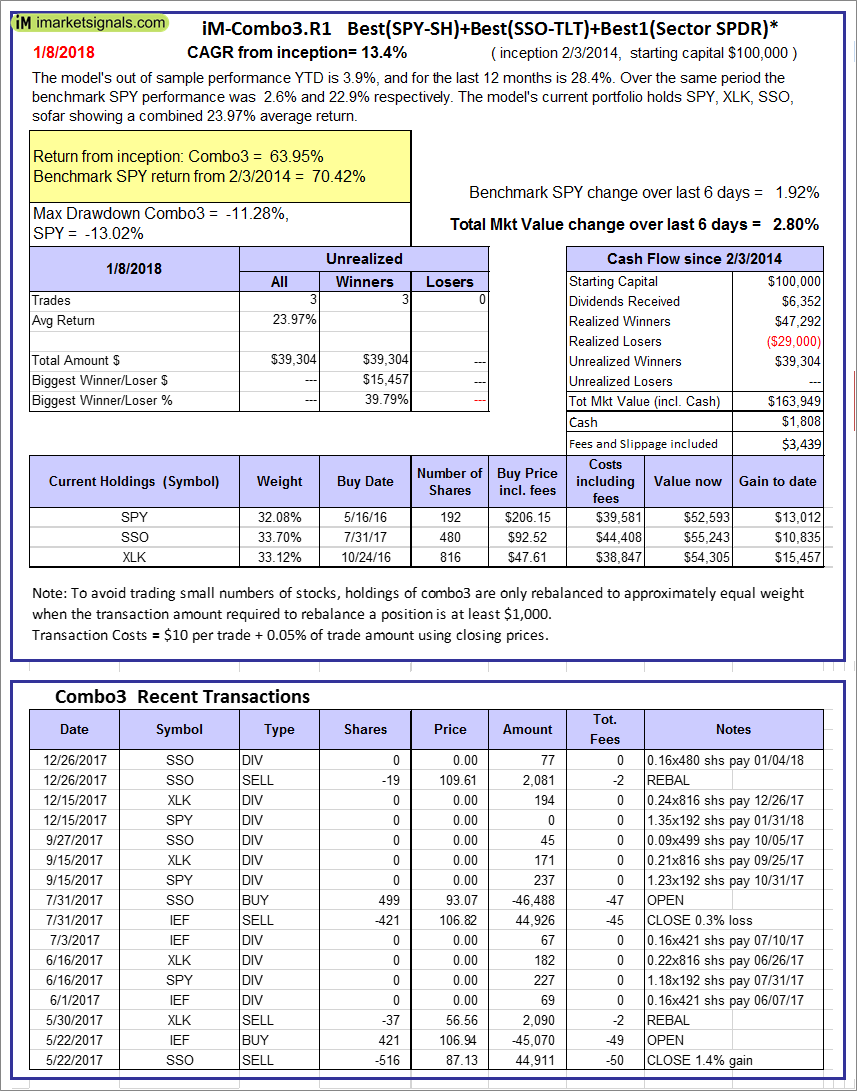 |
iM-Combo3.R1: The model’s out of sample performance YTD is 3.9%, and for the last 12 months is 28.4%. Over the same period the benchmark SPY performance was 2.6% and 22.9% respectively. Over the previous week the market value of iM-Combo3.R1 gained 2.80% at a time when SPY gained 1.92%. A starting capital of $100,000 at inception on 2/3/2014 would have grown to $163,949 which includes $1,808 cash and excludes $3,439 spent on fees and slippage. |
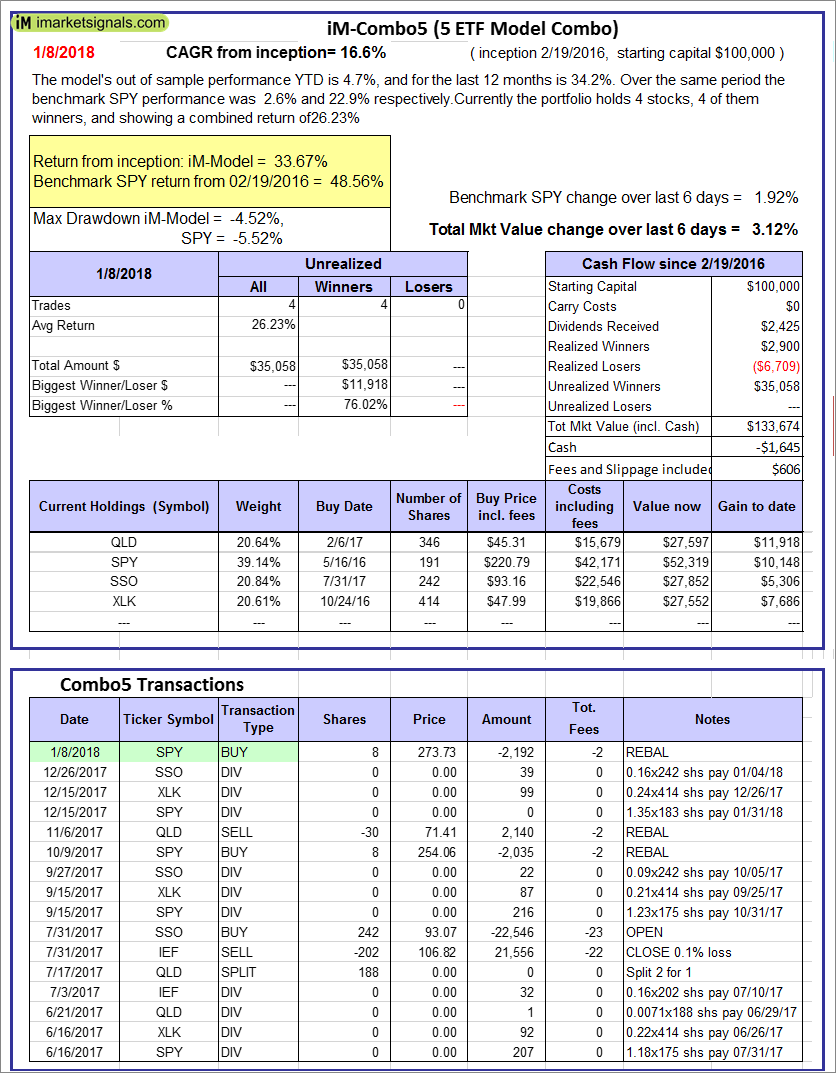 |
iM-Combo5: The model’s out of sample performance YTD is 4.7%, and for the last 12 months is 34.2%. Over the same period the benchmark SPY performance was 2.6% and 22.9% respectively. Over the previous week the market value of iM-Combo5 gained 3.12% at a time when SPY gained 1.92%. A starting capital of $100,000 at inception on 2/22/2016 would have grown to $133,674 which includes -$1,645 cash and excludes $606 spent on fees and slippage. |
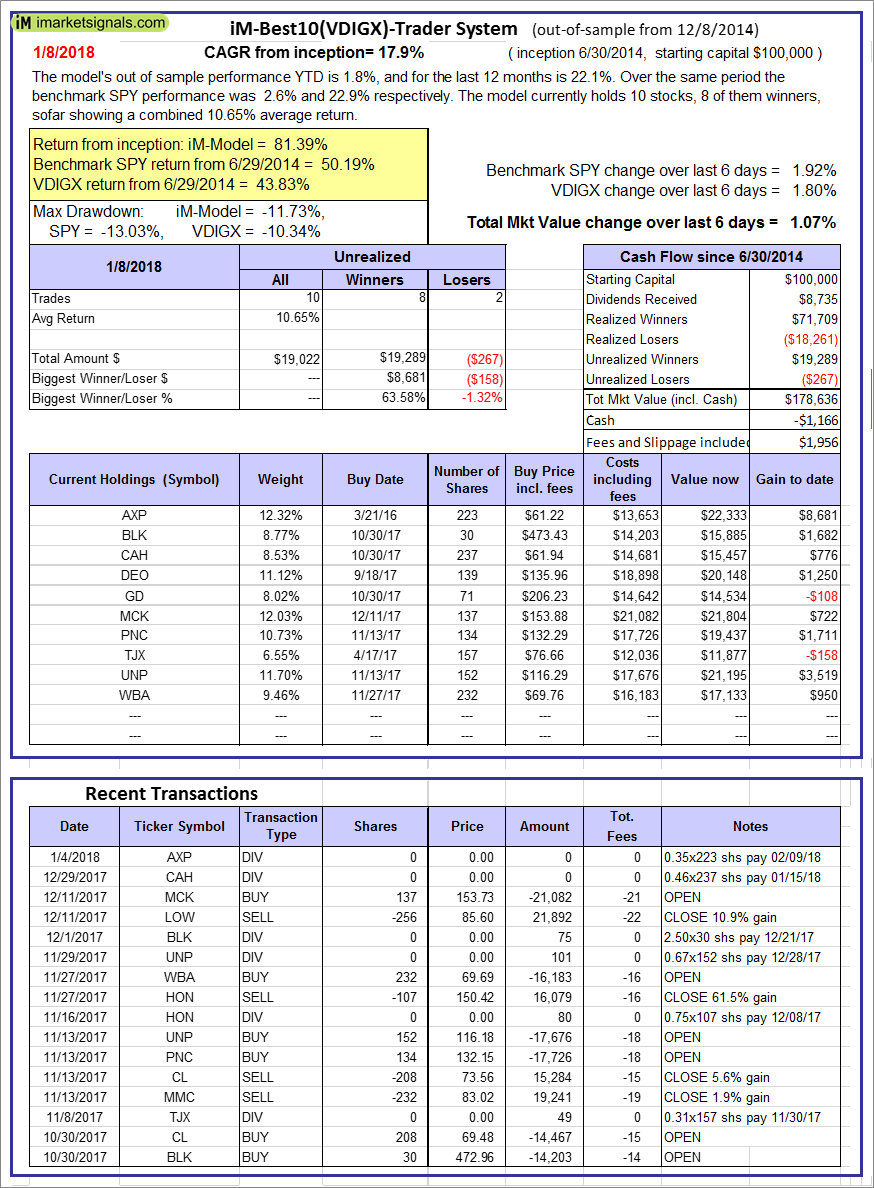 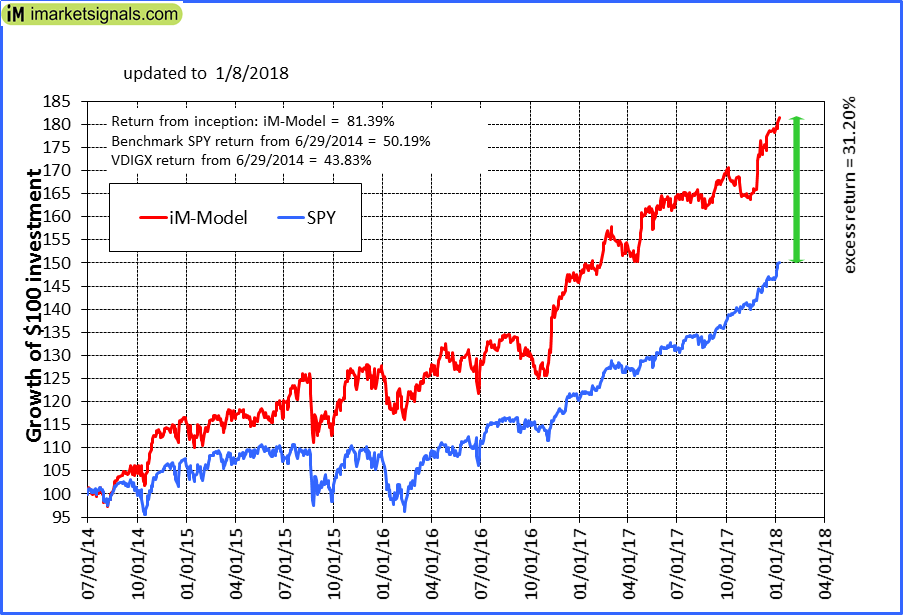 |
iM-Best10(VDIGX)-Trader: The model’s out of sample performance YTD is 1.8%, and for the last 12 months is 22.1%. Over the same period the benchmark SPY performance was 2.6% and 22.9% respectively. Since inception, on 7/1/2014, the model gained 81.39% while the benchmark SPY gained 50.19% and VDIGX gained 43.83% over the same period. Over the previous week the market value of iM-Best10(VDIGX) gained 1.07% at a time when SPY gained 1.92%. A starting capital of $100,000 at inception on 7/1/2014 would have grown to $178,636 which includes -$1,166 cash and excludes $1,956 spent on fees and slippage. |
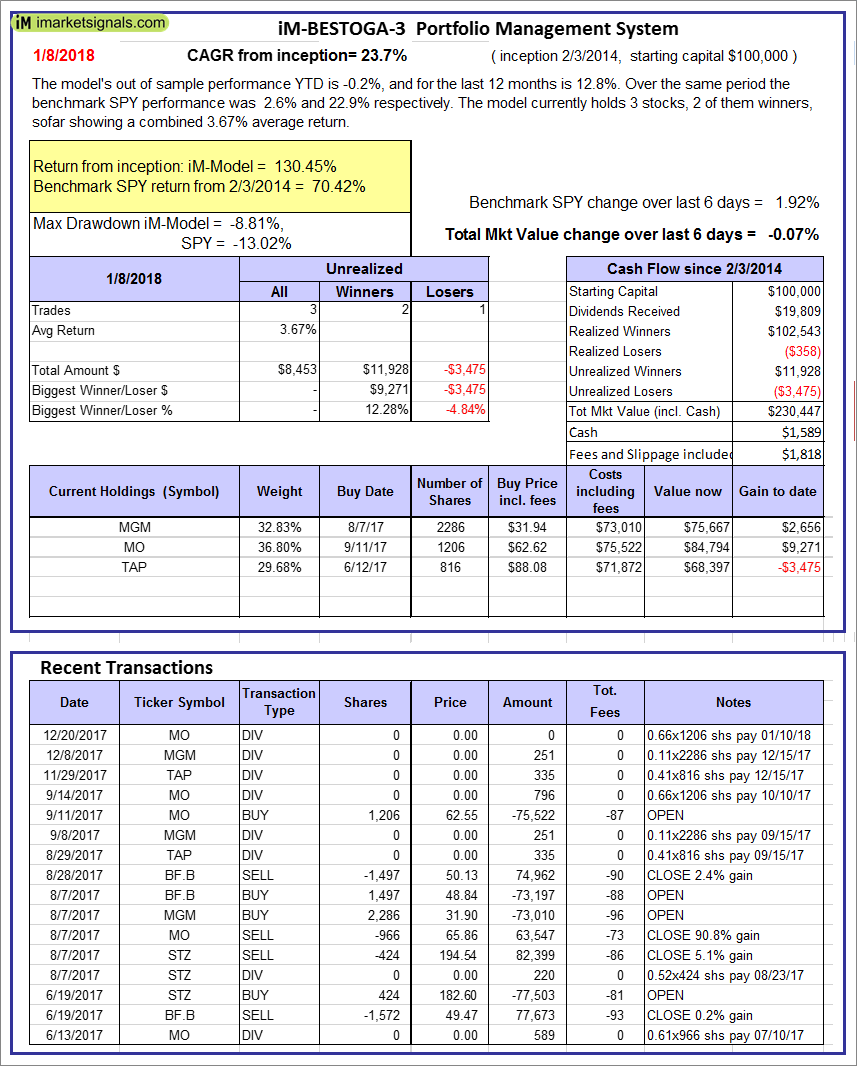 |
iM-BESTOGA-3: The model’s out of sample performance YTD is -0.2%, and for the last 12 months is 12.8%. Over the same period the benchmark SPY performance was 2.6% and 22.9% respectively. Over the previous week the market value of iM-BESTOGA-3 gained -0.07% at a time when SPY gained 1.92%. A starting capital of $100,000 at inception on 2/3/2014 would have grown to $230,447 which includes $1,589 cash and excludes $1,818 spent on fees and slippage. |
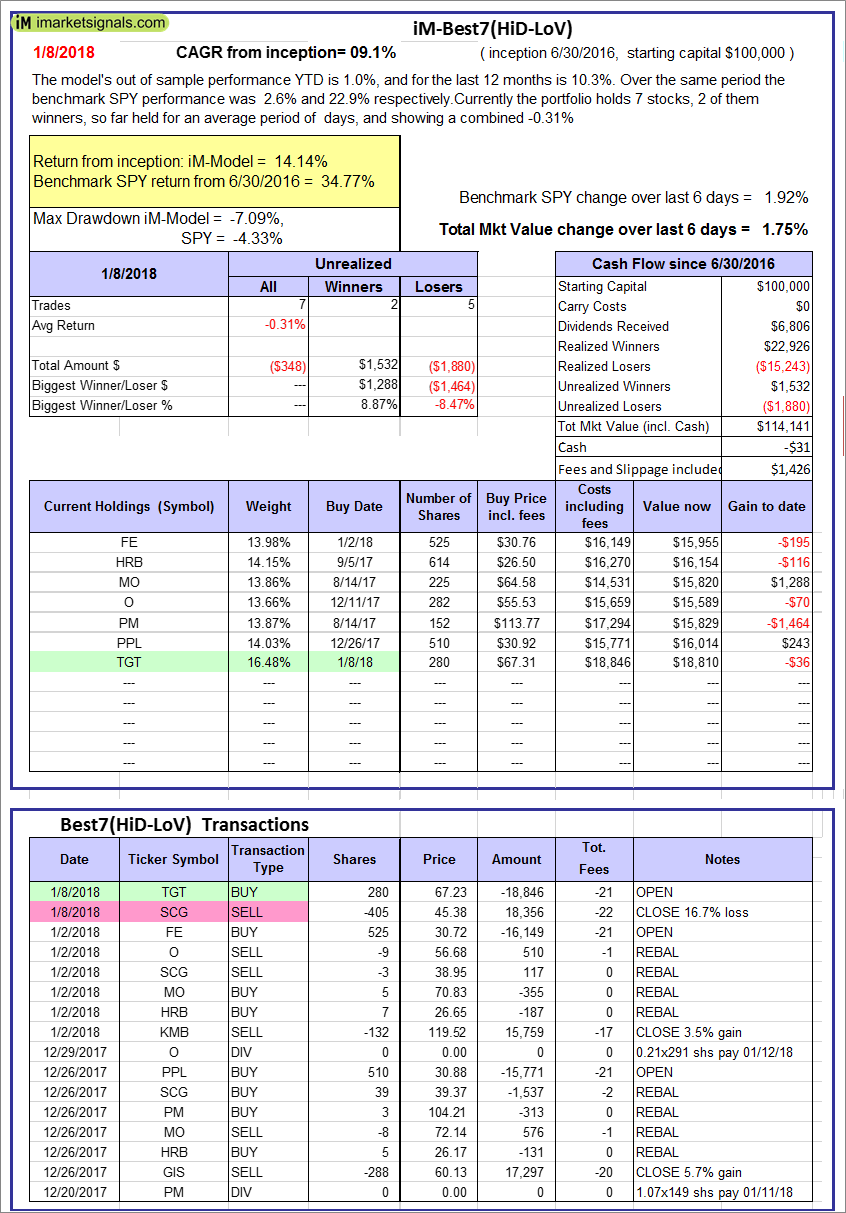 |
iM-Best7(HiD-LoV): The model’s out of sample performance YTD is 1.0%, and for the last 12 months is 10.3%. Over the same period the benchmark SPY performance was 2.6% and 22.9% respectively. Over the previous week the market value of iM-BESTOGA-3 gained 1.75% at a time when SPY gained 1.92%. A starting capital of $100,000 at inception on 6/30/2016 would have grown to $114,141 which includes -$31 cash and excludes $1,426 spent on fees and slippage. |
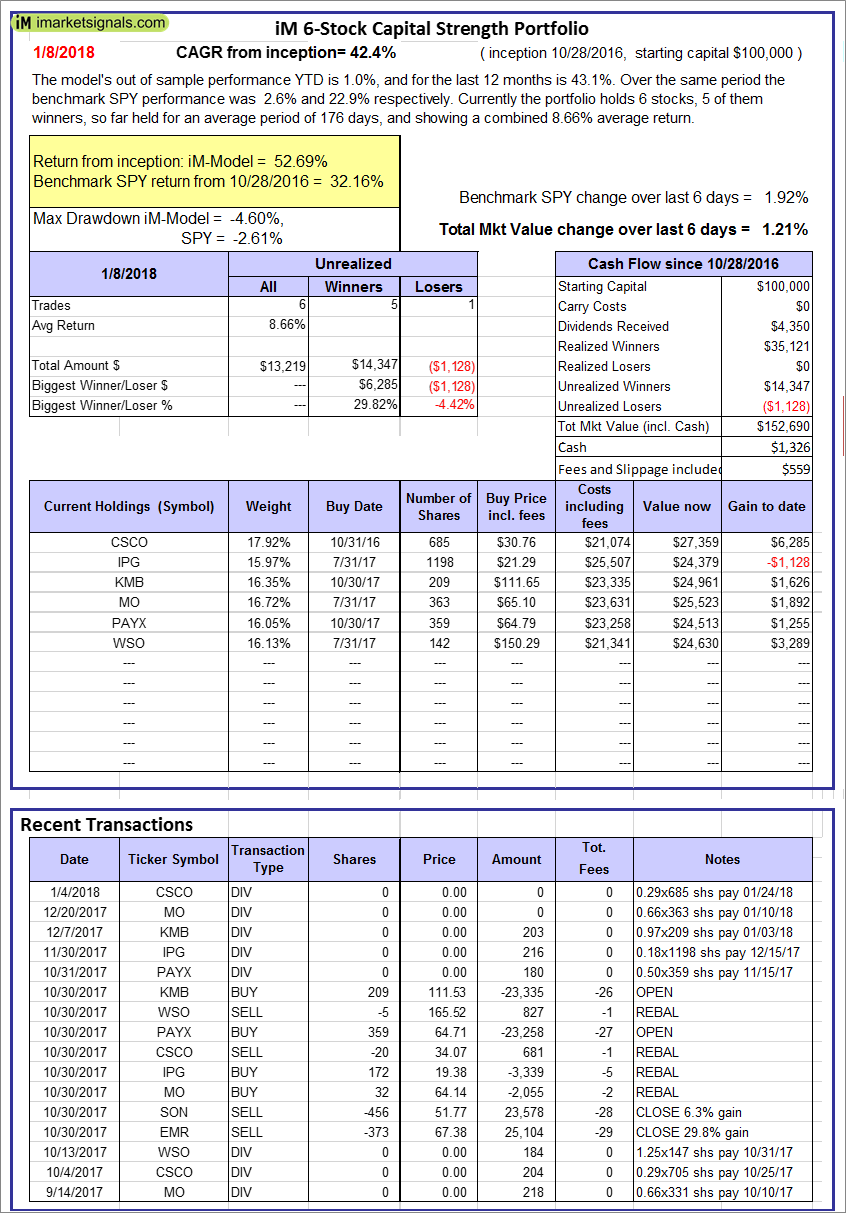 |
iM 6-Stock Capital Strength Portfolio: The model’s out of sample performance YTD is 1.0%, and for the last 12 months is 43.1%. Over the same period the benchmark SPY performance was 2.6% and 22.9% respectively. Over the previous week the market value of the iM 6-Stock Capital Strength Portfolio gained 1.21% at a time when SPY gained 1.92%. A starting capital of $100,000 at inception on 10/28/2016 would have grown to $152,690 which includes $1,326 cash and excludes $559 spent on fees and slippage. |
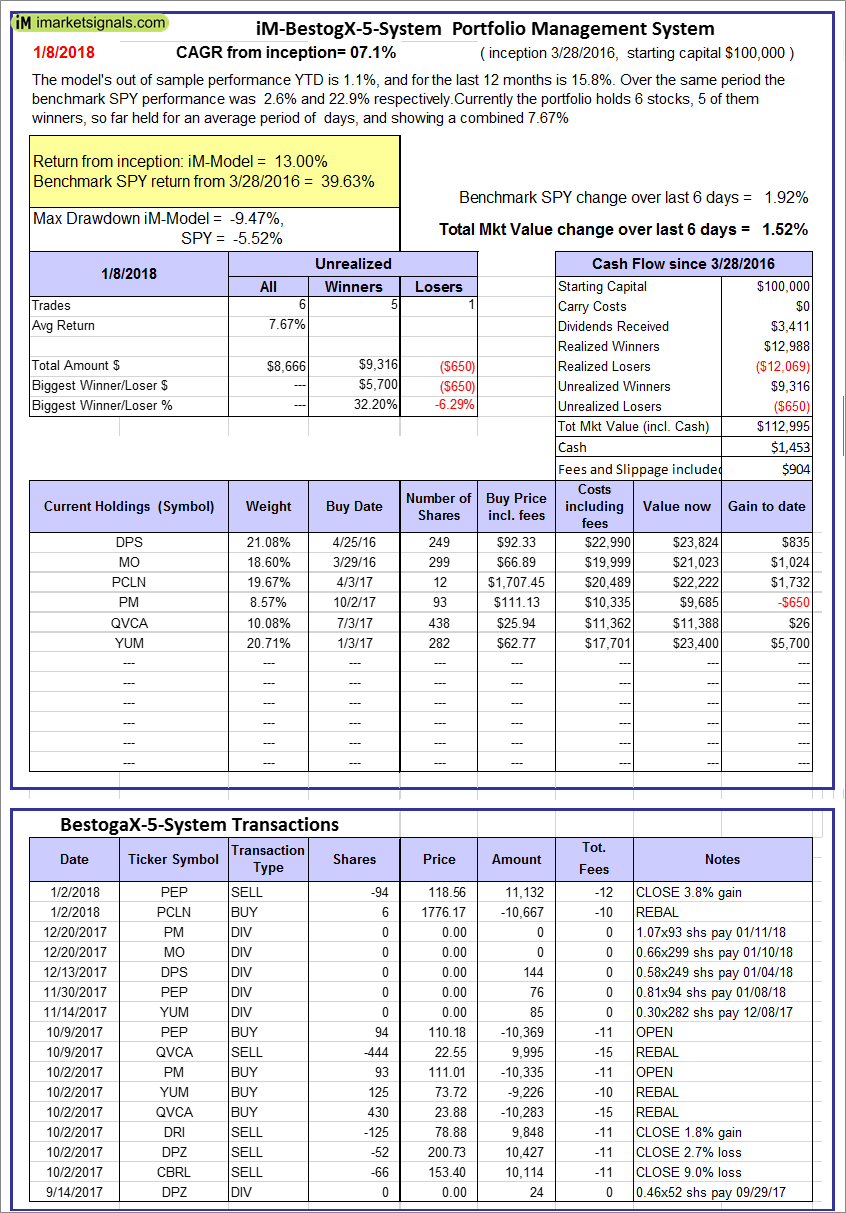 |
iM-BestogaX5-System: The model’s out of sample performance YTD is 1.1%, and for the last 12 months is 15.8%. Over the same period the benchmark SPY performance was 2.6% and 22.9% respectively. Over the previous week the market value of iM-Best8(S&P 500)Tax-Eff. gained 1.52% at a time when SPY gained 1.92%. A starting capital of $100,000 at inception on 3/28/2016 would have grown to $112,995 which includes $1,453 cash and excludes $904 spent on fees and slippage. |
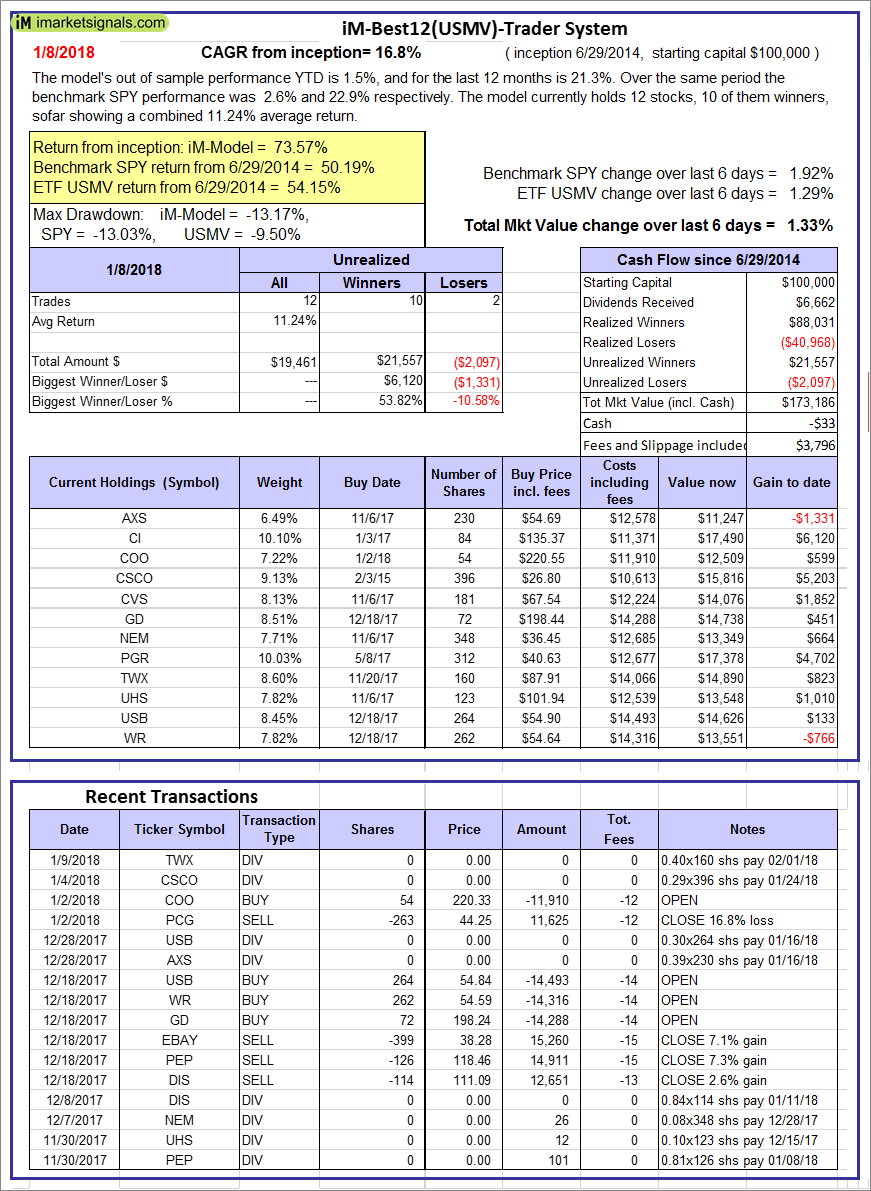 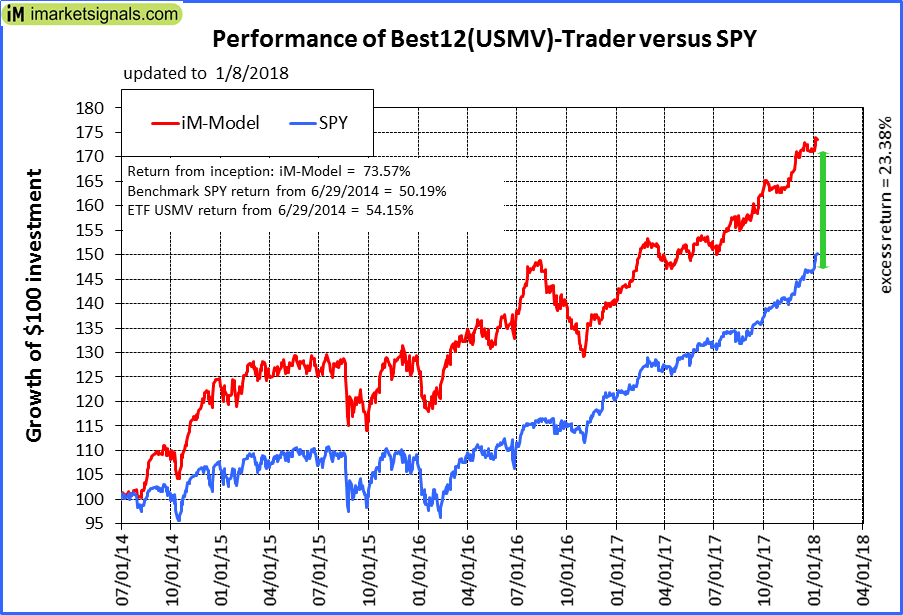 |
iM-Best12(USMV)-Trader: The model’s out of sample performance YTD is 1.5%, and for the last 12 months is 21.3%. Over the same period the benchmark SPY performance was 2.6% and 22.9% respectively. Since inception, on 6/30/2014, the model gained 73.57% while the benchmark SPY gained 50.19% and the ETF USMV gained 54.15% over the same period. Over the previous week the market value of iM-Best12(USMV)-Trader gained 1.33% at a time when SPY gained 1.92%. A starting capital of $100,000 at inception on 6/30/2014 would have grown to $173,186 which includes -$33 cash and excludes $3,796 spent on fees and slippage. |
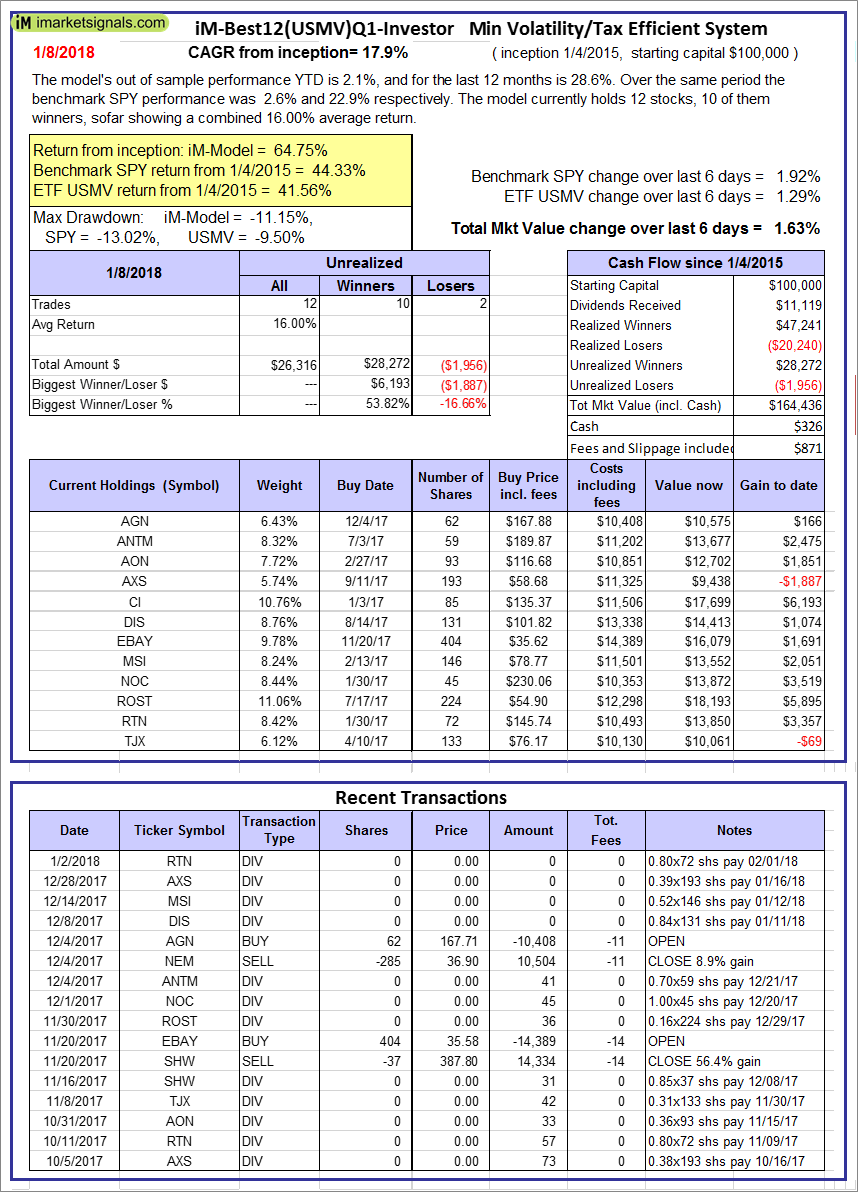 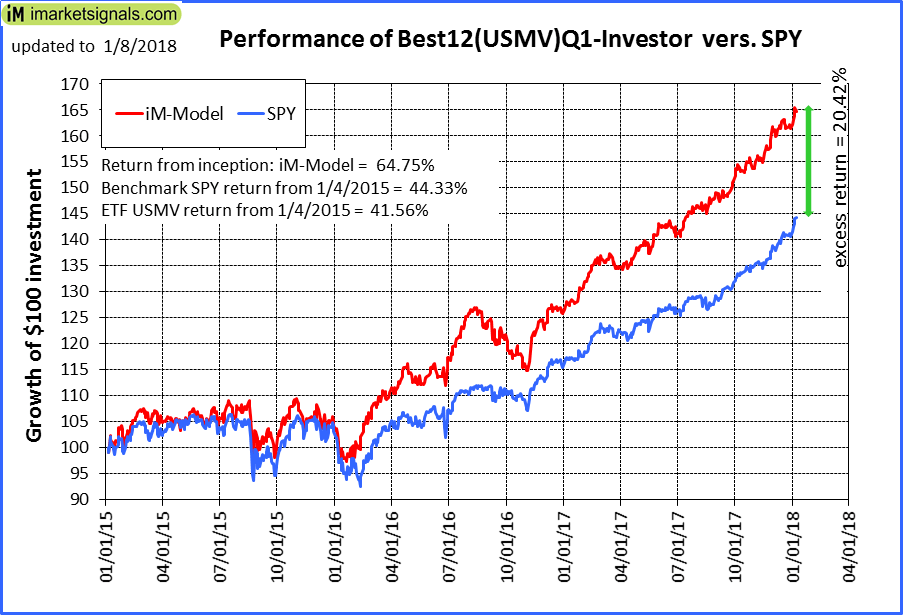 |
iM-Best12(USMV)Q1-Investor: The model’s out of sample performance YTD is 2.1%, and for the last 12 months is 28.6%. Over the same period the benchmark SPY performance was 2.6% and 22.9% respectively. Since inception, on 1/5/2015, the model gained 64.75% while the benchmark SPY gained 44.33% and the ETF USMV gained 41.56% over the same period. Over the previous week the market value of iM-Best12(USMV)Q1 gained 1.63% at a time when SPY gained 1.92%. A starting capital of $100,000 at inception on 1/5/2015 would have grown to $164,436 which includes $326 cash and excludes $871 spent on fees and slippage. |
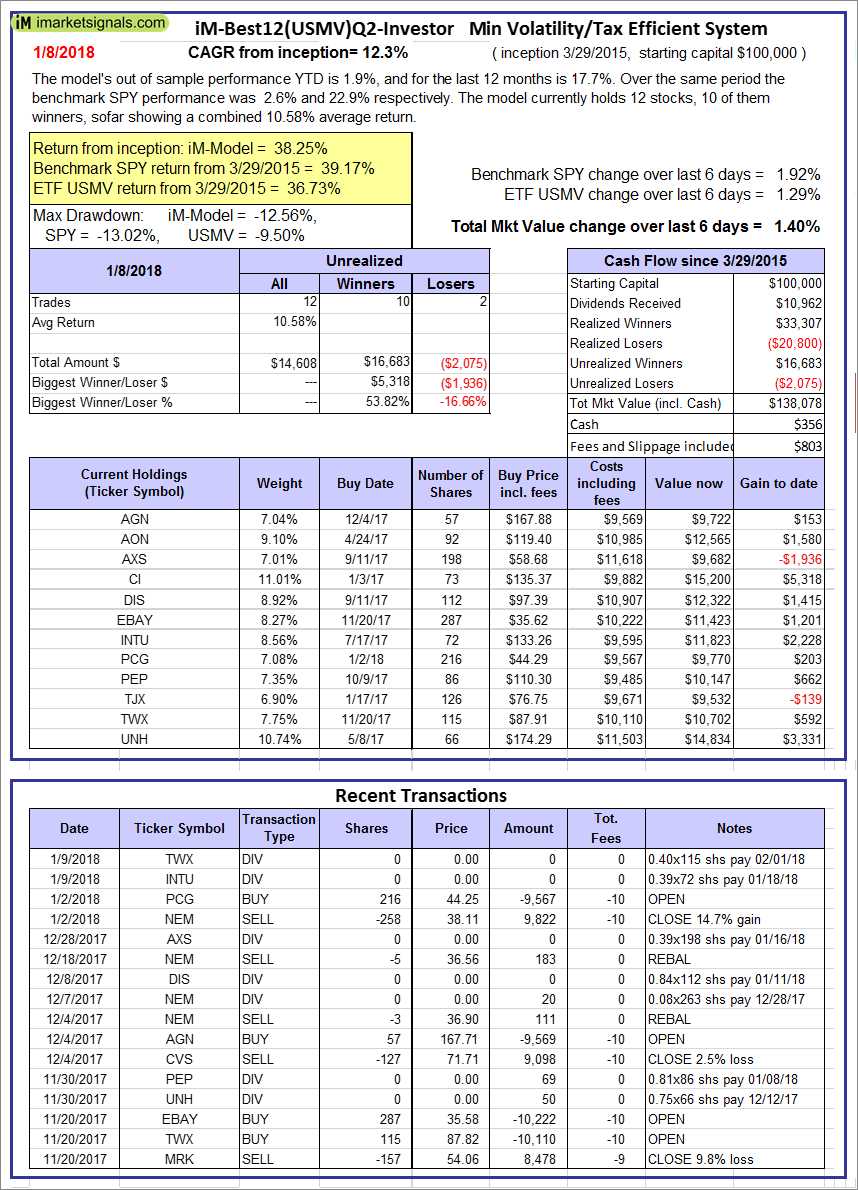 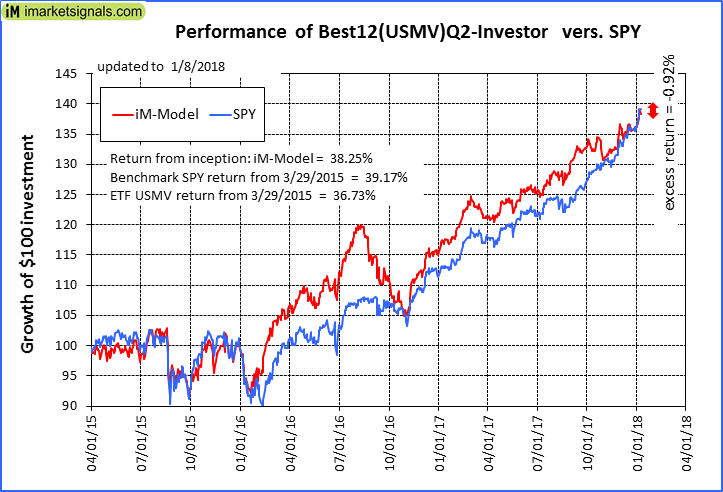 |
iM-Best12(USMV)Q2-Investor: The model’s out of sample performance YTD is 1.9%, and for the last 12 months is 17.7%. Over the same period the benchmark SPY performance was 2.6% and 22.9% respectively. Since inception, on 3/30/2015, the model gained 38.25% while the benchmark SPY gained 39.17% and the ETF USMV gained 36.73% over the same period. Over the previous week the market value of iM-Best12(USMV)Q2 gained 1.40% at a time when SPY gained 1.92%. A starting capital of $100,000 at inception on 3/30/2015 would have grown to $138,078 which includes $356 cash and excludes $803 spent on fees and slippage. |
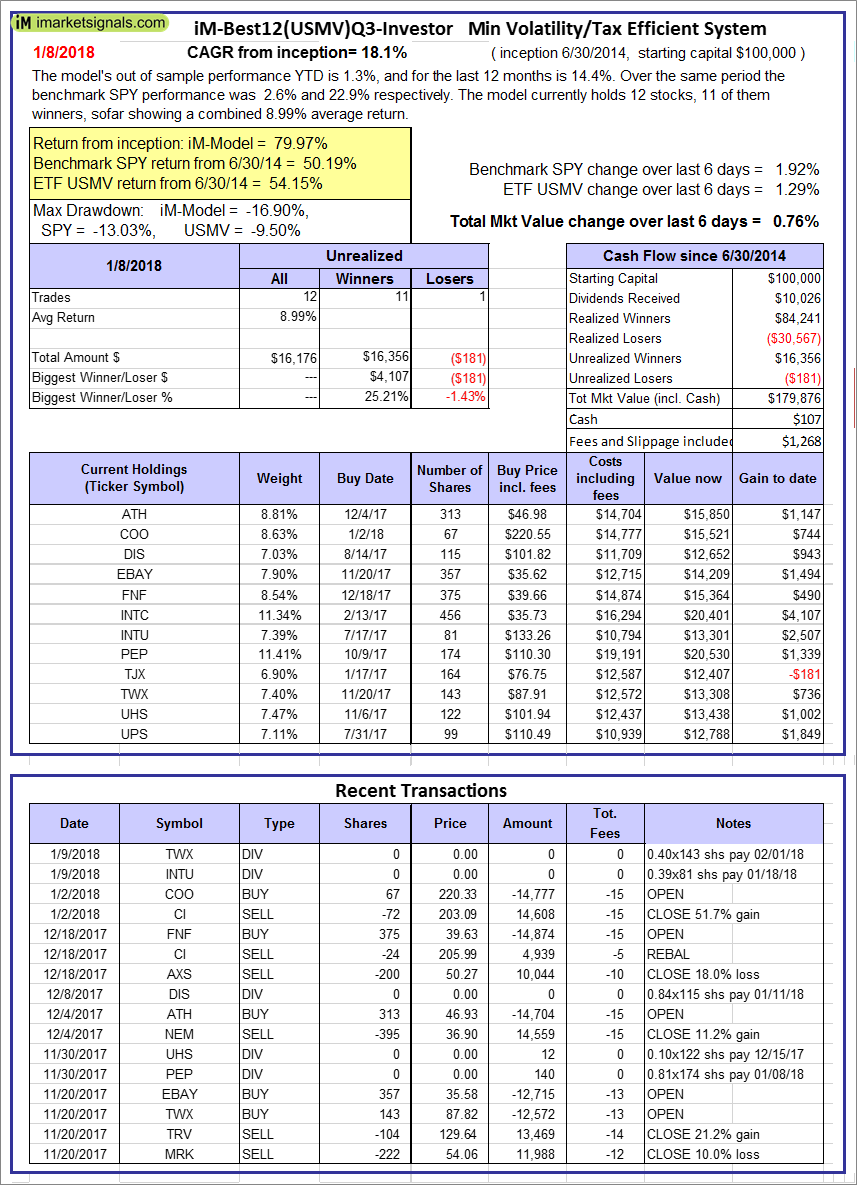 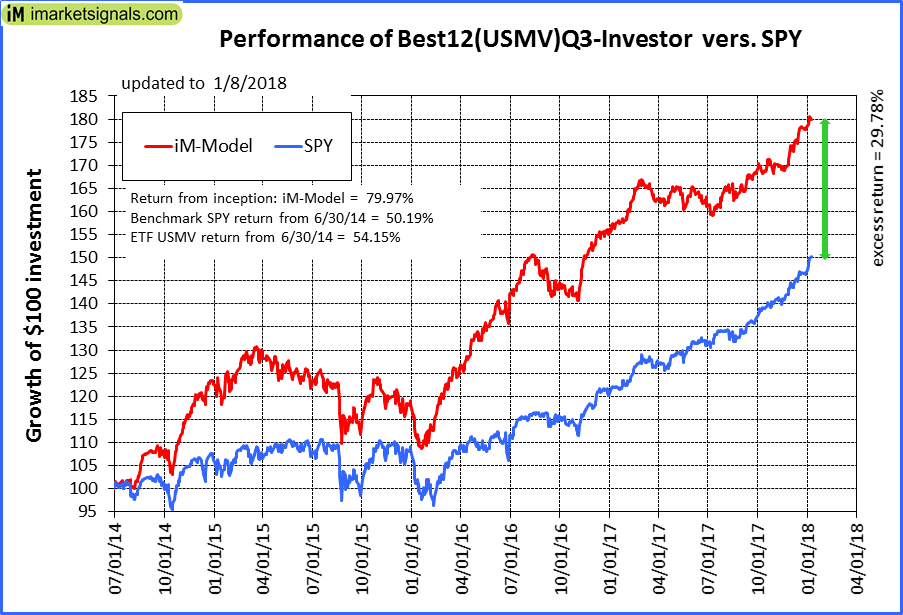 |
iM-Best12(USMV)Q3-Investor: The model’s out of sample performance YTD is 1.3%, and for the last 12 months is 14.4%. Over the same period the benchmark SPY performance was 2.6% and 22.9% respectively. Since inception, on 7/1/2014, the model gained 79.97% while the benchmark SPY gained 50.19% and the ETF USMV gained 54.15% over the same period. Over the previous week the market value of iM-Best12(USMV)Q3 gained 0.76% at a time when SPY gained 1.92%. A starting capital of $100,000 at inception on 7/1/2014 would have grown to $179,876 which includes $107 cash and excludes $1,268 spent on fees and slippage. |
 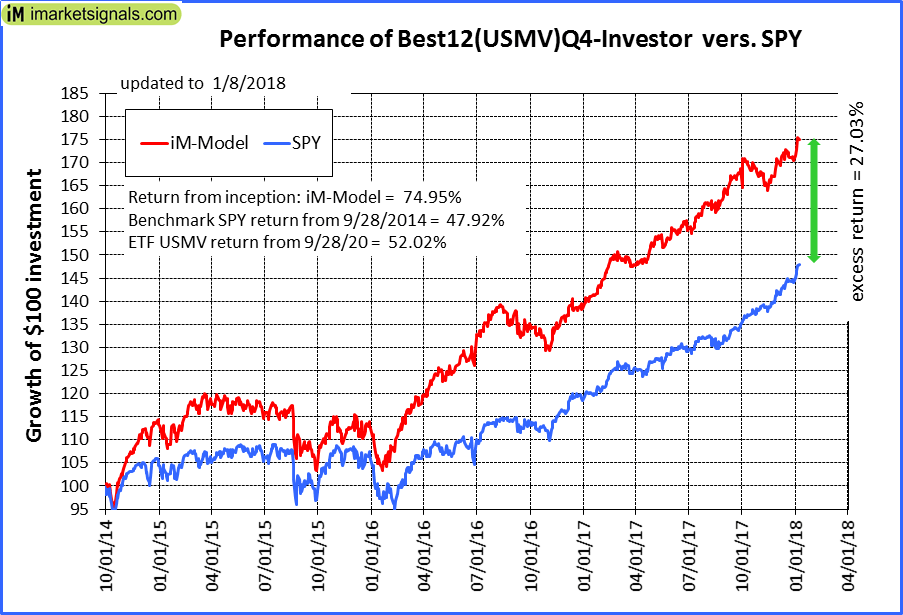 |
iM-Best12(USMV)Q4-Investor: Since inception, on 9/29/2014, the model gained 74.95% while the benchmark SPY gained 47.92% and the ETF USMV gained 52.02% over the same period. Over the previous week the market value of iM-Best12(USMV)Q4 gained 1.87% at a time when SPY gained 1.92%. A starting capital of $100,000 at inception on 9/29/2014 would have grown to $174,749 which includes -$88 cash and excludes $1,098 spent on fees and slippage. |
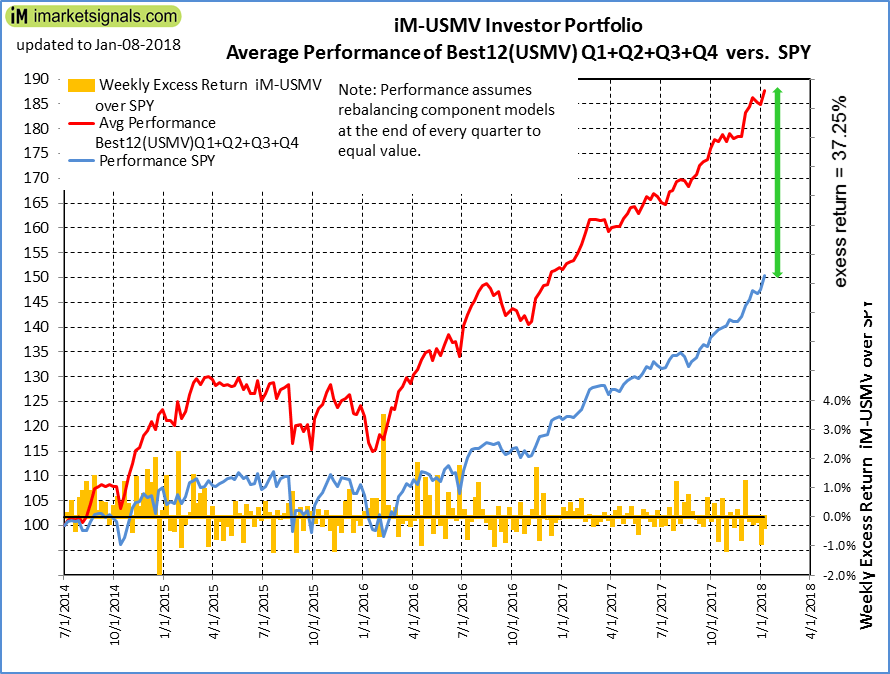 |
Average Performance of iM-Best12(USMV)Q1+Q2+Q3+Q4-Investor resulted in an excess return of 37.25% over SPY. (see iM-USMV Investor Portfolio) |
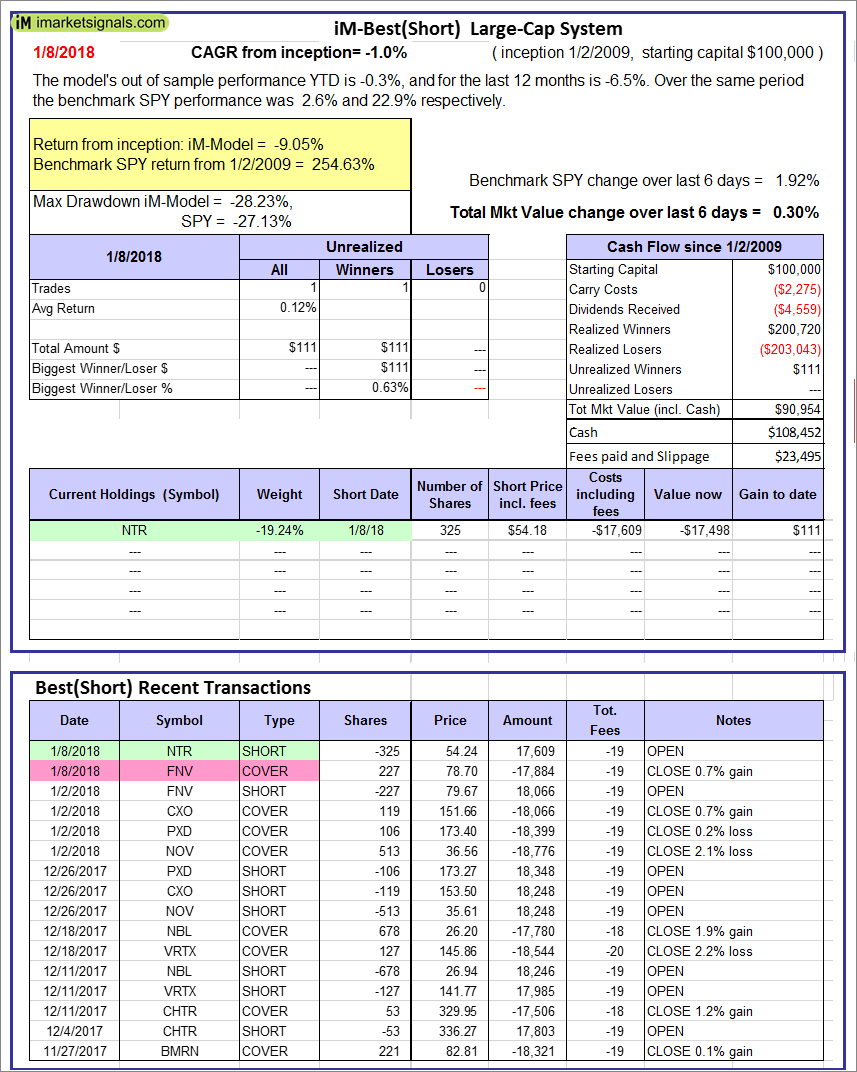 |
iM-Best(Short): The model’s out of sample performance YTD is -0.3%, and for the last 12 months is -6.5%. Over the same period the benchmark SPY performance was 2.6% and 22.9% respectively. Over the previous week the market value of iM-Best(Short) gained 0.30% at a time when SPY gained 1.92%. Over the period 1/2/2009 to 1/8/2018 the starting capital of $100,000 would have grown to $90,954 which includes $108,452 cash and excludes $23,495 spent on fees and slippage. |
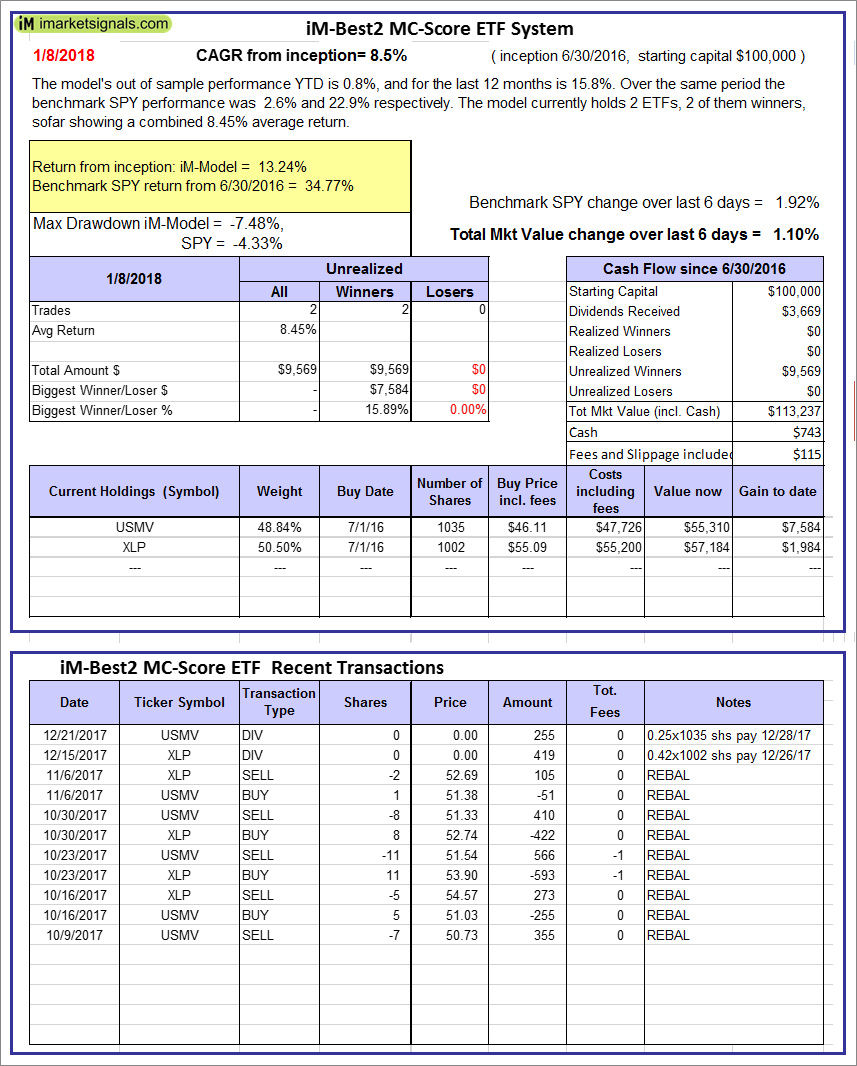 |
iM-Best2 MC-Score ETF System: The model’s out of sample performance YTD is 0.8%, and for the last 12 months is 15.8%. Over the same period the benchmark SPY performance was 2.6% and 22.9% respectively. Over the previous week the market value of the iM-Best2 MC-Score ETF System gained 1.10% at a time when SPY gained 1.92%. A starting capital of $100,000 at inception on 6/30/2016 would have grown to $113,237 which includes $743 cash and excludes $115 spent on fees and slippage. |
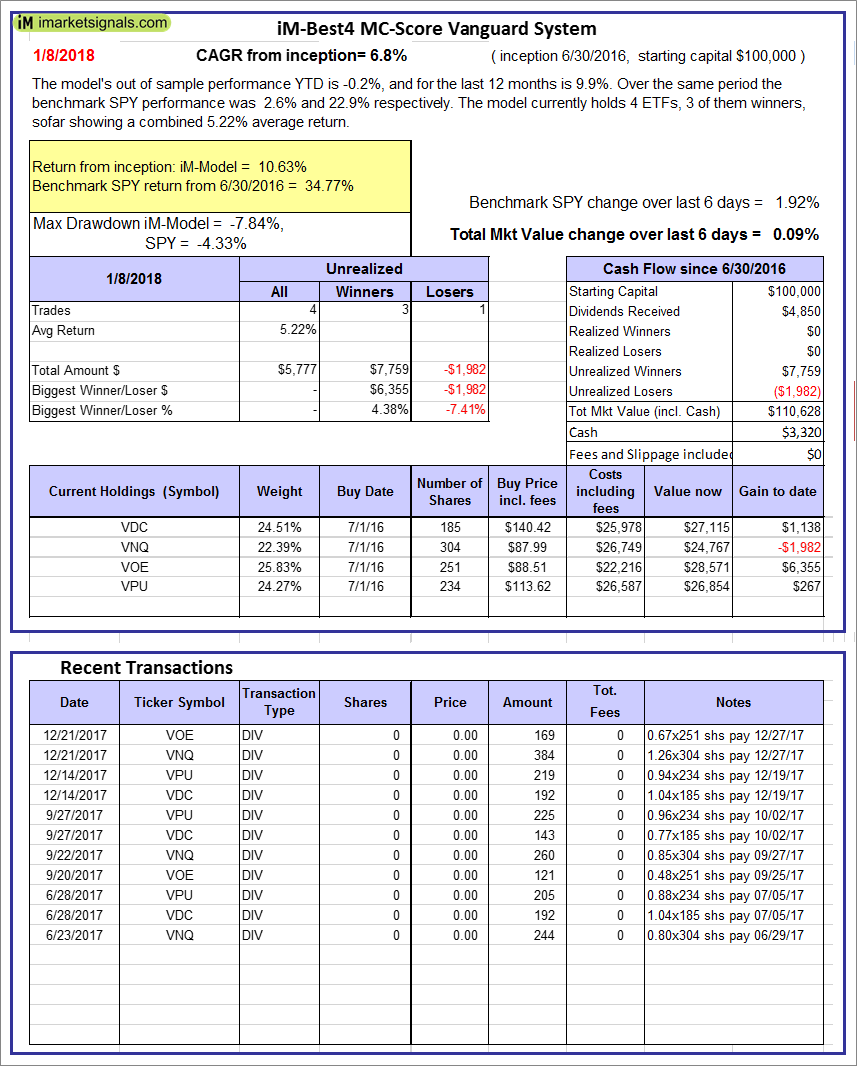 |
iM-Best4 MC-Score Vanguard System: The model’s out of sample performance YTD is -0.2%, and for the last 12 months is 9.9%. Over the same period the benchmark SPY performance was 2.6% and 22.9% respectively. Over the previous week the market value of the iM-Best4 MC-Score Vanguard System gained 0.09% at a time when SPY gained 1.92%. A starting capital of $100,000 at inception on 6/30/2016 would have grown to $110,628 which includes $3,320 cash and excludes $00 spent on fees and slippage. |
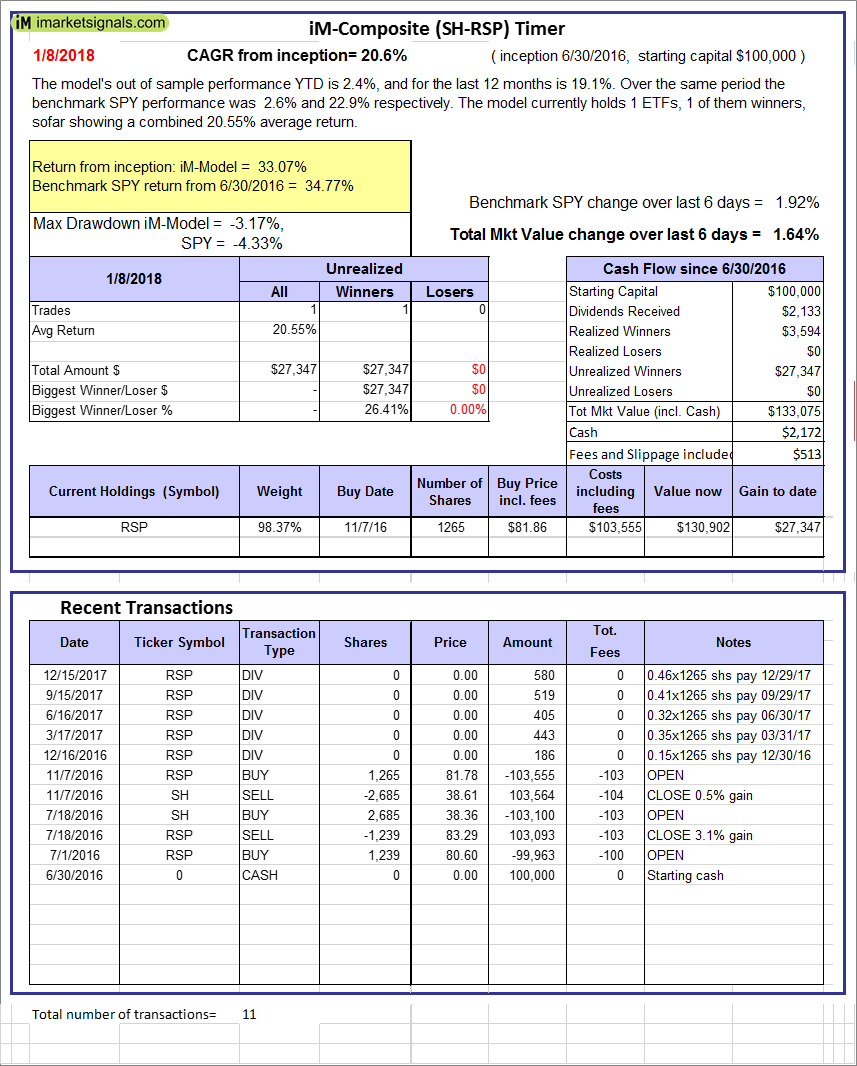 |
iM-Composite (SH-RSP) Timer: The model’s out of sample performance YTD is 2.4%, and for the last 12 months is 19.1%. Over the same period the benchmark SPY performance was 2.6% and 22.9% respectively. Over the previous week the market value of the iM-Composite (SH-RSP) Timer gained 1.64% at a time when SPY gained 1.92%. A starting capital of $100,000 at inception on 6/30/2016 would have grown to $133,075 which includes $2,172 cash and excludes $513 spent on fees and slippage. |
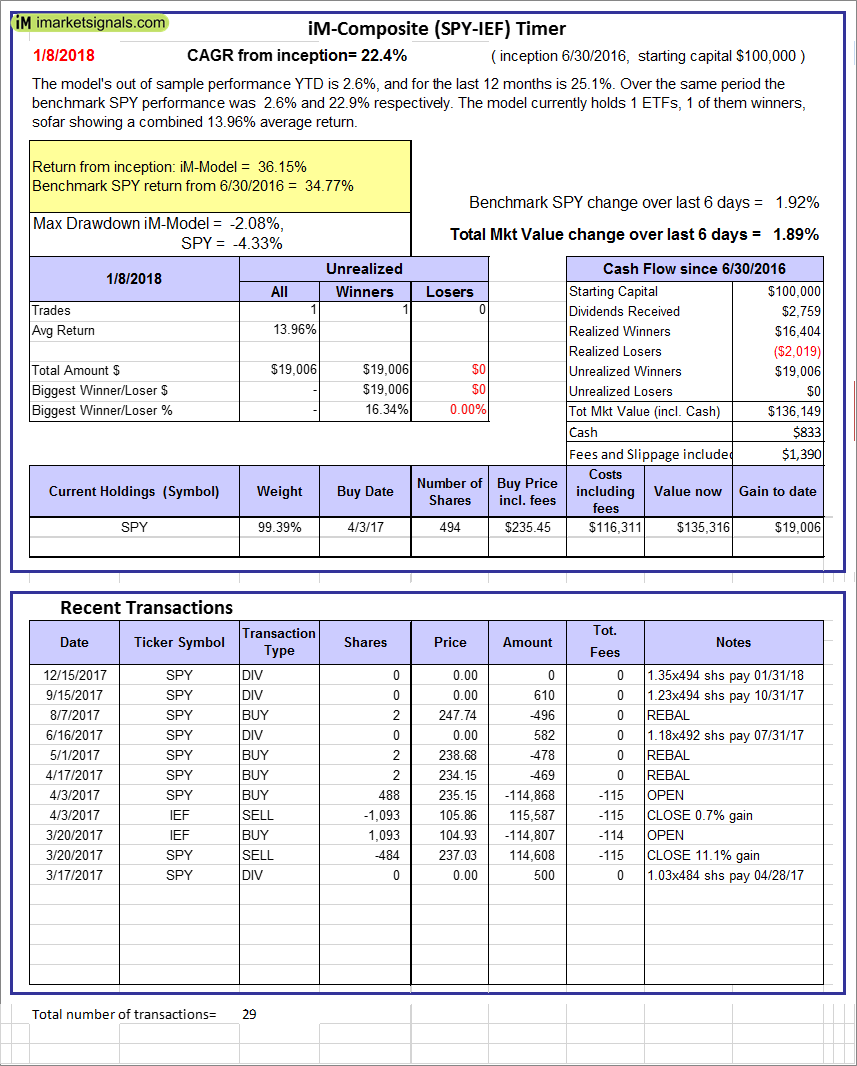 |
iM-Composite (SPY-IEF) Timer: The model’s out of sample performance YTD is 2.6%, and for the last 12 months is 25.1%. Over the same period the benchmark SPY performance was 2.6% and 22.9% respectively. Over the previous week the market value of the iM-Composite (SPY-IEF) Timer gained 1.89% at a time when SPY gained 1.92%. A starting capital of $100,000 at inception on 6/30/2016 would have grown to $136,149 which includes $833 cash and excludes $1,390 spent on fees and slippage. |
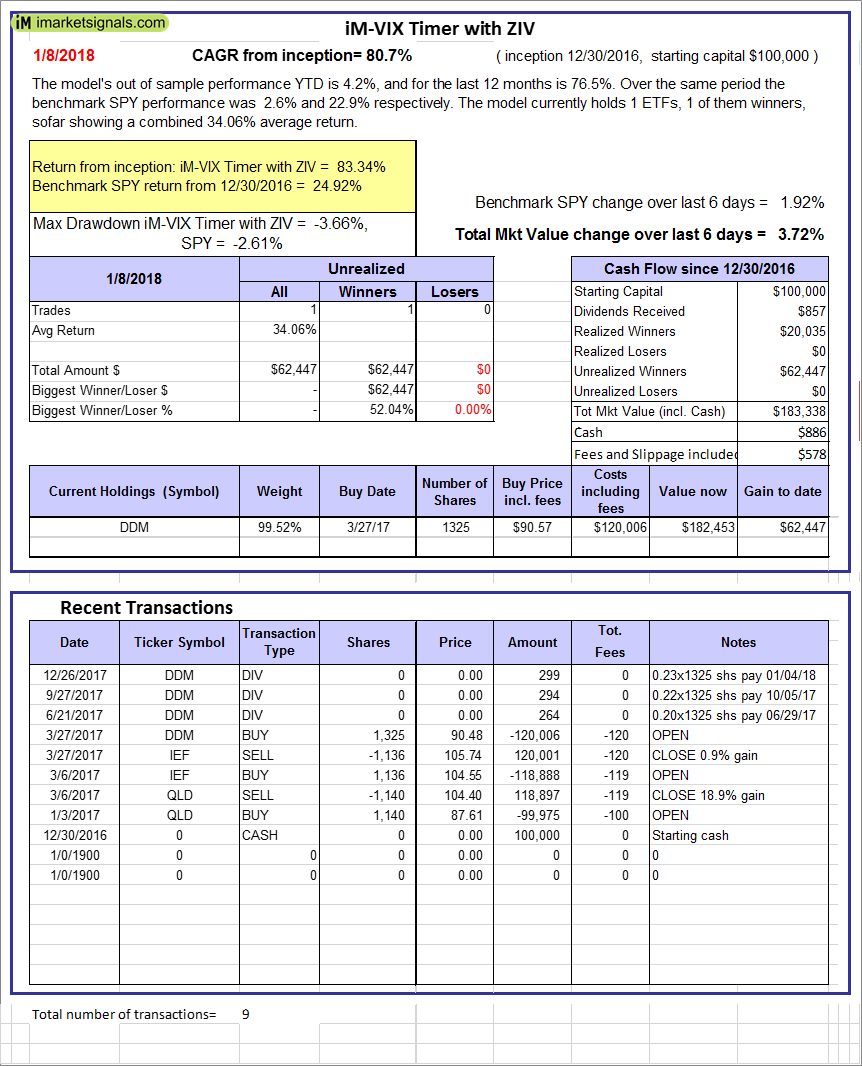 |
iM-VIX Timer with ZIV: The model’s out of sample performance YTD is 4.2%, and for the last 12 months is 76.5%. Over the same period the benchmark SPY performance was 2.6% and 22.9% respectively. Over the previous week the market value of the iM-VIX Timer with ZIV gained 3.72% at a time when SPY gained 1.92%. A starting capital of $100,000 at inception on 6/30/2016 would have grown to $183,338 which includes $886 cash and excludes $578 spent on fees and slippage. |
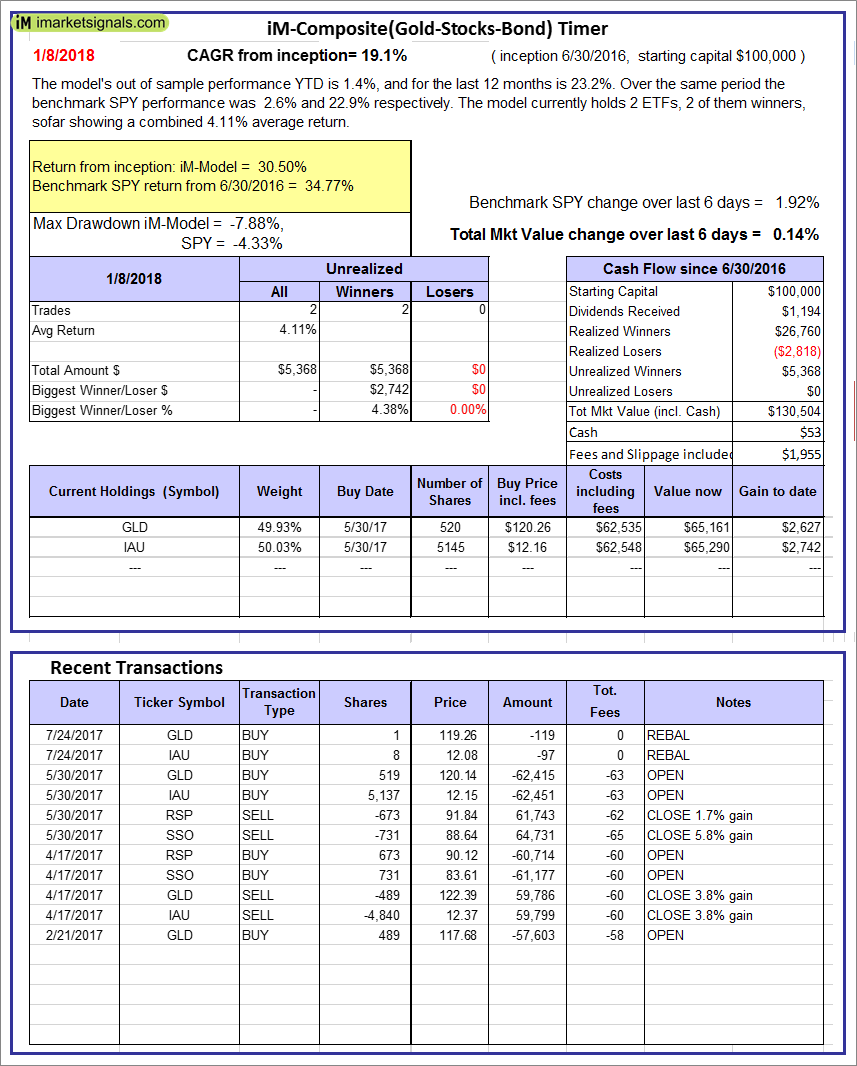 |
iM-Composite(Gold-Stocks-Bond) Timer: The model’s out of sample performance YTD is 1.4%, and for the last 12 months is 23.2%. Over the same period the benchmark SPY performance was 2.6% and 22.9% respectively. Over the previous week the market value of the iM-Composite(Gold-Stocks-Bond) Timer gained 0.14% at a time when SPY gained 1.92%. A starting capital of $100,000 at inception on 6/30/2016 would have grown to $130,504 which includes $53 cash and excludes $1,955 spent on fees and slippage. |
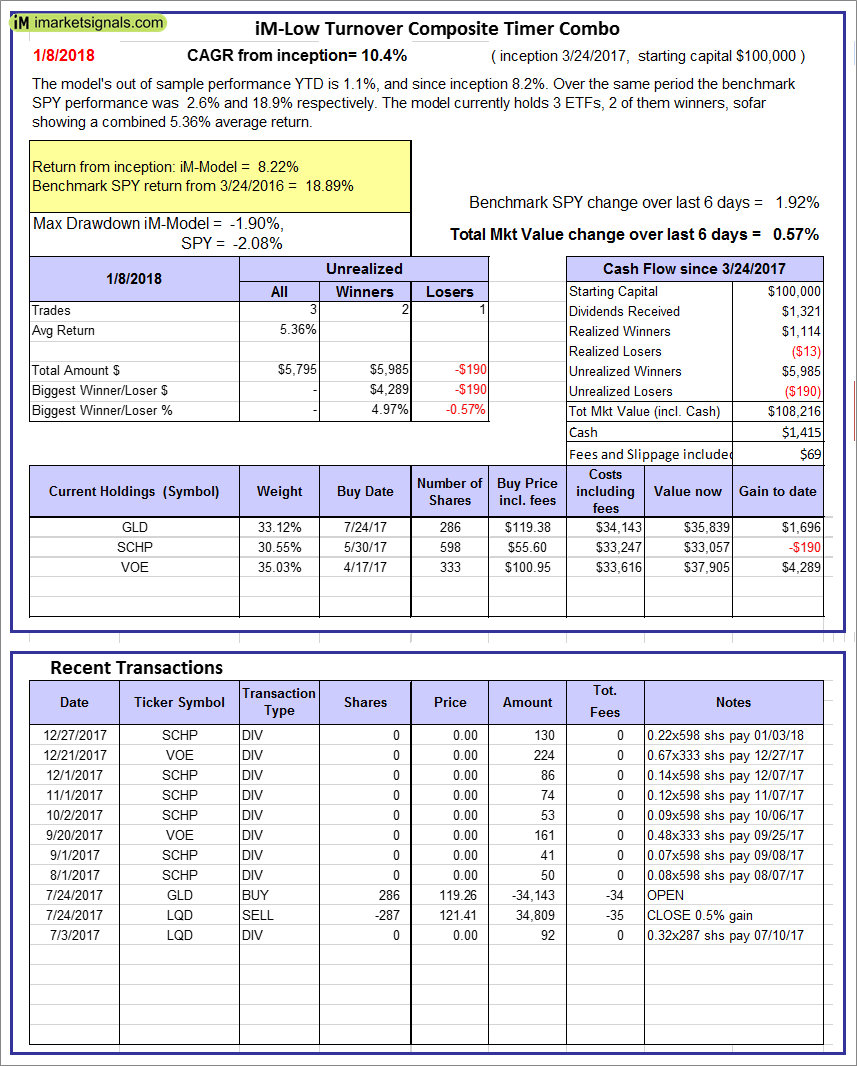 |
iM-Low Turnover Composite Timer Combo: The model’s out of sample performance YTD is 1.1%, and since inception 8.2%. Over the same period the benchmark SPY performance was 2.6% and 18.9% respectively. Over the previous week the market value of the iM-Low Turnover Composite Timer Combo gained 0.57% at a time when SPY gained 1.92%. A starting capital of $100,000 at inception on 3/24/27 would have grown to $108,216 which includes $1,415 cash and excludes $69 spent on fees and slippage. |
 |
iM-Min Drawdown Combo: The model’s out of sample performance YTD is 1.2%, and since inception 9.2%. Over the same period the benchmark SPY performance was 2.6% and 18.4% respectively. Over the previous week the market value of the iM-Min Drawdown Combo gained 0.95% at a time when SPY gained 1.92%. A starting capital of $100,000 at inception on 4/5/2017 would have grown to $108,952 which includes $296 cash and excludes $153 spent on fees and slippage. |
 |
iM-5ETF Trader (includes leveraged ETFs): The model’s out of sample performance YTD is 4.8%, and for the last 12 months is 47.1%. Over the same period the benchmark SPY performance was 2.6% and 22.9% respectively. Over the previous week the market value of the iM-5ETF Trader (includes leveraged ETFs) gained 3.19% at a time when SPY gained 1.92%. A starting capital of $100,000 at inception on 10/30/2016 would have grown to $170,577 which includes $1,064 cash and excludes $1,030 spent on fees and slippage. |
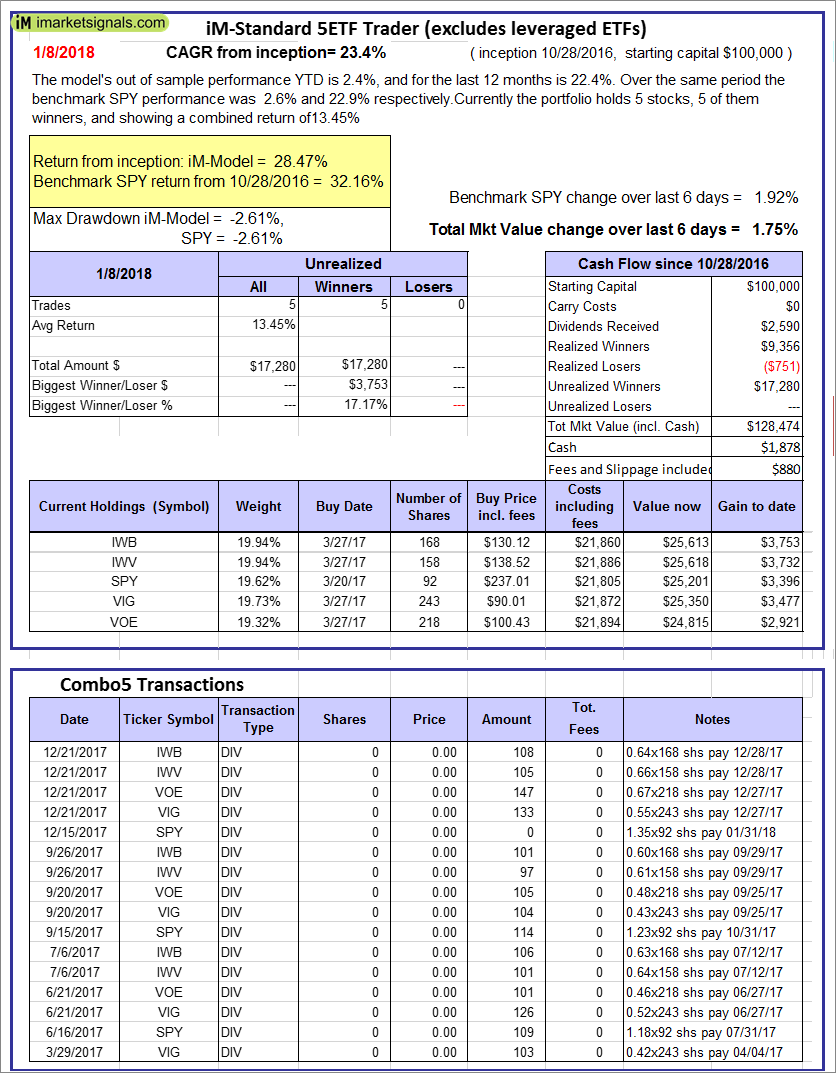 |
iM-Standard 5ETF Trader (excludes leveraged ETFs): The model’s out of sample performance YTD is 2.4%, and for the last 12 months is 22.4%. Over the same period the benchmark SPY performance was 2.6% and 22.9% respectively. Over the previous week the market value of the iM-Standard 5ETF Trader (excludes leveraged ETFs) gained 1.75% at a time when SPY gained 1.92%. A starting capital of $100,000 at inception on 10/30/2016 would have grown to $128,474 which includes $1,878 cash and excludes $880 spent on fees and slippage. |
Posted in pmp SPY-SH
The Unemployment Rate is Not Signaling a Recession: Update January 5, 2018
A reliable source for recession forecasting is the unemployment rate, which can provide signals for the beginnings and ends of recessions. The unemployment rate model (article link), updated with the October figure of 4.1%, does not signal a recession now.
Read more >
Posted in UER
No Sight of Next Recession: Business Cycle Index Update 1/4/2018
Is your investment strategy protecting your assets from the next recession? Our Business Cycle Index is a tool to help you gauge recession risk.
Posted in BCI
With reference to Section 202(a)(11)(D) of the Investment Advisers Act:
We are Engineers and not Investment Advisers,
read more ...
By the mere act of reading this page and navigating this site you acknowledge, agree to, and abide by the
Terms of Use / Disclaimer