
  |
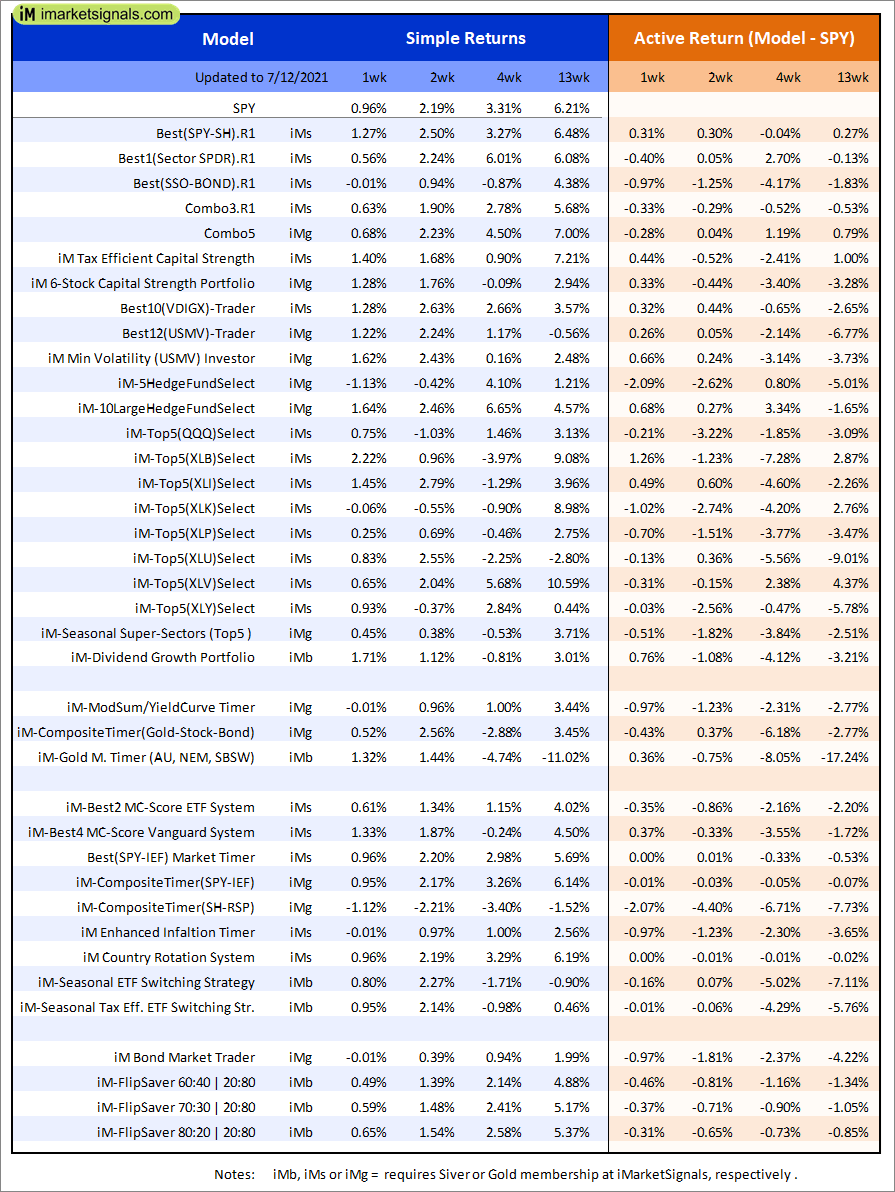
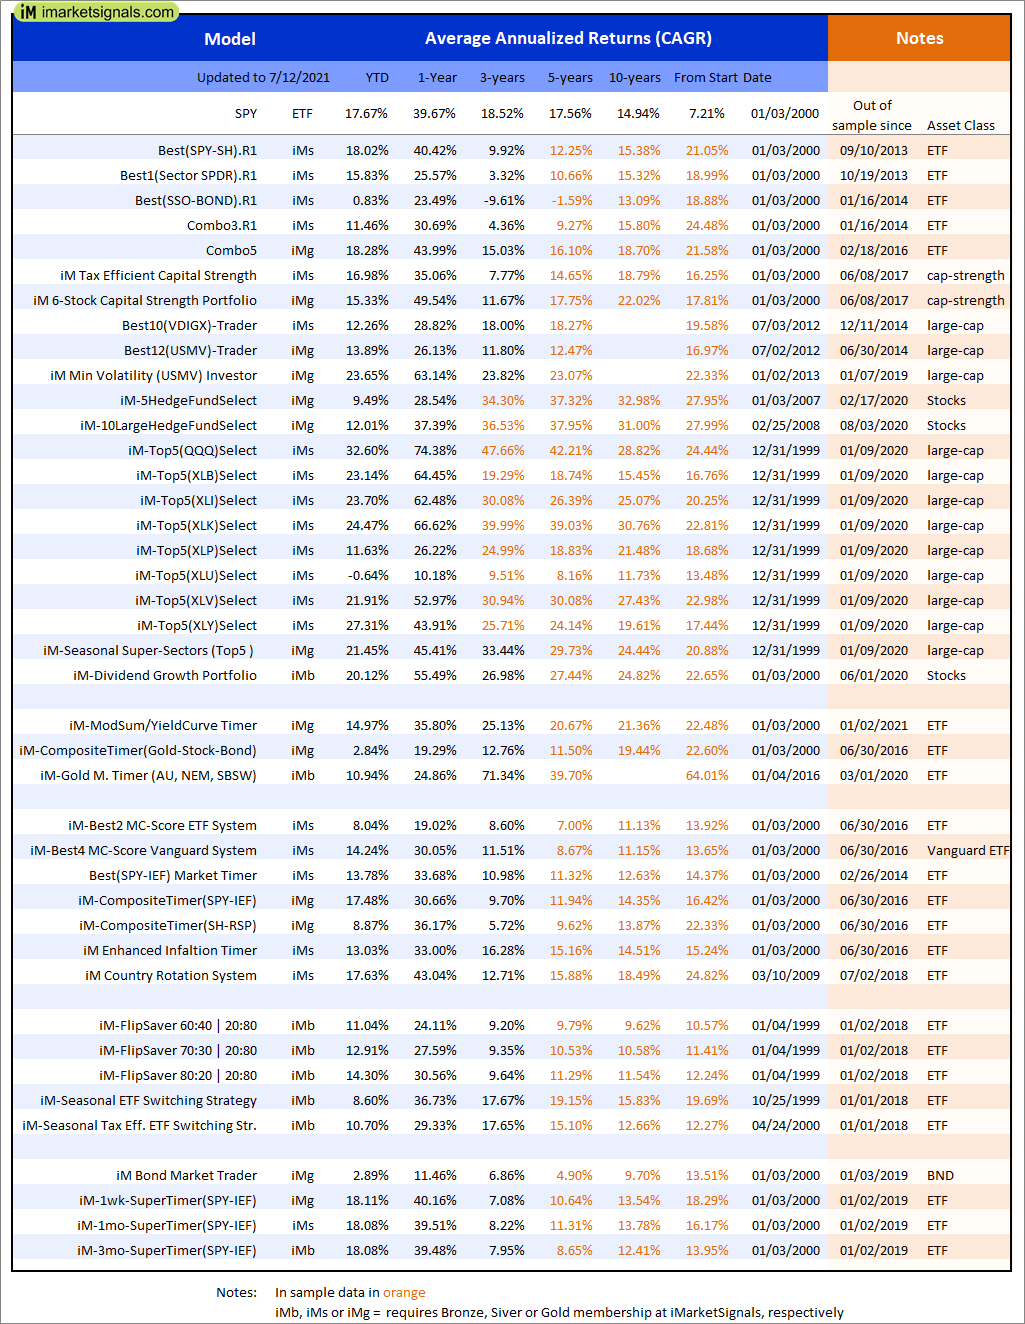
Out of sample performance summary of our models for the past 1, 2, 4 and 13 week periods. The active active return indicates how the models over- or underperformed the benchmark ETF SPY. Also the YTD, and the 1-, 3-, 5- and 10-year annualized returns are shown in the second table |
 |
iM-FlipSaver 60:40 | 20:80 – 2017: The model’s out of sample performance YTD is 11.5%, and for the last 12 months is 24.6%. Over the same period the benchmark E60B40 performance was 9.8% and 22.3% respectively. Over the previous week the market value of iM-FlipSaver 80:20 | 20:80 gained 0.53% at a time when SPY gained 0.56%. A starting capital of $100,000 at inception on 7/16/2015 would have grown to $153,859 which includes $992 cash and excludes $1,784 spent on fees and slippage. |
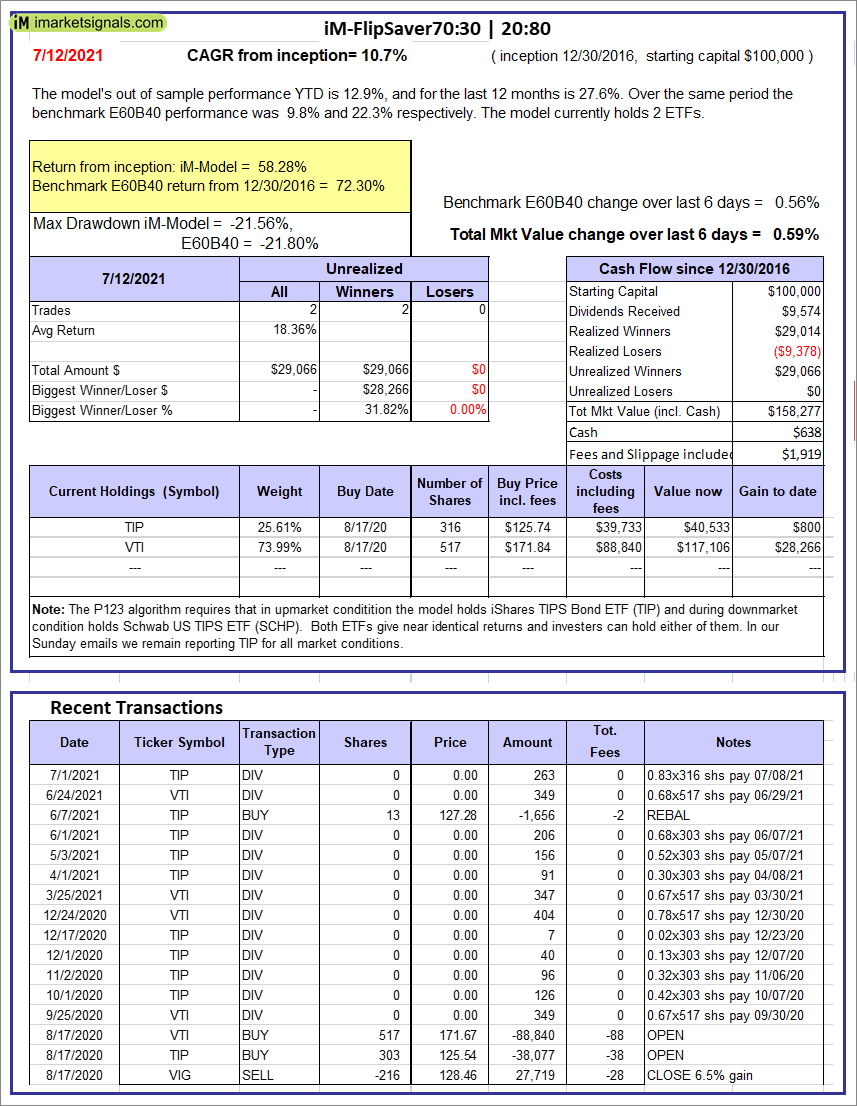 |
iM-FlipSaver 70:30 | 20:80 – 2017: The model’s out of sample performance YTD is 12.9%, and for the last 12 months is 27.6%. Over the same period the benchmark E60B40 performance was 9.8% and 22.3% respectively. Over the previous week the market value of iM-FlipSaver 70:30 | 20:80 gained 0.59% at a time when SPY gained 0.56%. A starting capital of $100,000 at inception on 7/15/2015 would have grown to $158,277 which includes $638 cash and excludes $1,919 spent on fees and slippage. |
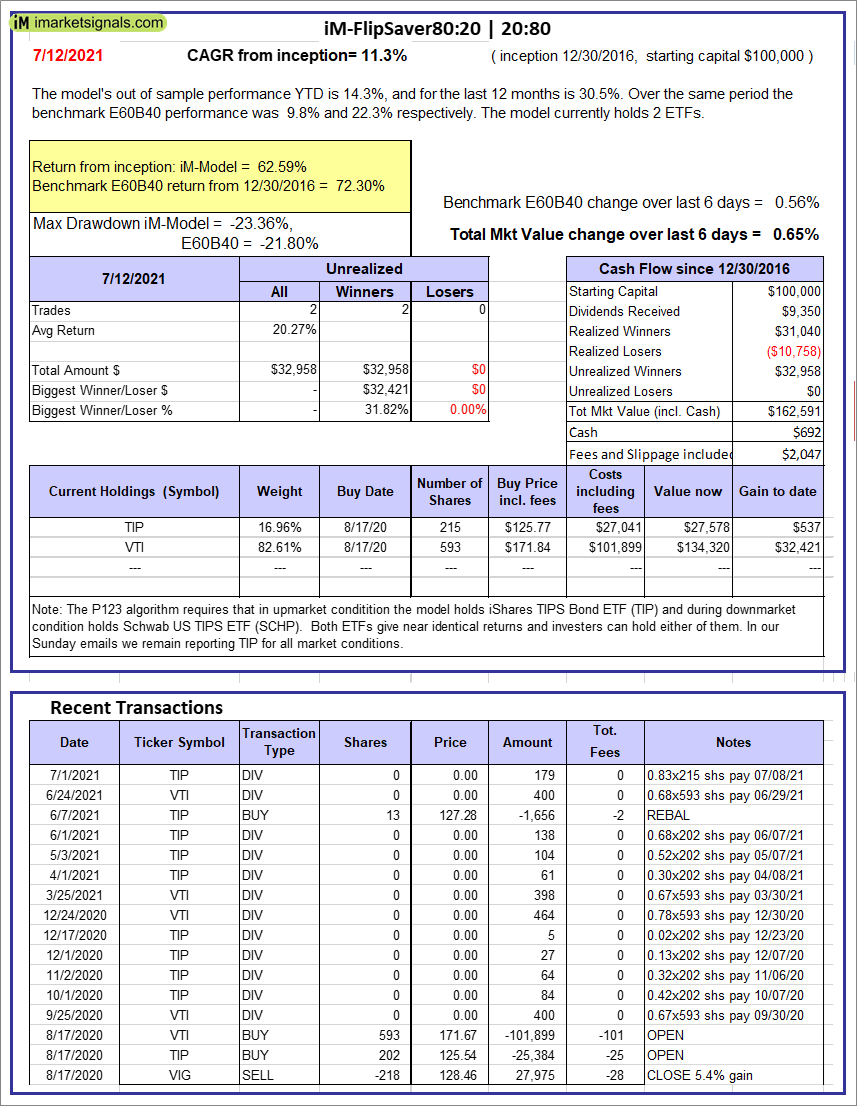 |
iM-FlipSaver 80:20 | 20:80 – 2017: The model’s out of sample performance YTD is 14.3%, and for the last 12 months is 30.5%. Over the same period the benchmark E60B40 performance was 9.8% and 22.3% respectively. Over the previous week the market value of iM-FlipSaver 80:20 | 20:80 gained 0.65% at a time when SPY gained 0.56%. A starting capital of $100,000 at inception on 1/2/2017 would have grown to $162,591 which includes $692 cash and excludes $2,047 spent on fees and slippage. |
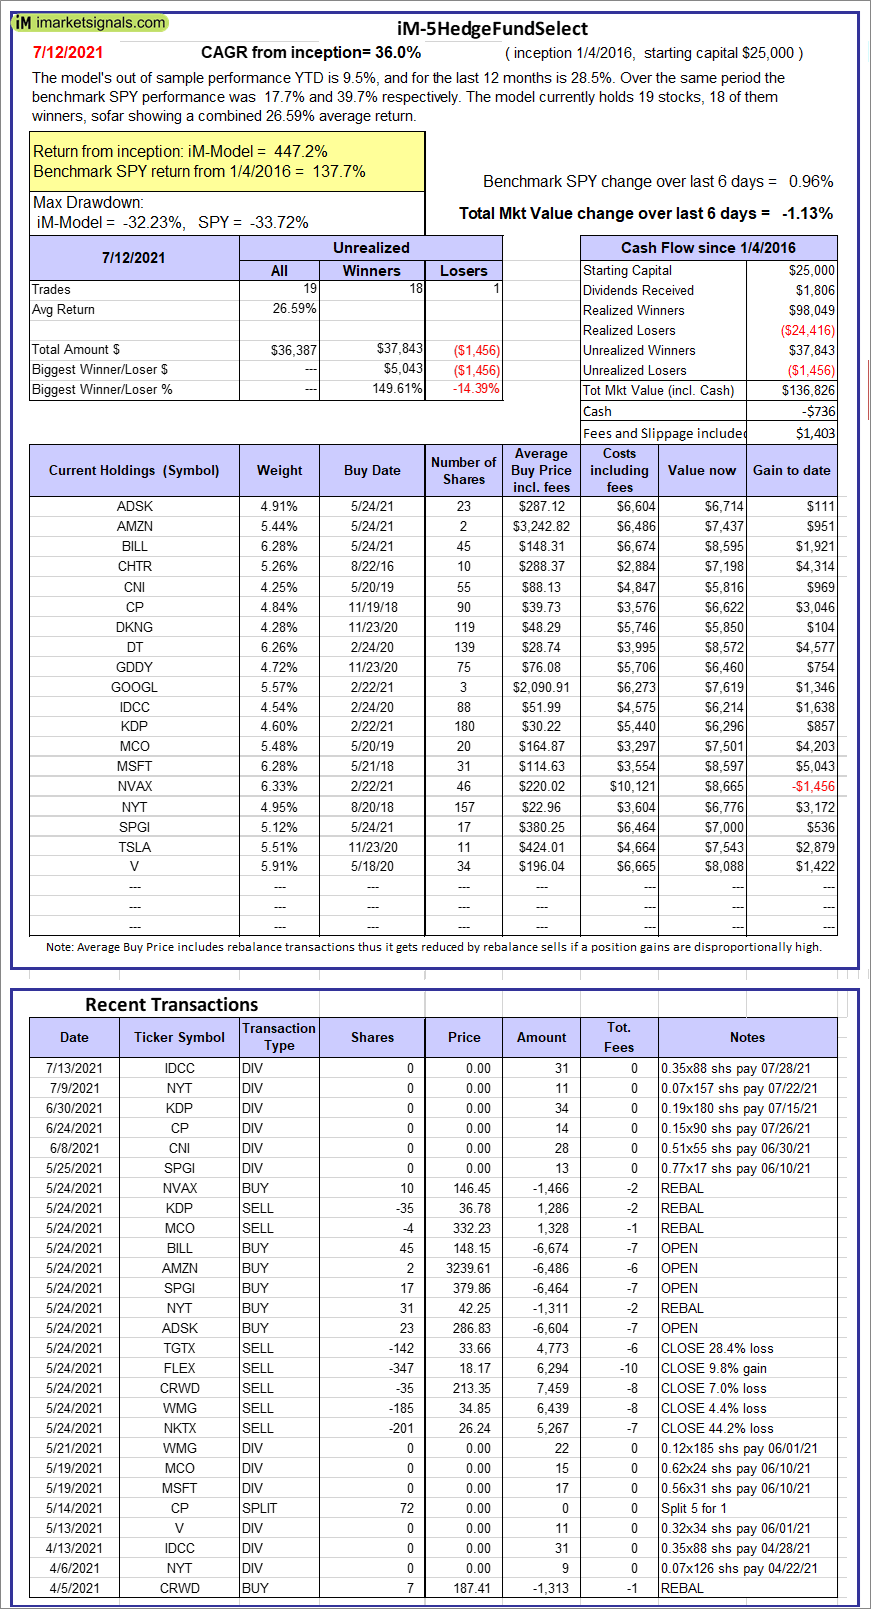 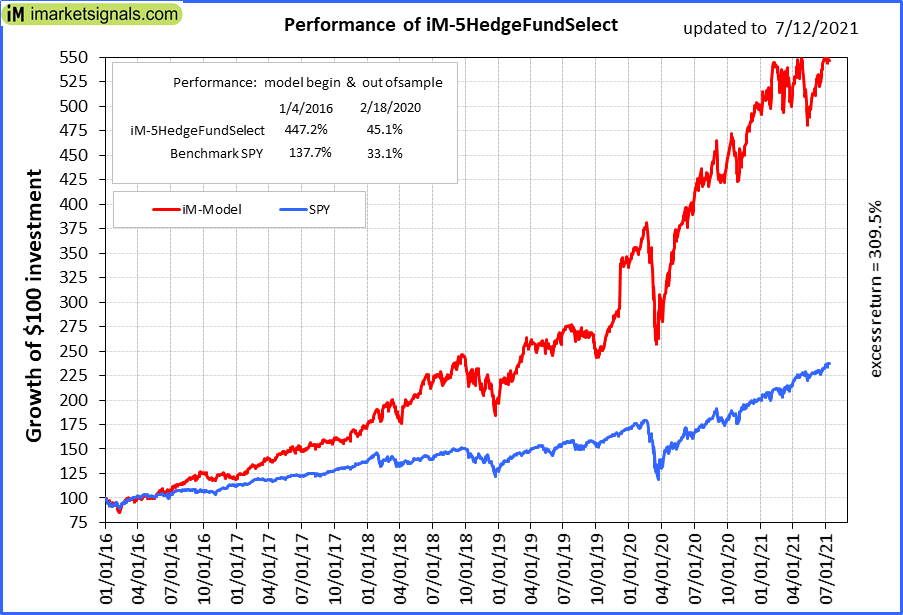 |
iM-5HedgeFundSelect: Since inception, on 1/5/2016, the model gained 447.18% while the benchmark SPY gained 137.68% over the same period. Over the previous week the market value of iM-5HedgeFundSelect gained -1.13% at a time when SPY gained 0.96%. A starting capital of $25,000 at inception on 1/5/2016 would have grown to $136,826 which includes -$736 cash and excludes $1,403 spent on fees and slippage. |
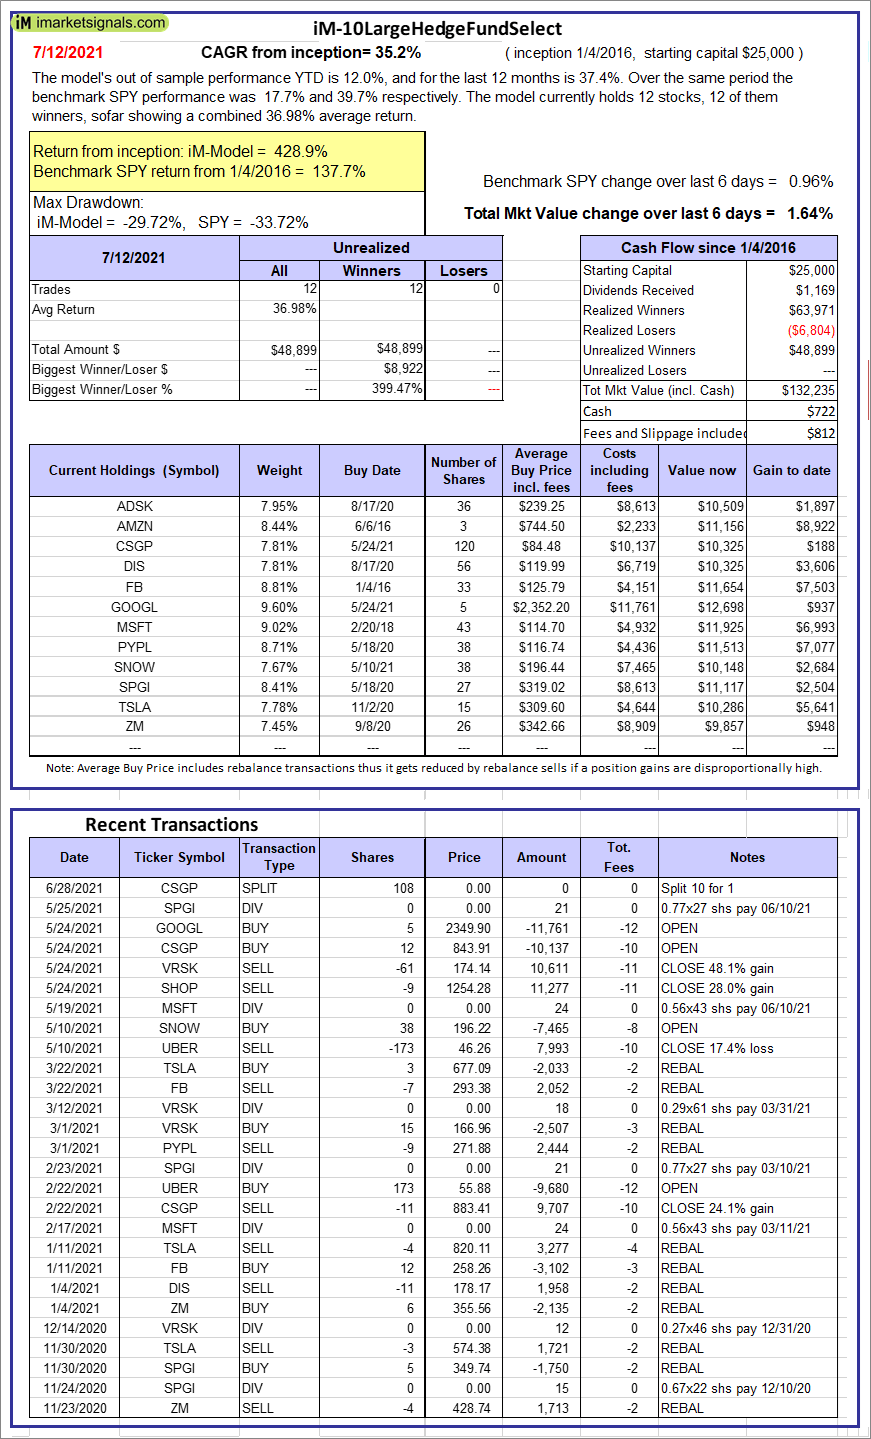 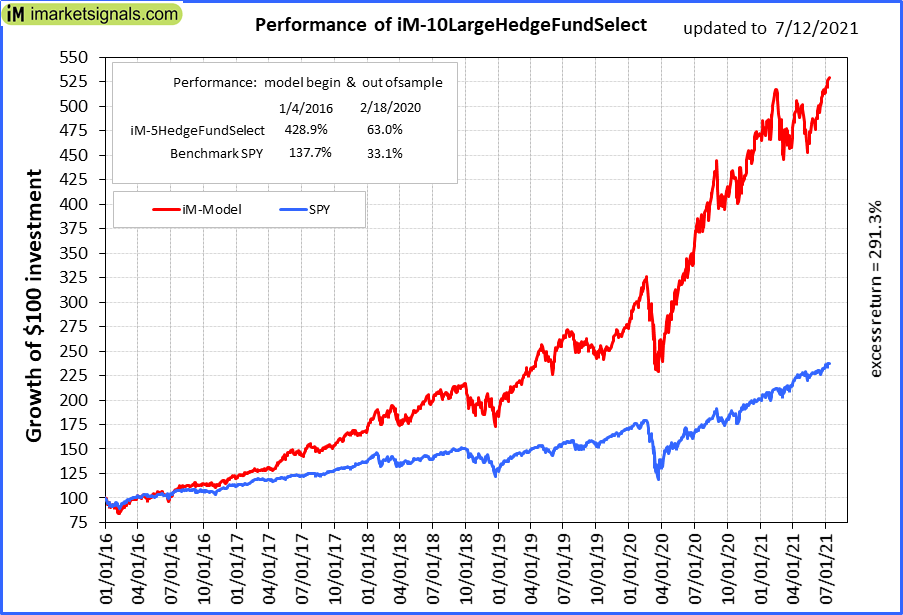 |
iM-10LargeHedgeFundSelect: Since inception, on 1/5/2016, the model gained 428.94% while the benchmark SPY gained 137.68% over the same period. Over the previous week the market value of iM-10LargeHedgeFundSelect gained 1.64% at a time when SPY gained 0.96%. A starting capital of $25,000 at inception on 1/5/2016 would have grown to $132,235 which includes $722 cash and excludes $812 spent on fees and slippage. |
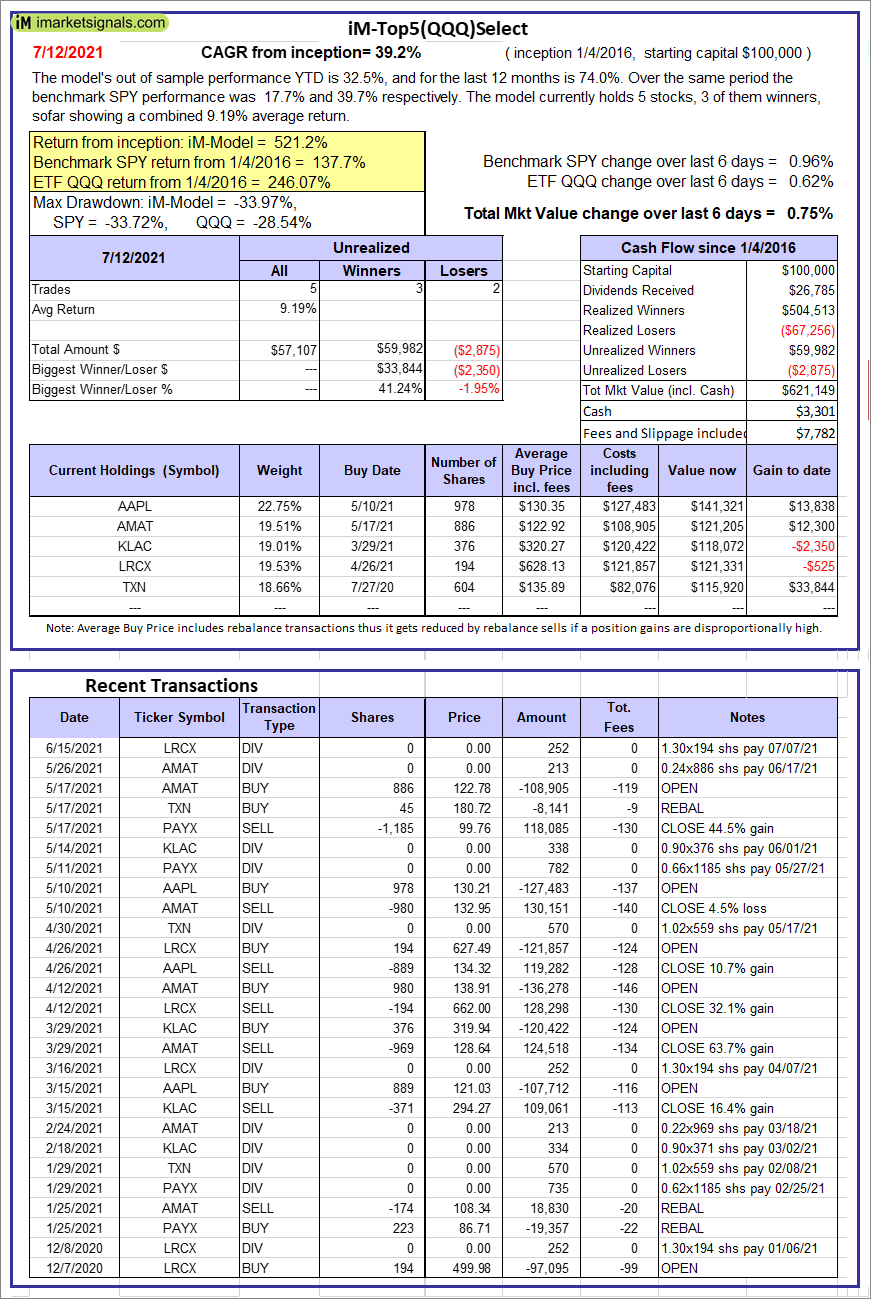  |
iM-Top5(QQQ)Select: Since inception, on 1/5/2016, the model gained 521.15% while the benchmark SPY gained 137.68% over the same period. Over the previous week the market value of iM-Top5(QQQ)Select gained 0.75% at a time when SPY gained 0.96%. A starting capital of $100,000 at inception on 1/5/2016 would have grown to $621,149 which includes $3,301 cash and excludes $7,782 spent on fees and slippage. |
  |
iM-Top5(XLB)Select: Since inception, on 1/5/2016, the model gained 127.62% while the benchmark SPY gained 137.68% over the same period. Over the previous week the market value of iM-Top5(XLB)Select gained 2.22% at a time when SPY gained 0.96%. A starting capital of $100,000 at inception on 1/5/2016 would have grown to $227,616 which includes $1,506 cash and excludes $6,303 spent on fees and slippage. |
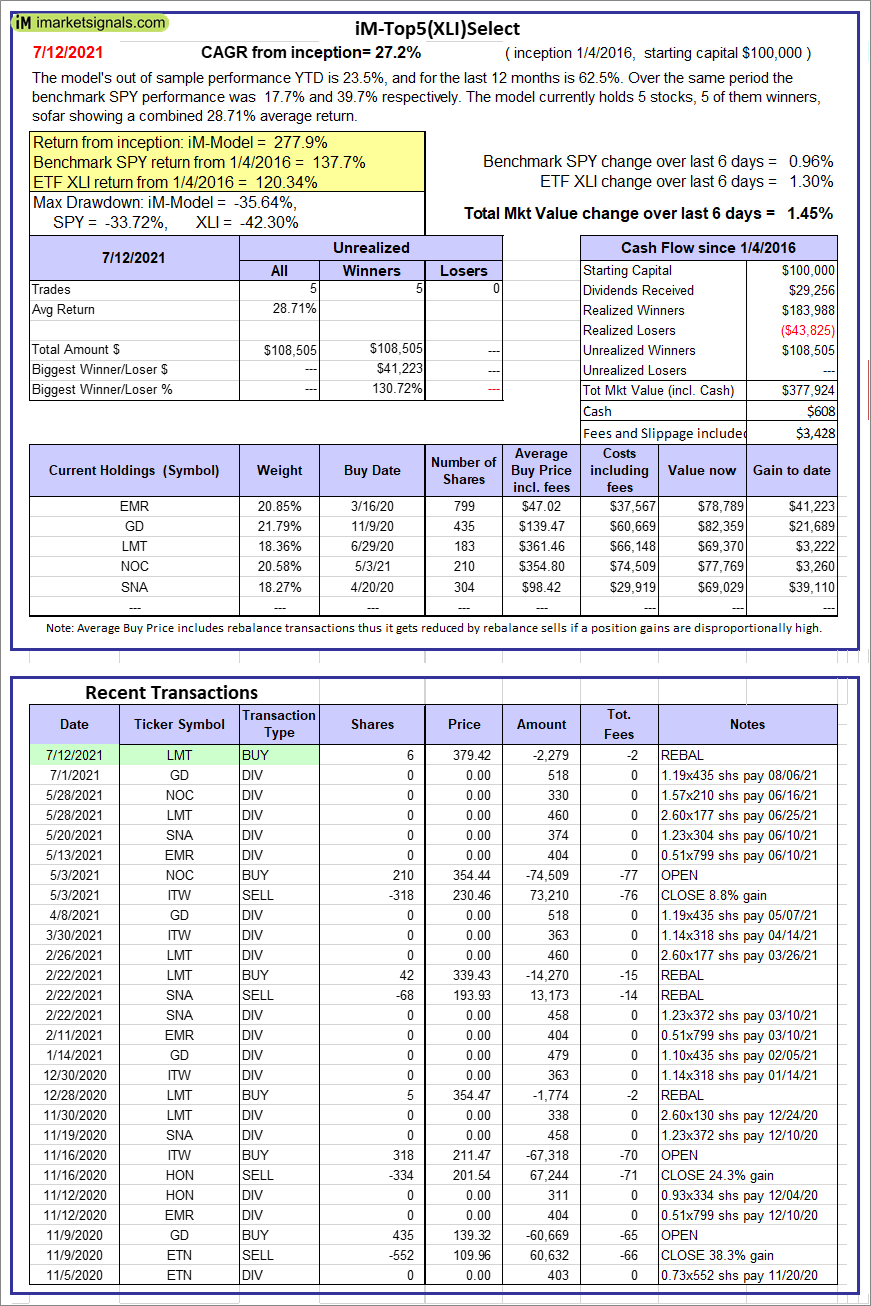 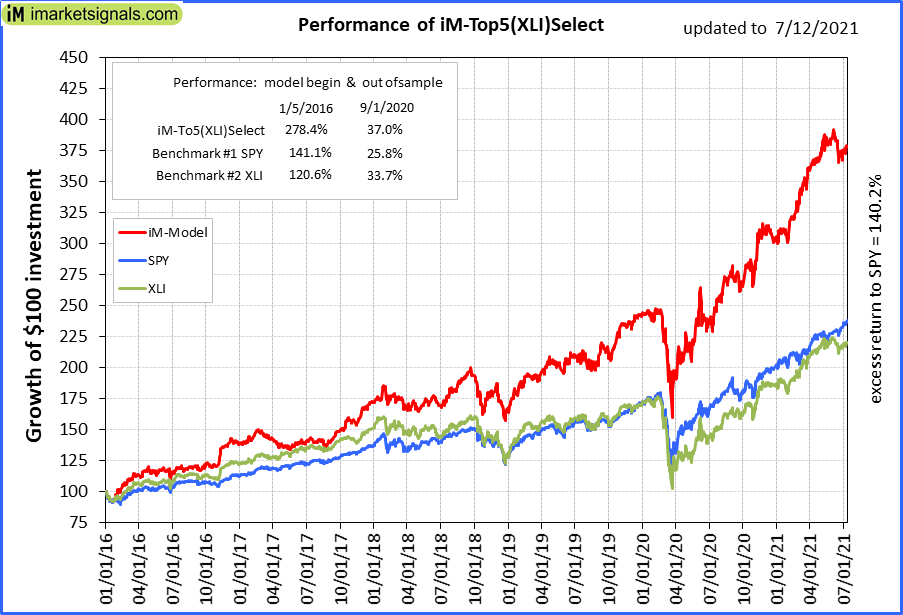 |
iM-Top5(XLI)Select: Since inception, on 1/5/2016, the model gained 277.92% while the benchmark SPY gained 137.68% over the same period. Over the previous week the market value of iM-Top5(XLI)Select gained 1.45% at a time when SPY gained 0.96%. A starting capital of $100,000 at inception on 1/5/2016 would have grown to $377,924 which includes $608 cash and excludes $3,428 spent on fees and slippage. |
 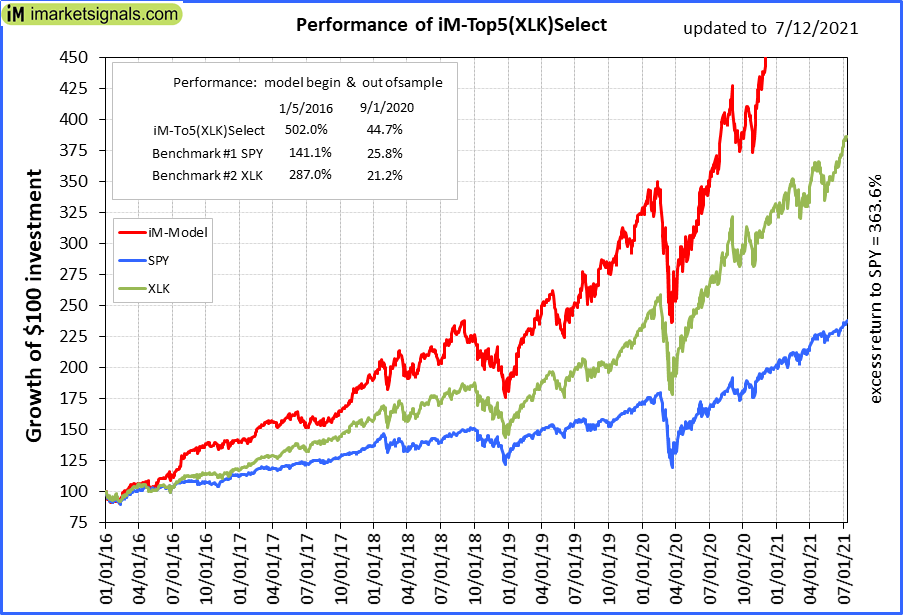 |
iM-Top5(XLK)Select: Since inception, on 1/5/2016, the model gained 501.26% while the benchmark SPY gained 137.68% over the same period. Over the previous week the market value of iM-Top5(XLK)Select gained -0.05% at a time when SPY gained 0.96%. A starting capital of $100,000 at inception on 1/5/2016 would have grown to $601,265 which includes $2,535 cash and excludes $1,607 spent on fees and slippage. |
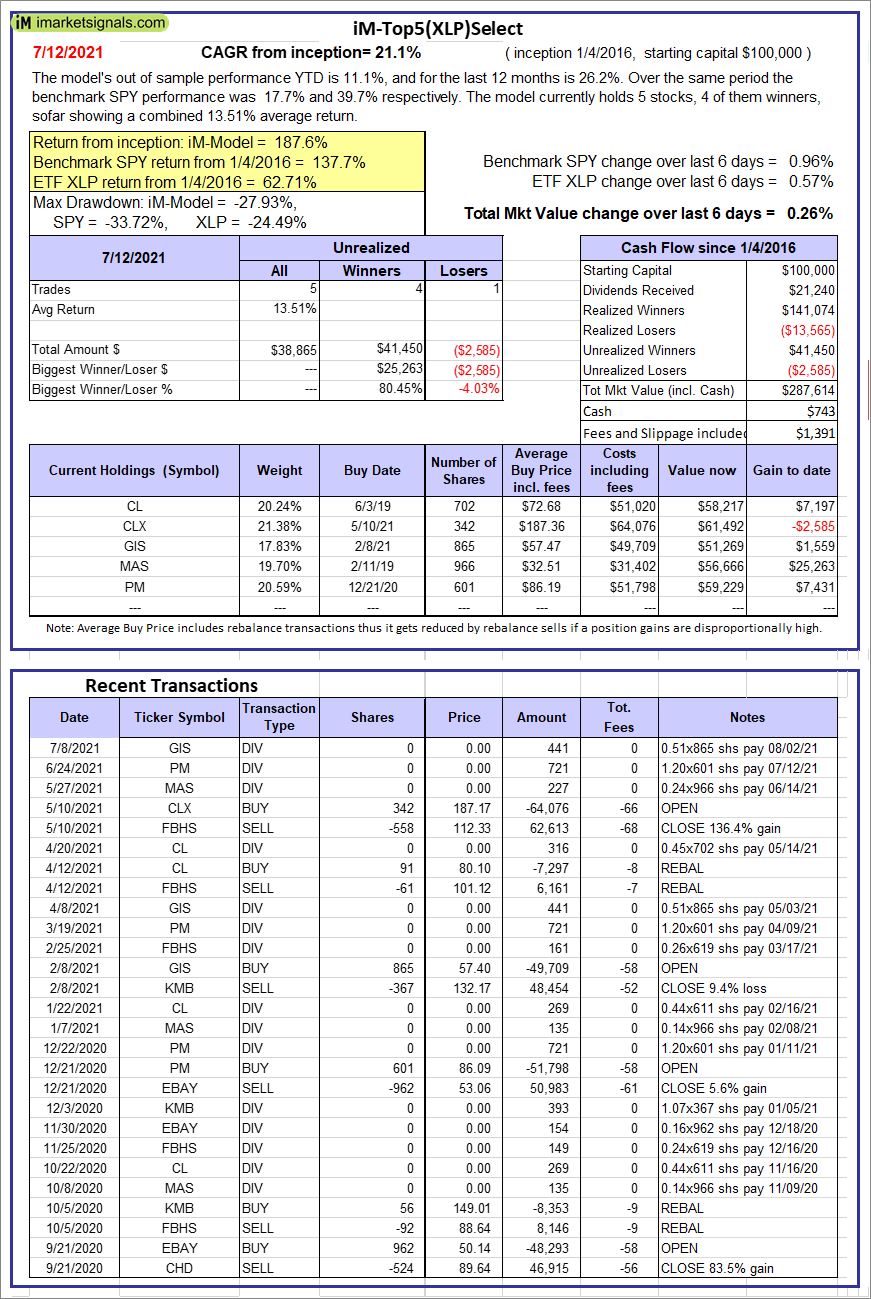  |
iM-Top5(XLP)Select: Since inception, on 1/5/2016, the model gained 187.61% while the benchmark SPY gained 137.68% over the same period. Over the previous week the market value of iM-Top5(XLP)Select gained 0.26% at a time when SPY gained 0.96%. A starting capital of $100,000 at inception on 1/5/2016 would have grown to $287,614 which includes $743 cash and excludes $1,391 spent on fees and slippage. |
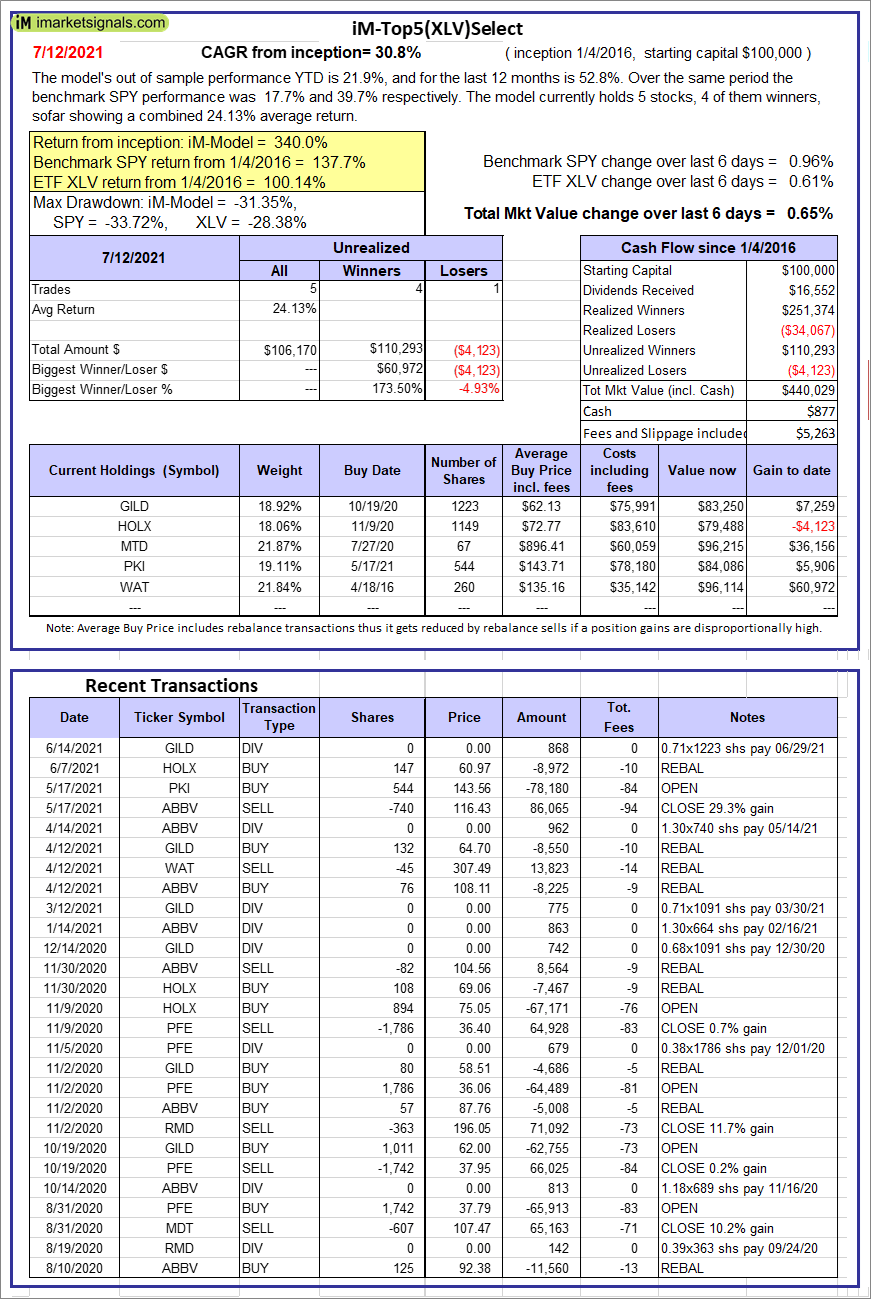 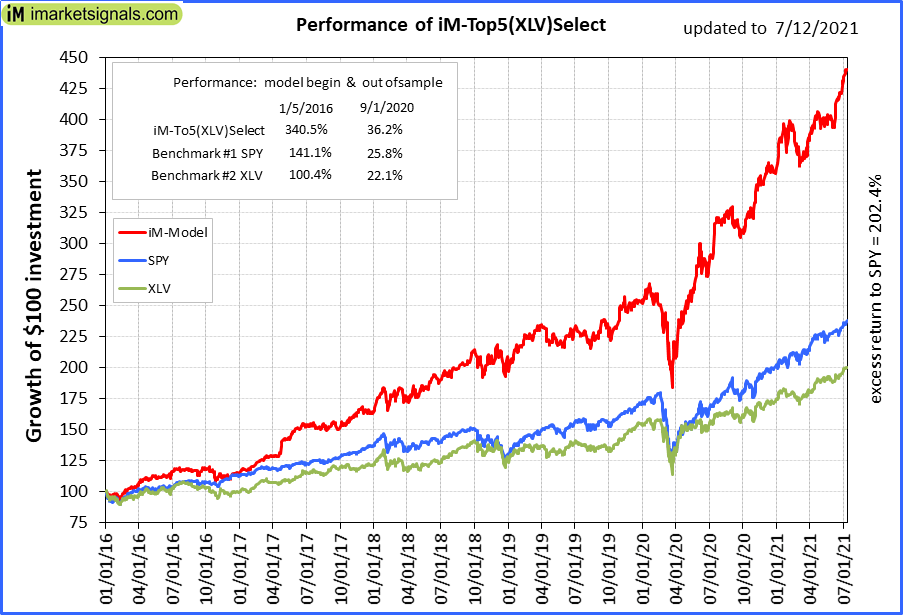 |
iM-Top5(XLV)Select: Since inception, on 1/5/2016, the model gained 340.03% while the benchmark SPY gained 137.68% over the same period. Over the previous week the market value of iM-Top5(XLV)Select gained 0.65% at a time when SPY gained 0.96%. A starting capital of $100,000 at inception on 1/5/2016 would have grown to $440,029 which includes $877 cash and excludes $5,263 spent on fees and slippage. |
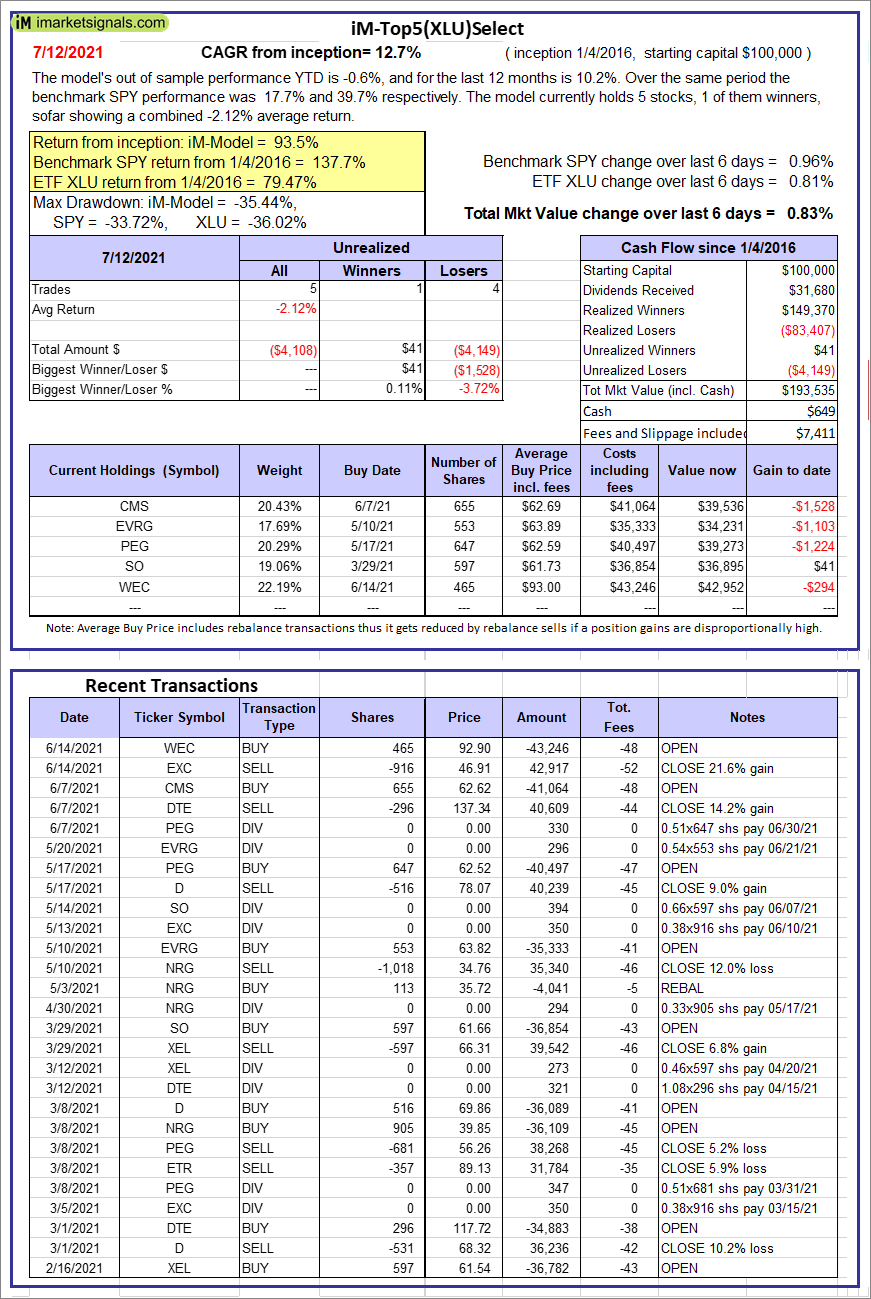 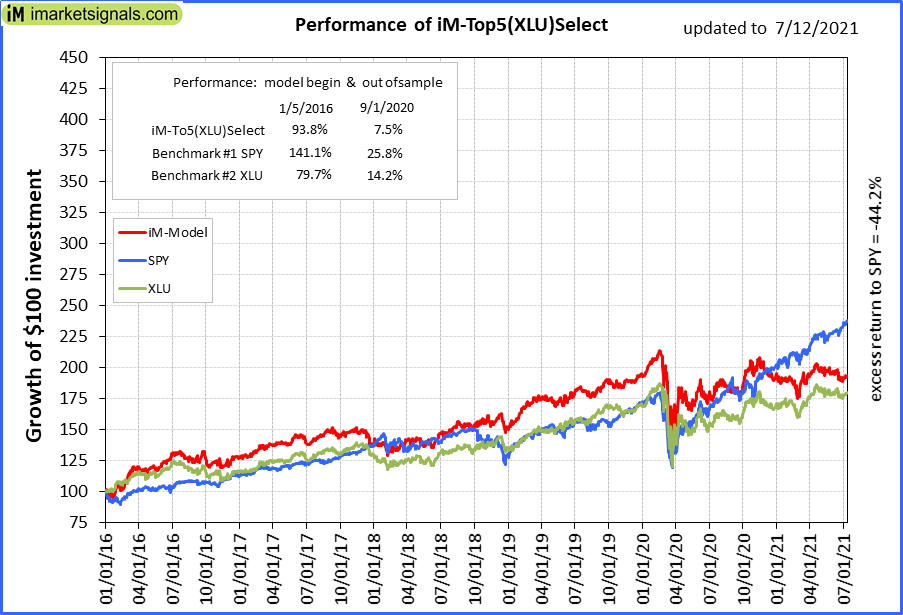 |
iM-Top5(XLU)Select: Since inception, on 1/5/2016, the model gained 93.53% while the benchmark SPY gained 137.68% over the same period. Over the previous week the market value of iM-Top5(XLU)Select gained 0.83% at a time when SPY gained 0.96%. A starting capital of $100,000 at inception on 1/5/2016 would have grown to $193,535 which includes $649 cash and excludes $7,411 spent on fees and slippage. |
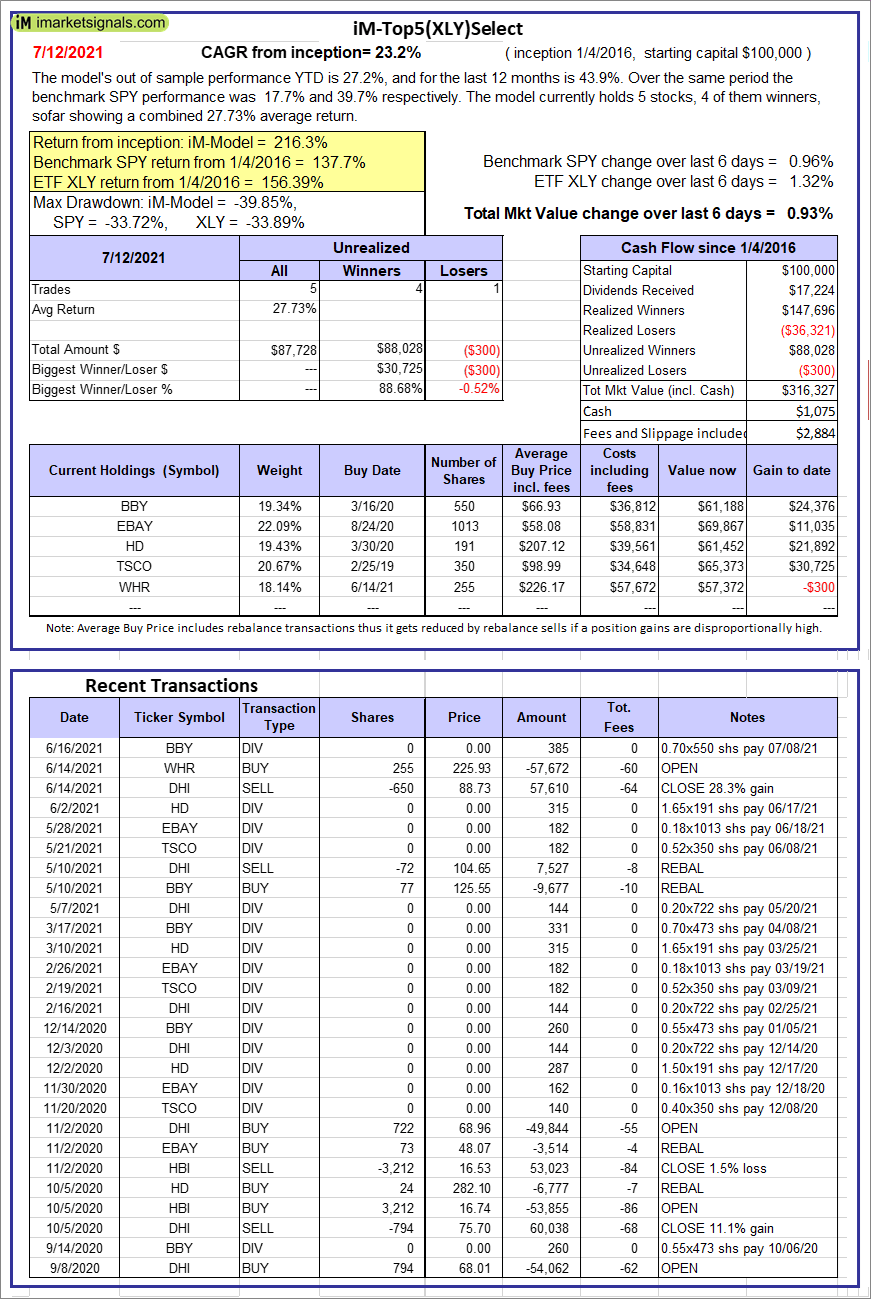 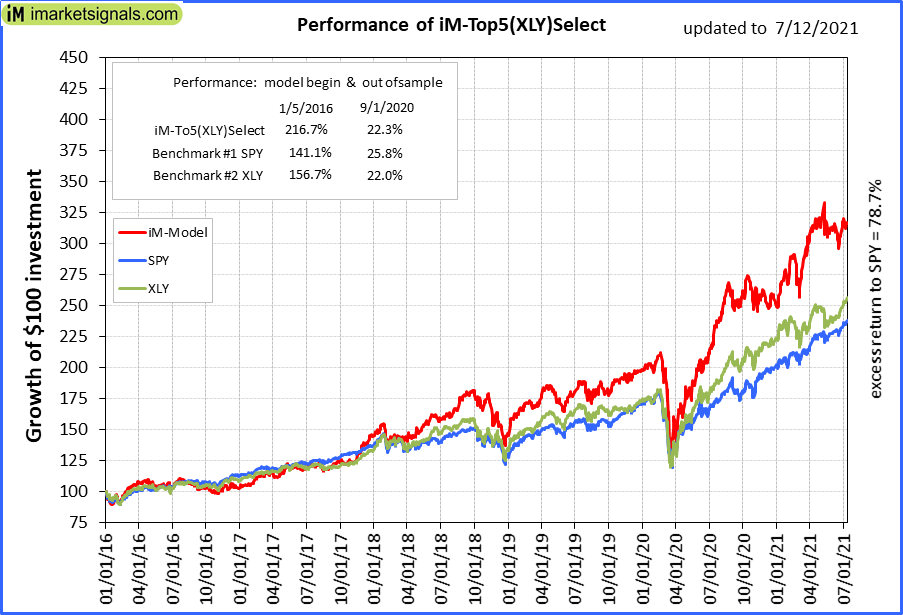 |
iM-Top5(XLY)Select: Since inception, on 1/5/2016, the model gained 216.33% while the benchmark SPY gained 137.68% over the same period. Over the previous week the market value of iM-Top5(XLY)Select gained 0.93% at a time when SPY gained 0.96%. A starting capital of $100,000 at inception on 1/5/2016 would have grown to $316,327 which includes $1,075 cash and excludes $2,884 spent on fees and slippage. |
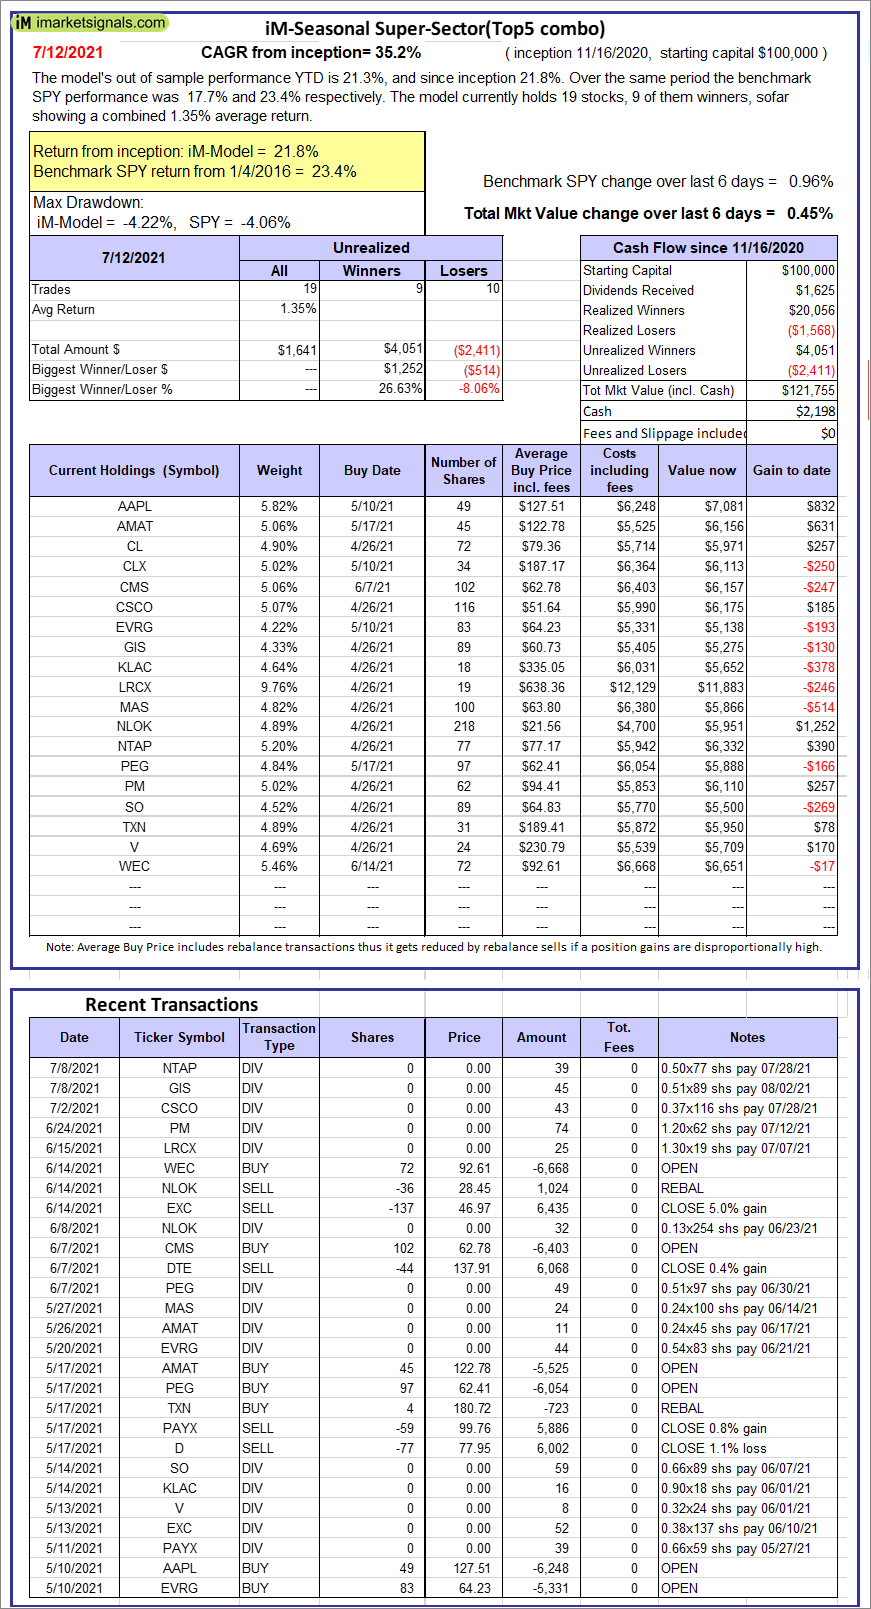 |
iM-Seasonal Super-Sectors (Top5 combo) : Since inception, on 11/17/2020, the model gained 21.75% while the benchmark SPY gained 23.38% over the same period. Over the previous week the market value of iM-Seasonal Super-Sectors (Top5 combo) gained 0.45% at a time when SPY gained 0.96%. A starting capital of $100,000 at inception on 11/17/2020 would have grown to $121,755 which includes $2,198 cash and excludes $00 spent on fees and slippage. |
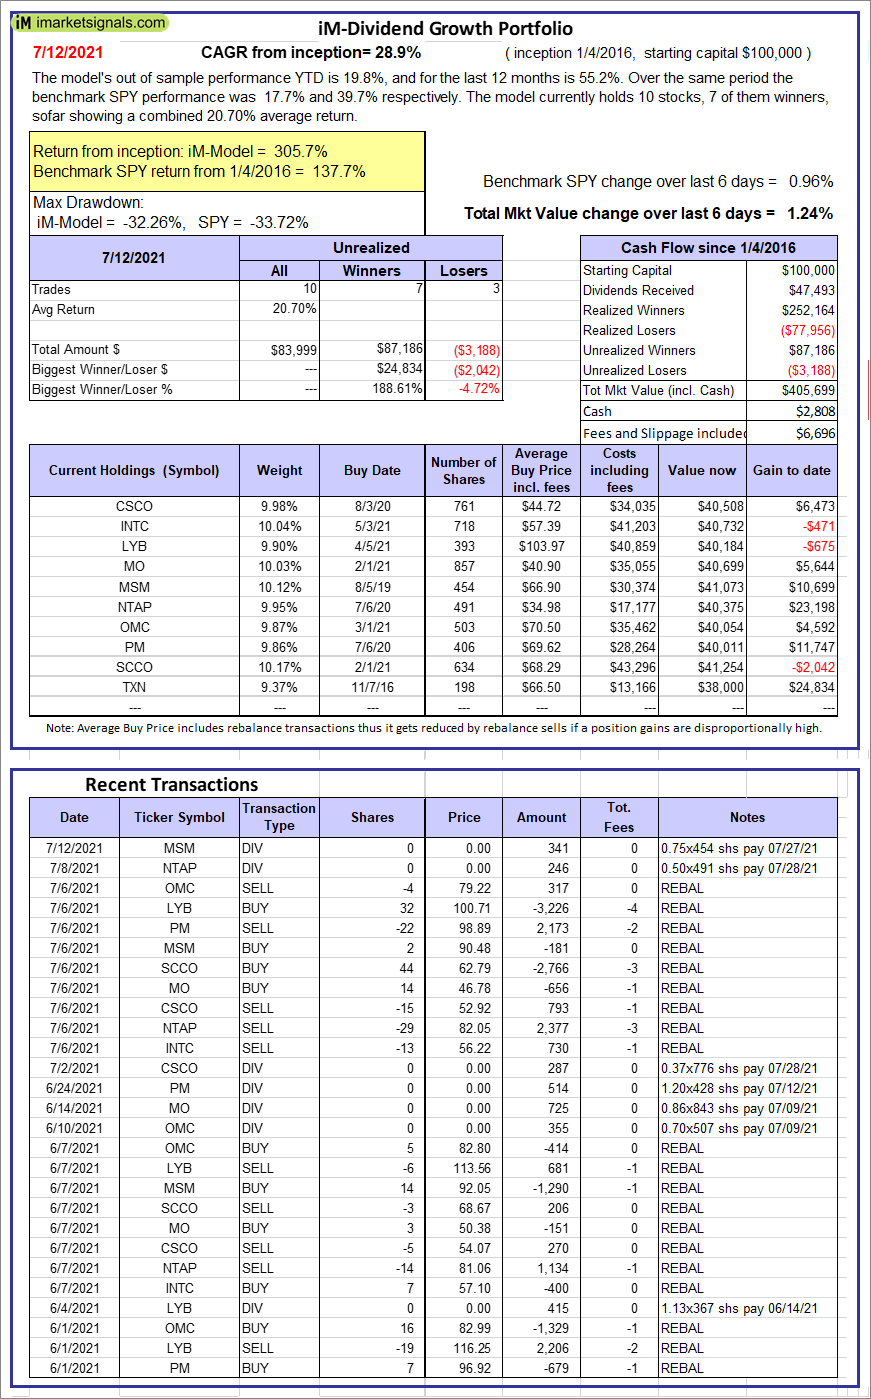 |
iM-Dividend Growth Portfolio: The model’s out of sample performance YTD is 19.8%, and for the last 12 months is 55.2%. Over the same period the benchmark SPY performance was 17.7% and 39.7% respectively. Over the previous week the market value of the iM-Dividend Growth Portfolio gained 1.24% at a time when SPY gained 0.96%. A starting capital of $100,000 at inception on 6/30/2016 would have grown to $405,699 which includes $2,808 cash and excludes $6,696 spent on fees and slippage. |
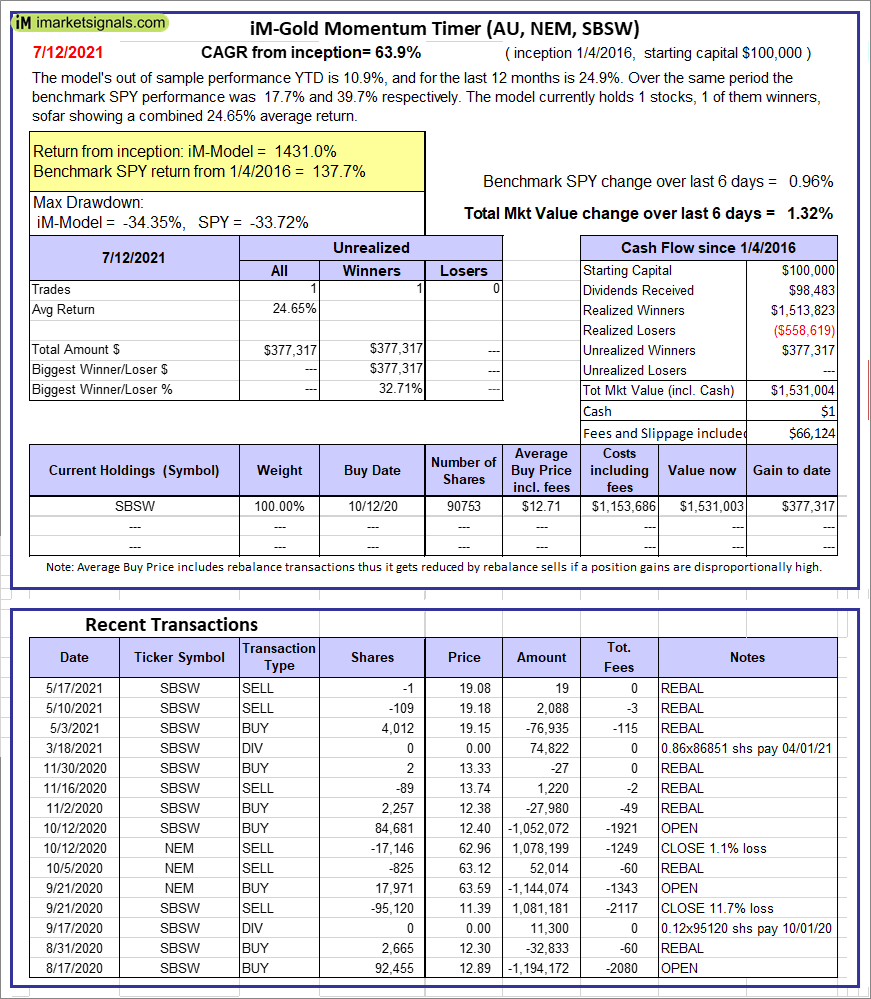 |
iM-Gold Momentum Timer (AU, NEM, SBSW): The model’s out of sample performance YTD is 10.9%, and for the last 12 months is 24.9%. Over the same period the benchmark SPY performance was 17.7% and 39.7% respectively. Over the previous week the market value of iM-Gold Momentum Timer (AU, NEM, SBSW) gained 1.32% at a time when SPY gained 0.96%. A starting capital of $100,000 at inception on 6/30/2016 would have grown to $01 which includes $66,124 cash and excludes Gain to date spent on fees and slippage. |
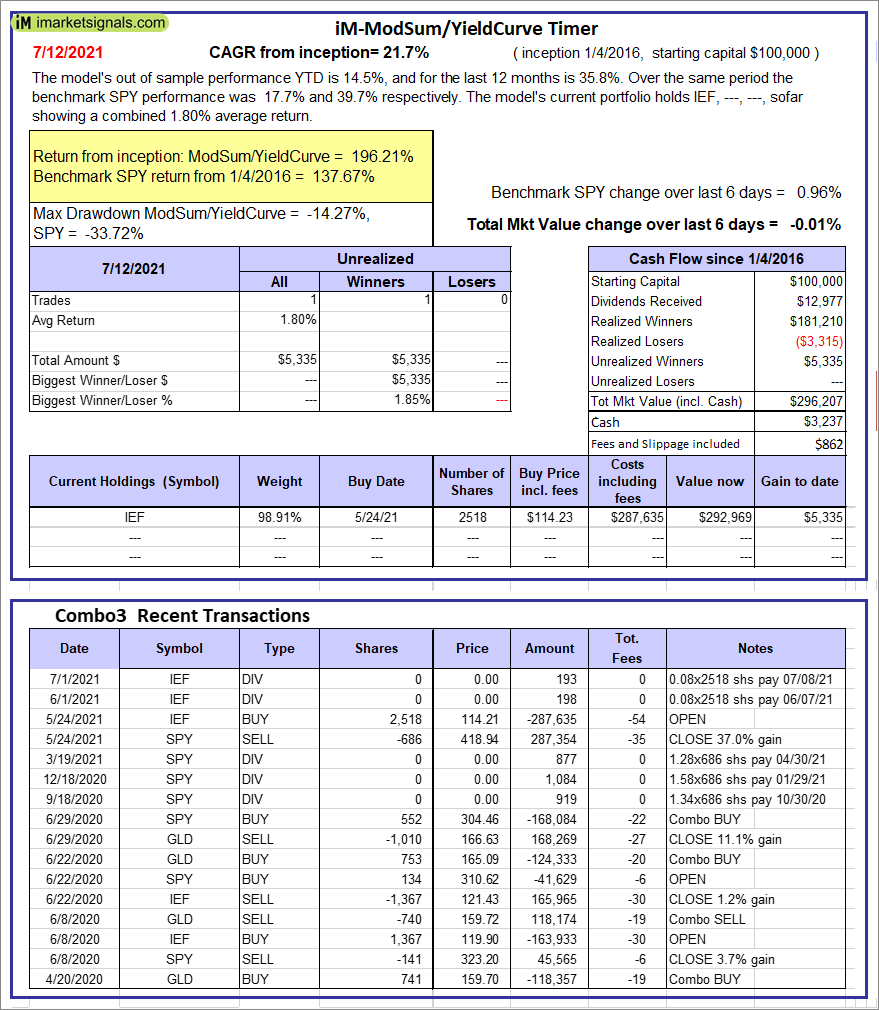 |
iM-ModSum/YieldCurve Timer: The model’s out of sample performance YTD is 14.5%, and for the last 12 months is 35.8%. Over the same period the benchmark SPY performance was 17.7% and 39.7% respectively. Over the previous week the market value of iM-PortSum/YieldCurve Timer gained -0.01% at a time when SPY gained 0.96%. A starting capital of $100,000 at inception on 1/1/2016 would have grown to $296,207 which includes $3,237 cash and excludes $862 spent on fees and slippage. |
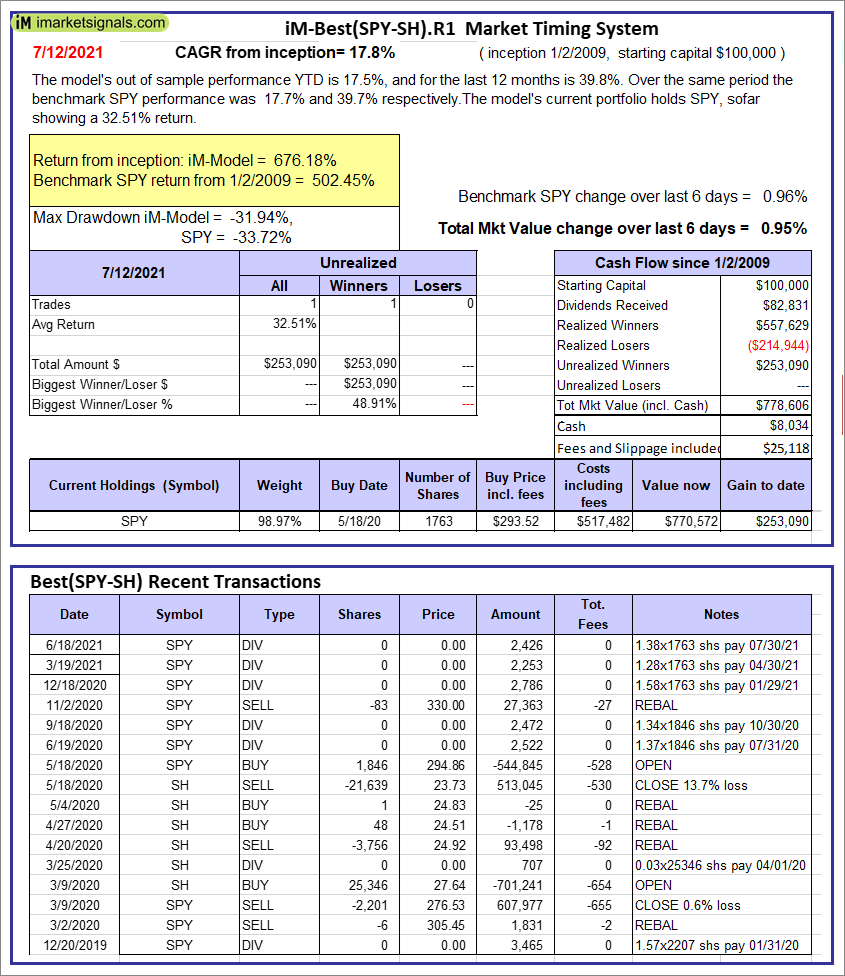 |
iM-Best(SPY-SH).R1: The model’s out of sample performance YTD is 17.5%, and for the last 12 months is 39.8%. Over the same period the benchmark SPY performance was 17.7% and 39.7% respectively. Over the previous week the market value of Best(SPY-SH) gained 0.95% at a time when SPY gained 0.96%. A starting capital of $100,000 at inception on 1/2/2009 would have grown to $778,606 which includes $8,034 cash and excludes $25,118 spent on fees and slippage. |
 |
iM-Combo3.R1: The model’s out of sample performance YTD is 11.3%, and for the last 12 months is 30.5%. Over the same period the benchmark SPY performance was 17.7% and 39.7% respectively. Over the previous week the market value of iM-Combo3.R1 gained 0.50% at a time when SPY gained 0.96%. A starting capital of $100,000 at inception on 2/3/2014 would have grown to $191,129 which includes $5,316 cash and excludes $7,036 spent on fees and slippage. |
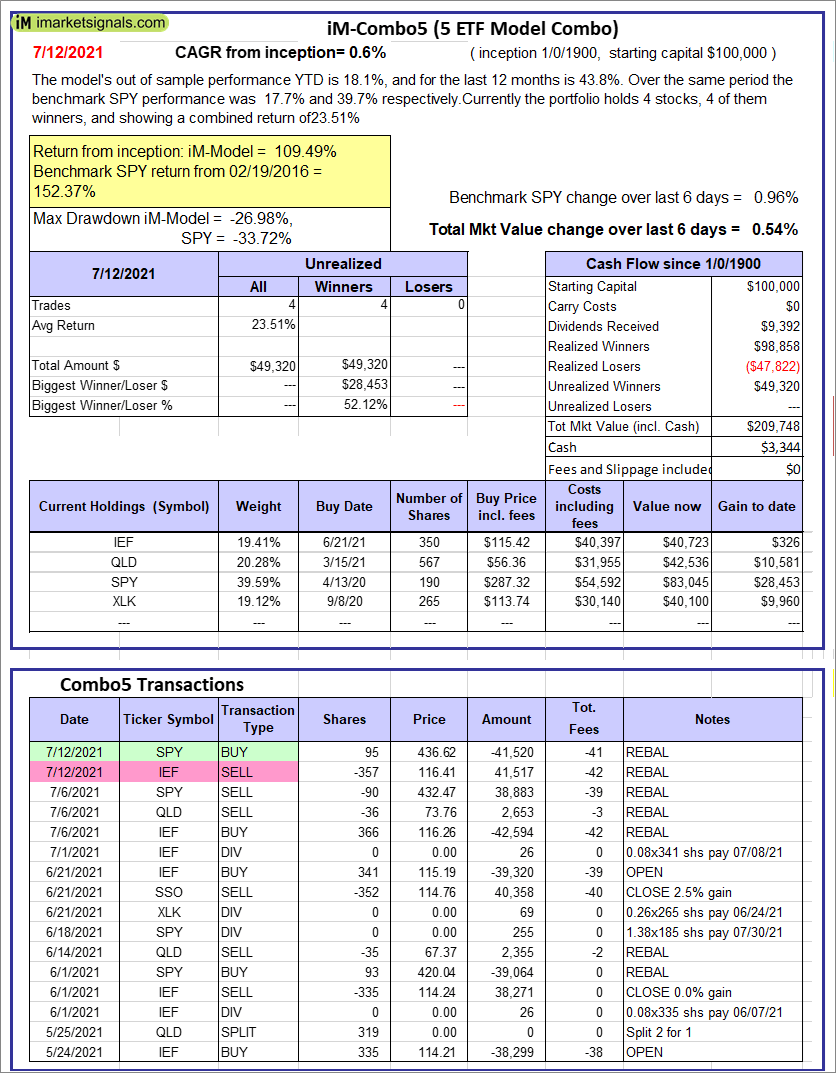 |
iM-Combo5: The model’s out of sample performance YTD is 18.1%, and for the last 12 months is 43.8%. Over the same period the benchmark SPY performance was 17.7% and 39.7% respectively. Over the previous week the market value of iM-Combo5 gained 0.54% at a time when SPY gained 0.96%. A starting capital of $100,000 at inception on 2/22/2016 would have grown to $209,748 which includes $3,344 cash and excludes $0 spent on fees and slippage. |
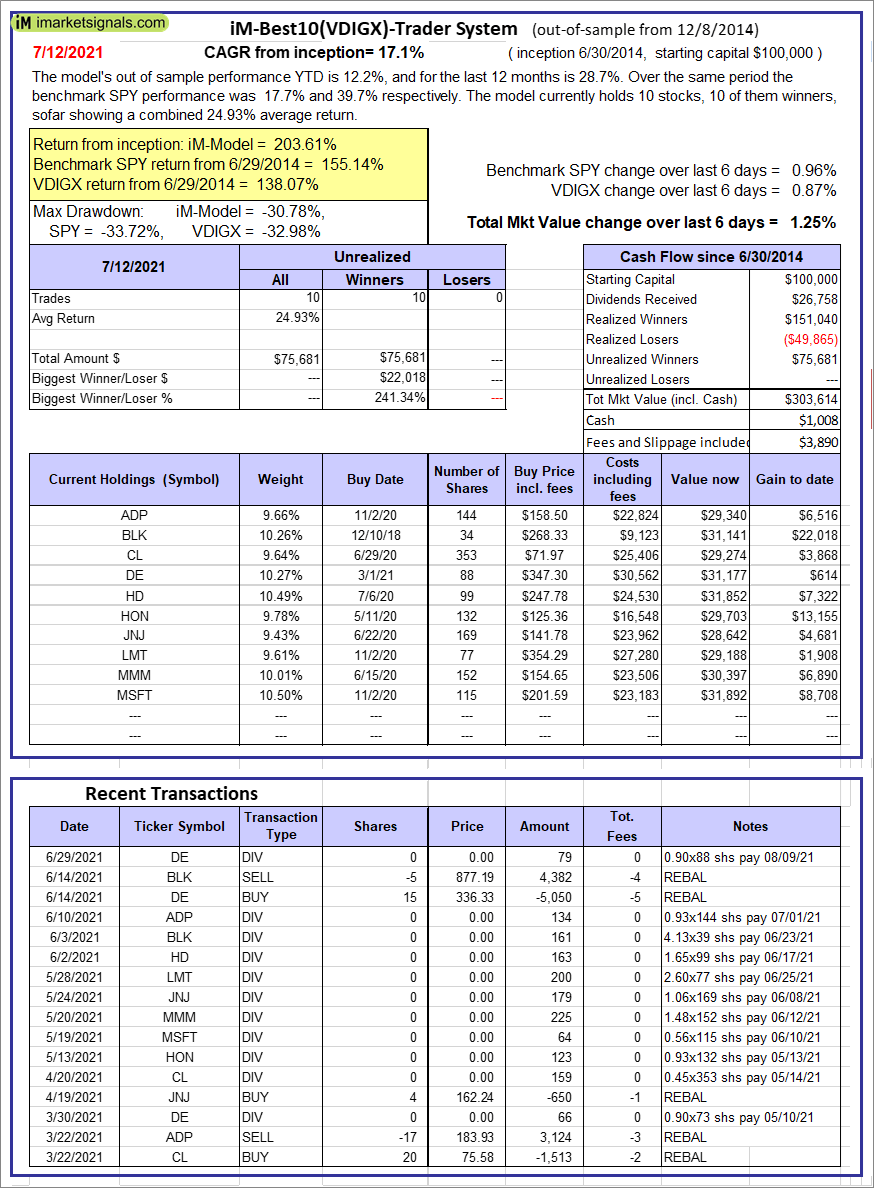 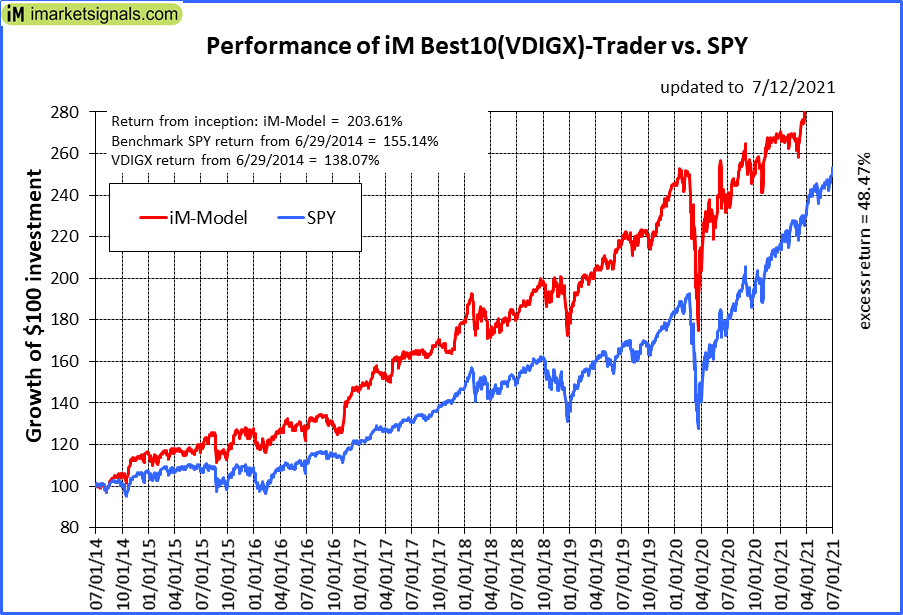 |
iM-Best10(VDIGX)-Trader: The model’s out of sample performance YTD is 12.2%, and for the last 12 months is 28.7%. Over the same period the benchmark SPY performance was 17.7% and 39.7% respectively. Since inception, on 7/1/2014, the model gained 203.61% while the benchmark SPY gained 155.14% and VDIGX gained 138.07% over the same period. Over the previous week the market value of iM-Best10(VDIGX) gained 1.25% at a time when SPY gained 0.96%. A starting capital of $100,000 at inception on 7/1/2014 would have grown to $303,614 which includes $1,008 cash and excludes $3,890 spent on fees and slippage. |
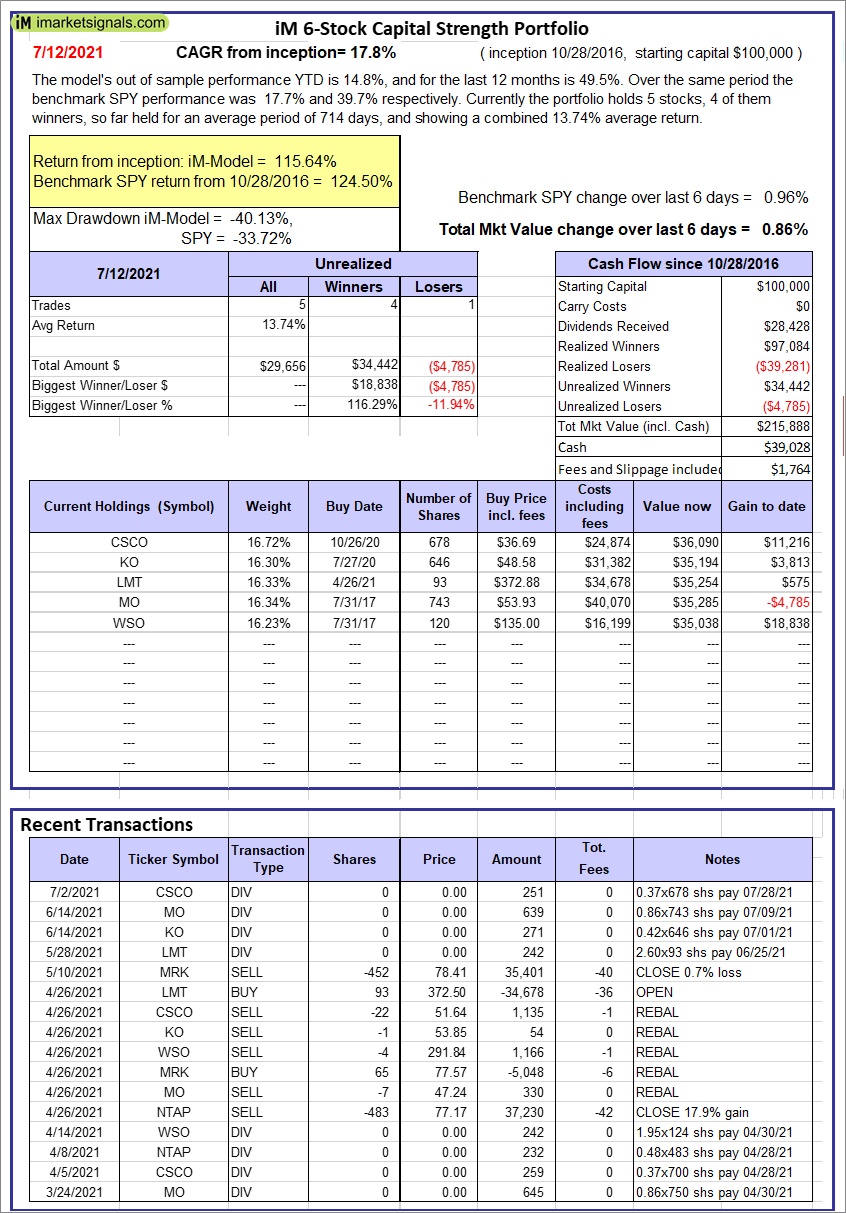 |
iM 6-Stock Capital Strength Portfolio: The model’s out of sample performance YTD is 14.8%, and for the last 12 months is 49.5%. Over the same period the benchmark SPY performance was 17.7% and 39.7% respectively. Over the previous week the market value of the iM 6-Stock Capital Strength Portfolio gained 0.86% at a time when SPY gained 0.96%. A starting capital of $100,000 at inception on 10/28/2016 would have grown to $215,888 which includes $39,028 cash and excludes $1,764 spent on fees and slippage. |
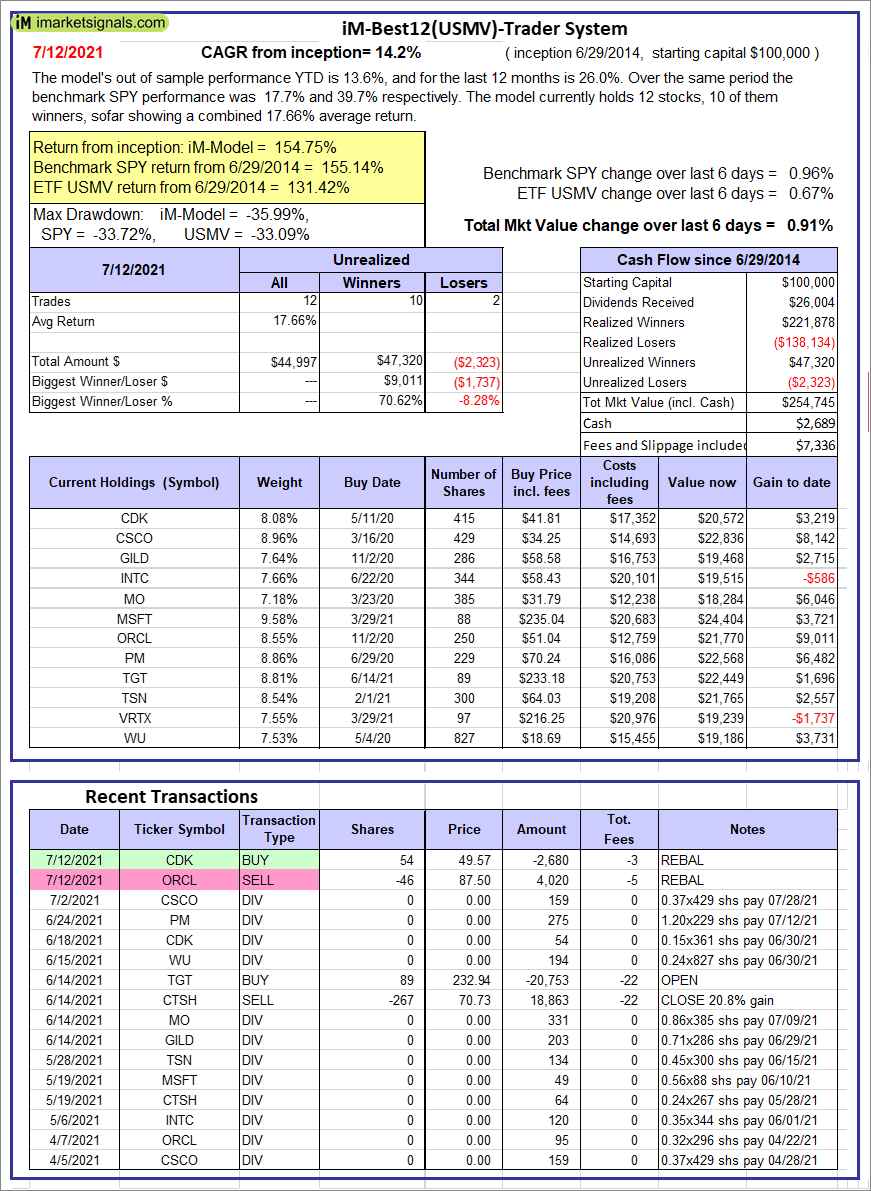 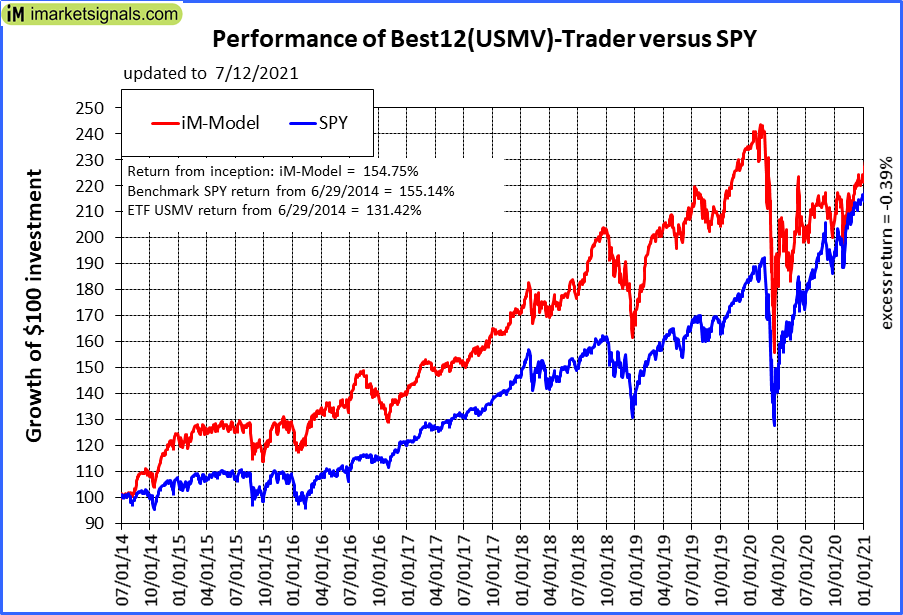 |
iM-Best12(USMV)-Trader: The model’s out of sample performance YTD is 13.6%, and for the last 12 months is 26.0%. Over the same period the benchmark SPY performance was 17.7% and 39.7% respectively. Since inception, on 6/30/2014, the model gained 154.75% while the benchmark SPY gained 155.14% and the ETF USMV gained 131.42% over the same period. Over the previous week the market value of iM-Best12(USMV)-Trader gained 0.91% at a time when SPY gained 0.96%. A starting capital of $100,000 at inception on 6/30/2014 would have grown to $254,745 which includes $2,689 cash and excludes $7,336 spent on fees and slippage. |
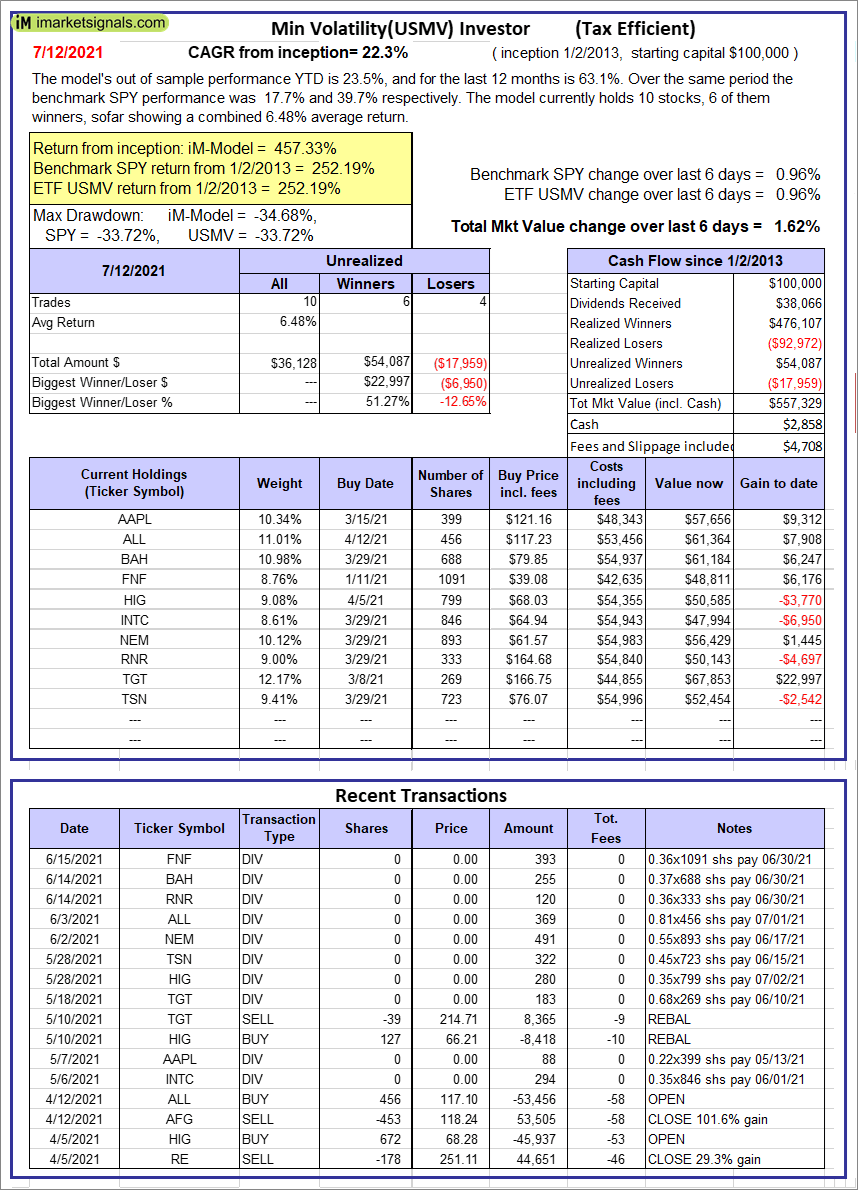 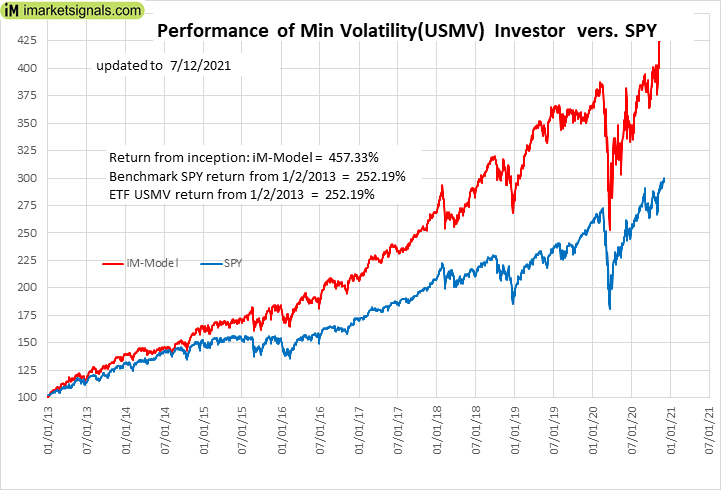 |
iM-Min Volatility(USMV) Investor (Tax Efficient): The model’s out of sample performance YTD is 23.5%, and for the last 12 months is 63.1%. Over the same period the benchmark SPY performance was 17.7% and 39.7% respectively. Since inception, on 1/3/2013, the model gained 457.33% while the benchmark SPY gained 252.19% and the ETF USMV gained 252.19% over the same period. Over the previous week the market value of iM-Best12(USMV)Q1 gained 1.62% at a time when SPY gained 0.96%. A starting capital of $100,000 at inception on 1/3/2013 would have grown to $557,329 which includes $2,858 cash and excludes $4,708 spent on fees and slippage. |
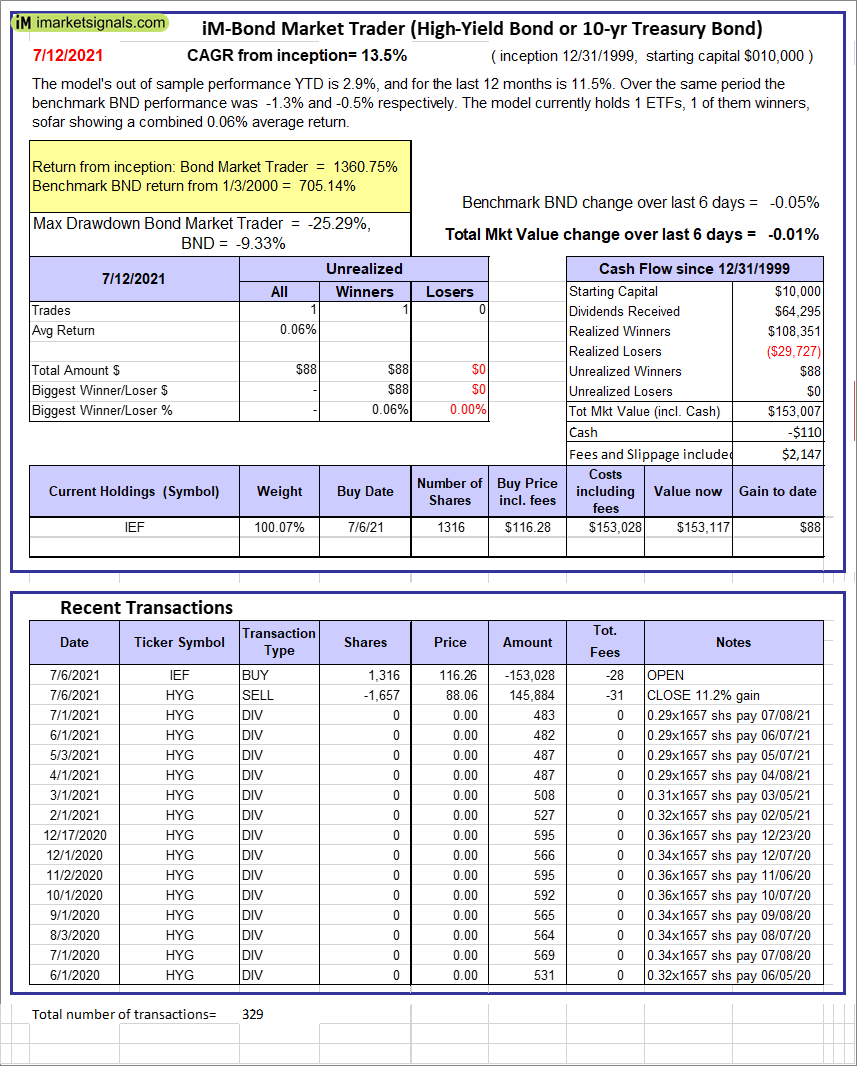 |
iM-Bond Market Trader (High-Yield Bond or 10-yr Treasury Bond): The model’s out of sample performance YTD is 2.9%, and for the last 12 months is 11.5%. Over the same period the benchmark BND performance was -1.3% and -0.5% respectively. Over the previous week the market value of the iM-Bond Market Trader (High-Yield Bond or 10-yr Treasury Bond) gained -0.01% at a time when BND gained -0.05%. A starting capital of $10,000 at inception on 1/3/2000 would have grown to $153,007 which includes -$110 cash and excludes $2,147 spent on fees and slippage. |
|
|
iM-ModSum/YieldCurve Timer: The model’s out of sample performance YTD is 14.5%, and for the last 12 months is 35.8%. Over the same period the benchmark SPY performance was 17.7% and 39.7% respectively. Over the previous week the market value of iM-PortSum/YieldCurve Timer gained -0.01% at a time when SPY gained 0.96%. A starting capital of $100,000 at inception on 1/1/2016 would have grown to $296,207 which includes $3,237 cash and excludes $862 spent on fees and slippage. |
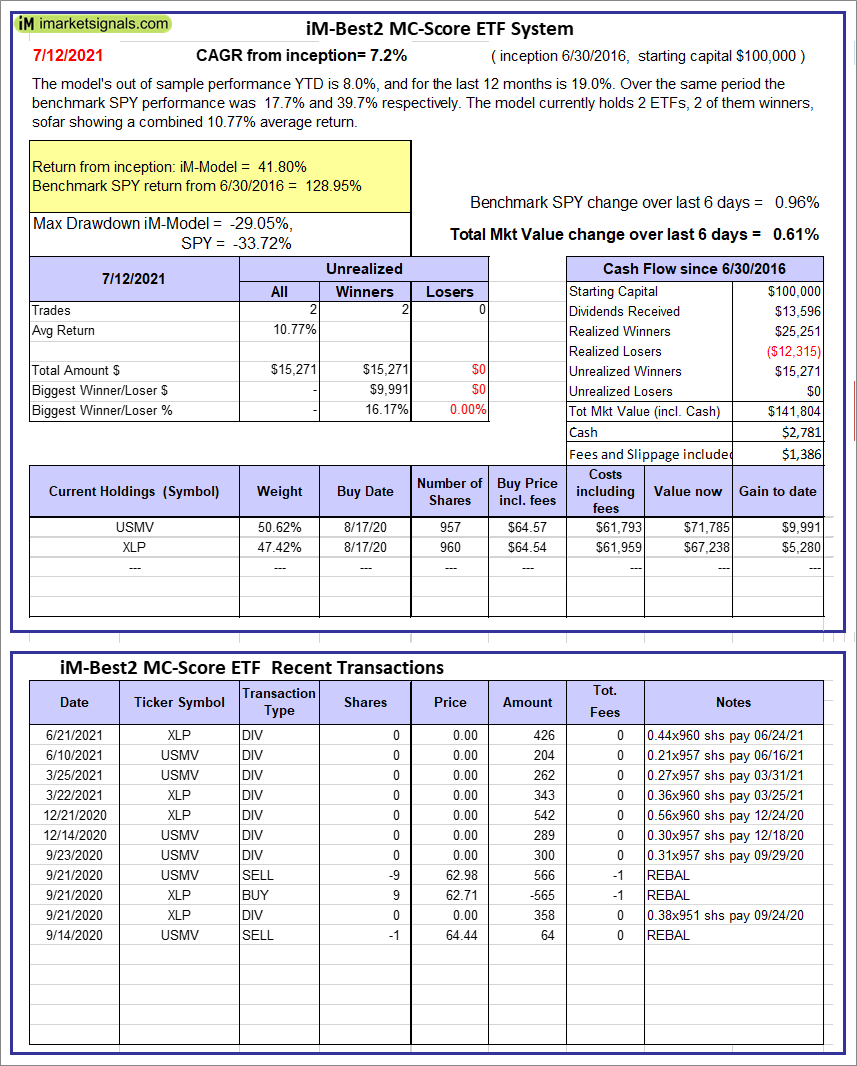 |
iM-Best2 MC-Score ETF System: The model’s out of sample performance YTD is 8.0%, and for the last 12 months is 19.0%. Over the same period the benchmark SPY performance was 17.7% and 39.7% respectively. Over the previous week the market value of the iM-Best2 MC-Score ETF System gained 0.61% at a time when SPY gained 0.96%. A starting capital of $100,000 at inception on 6/30/2016 would have grown to $141,804 which includes $2,781 cash and excludes $1,386 spent on fees and slippage. |
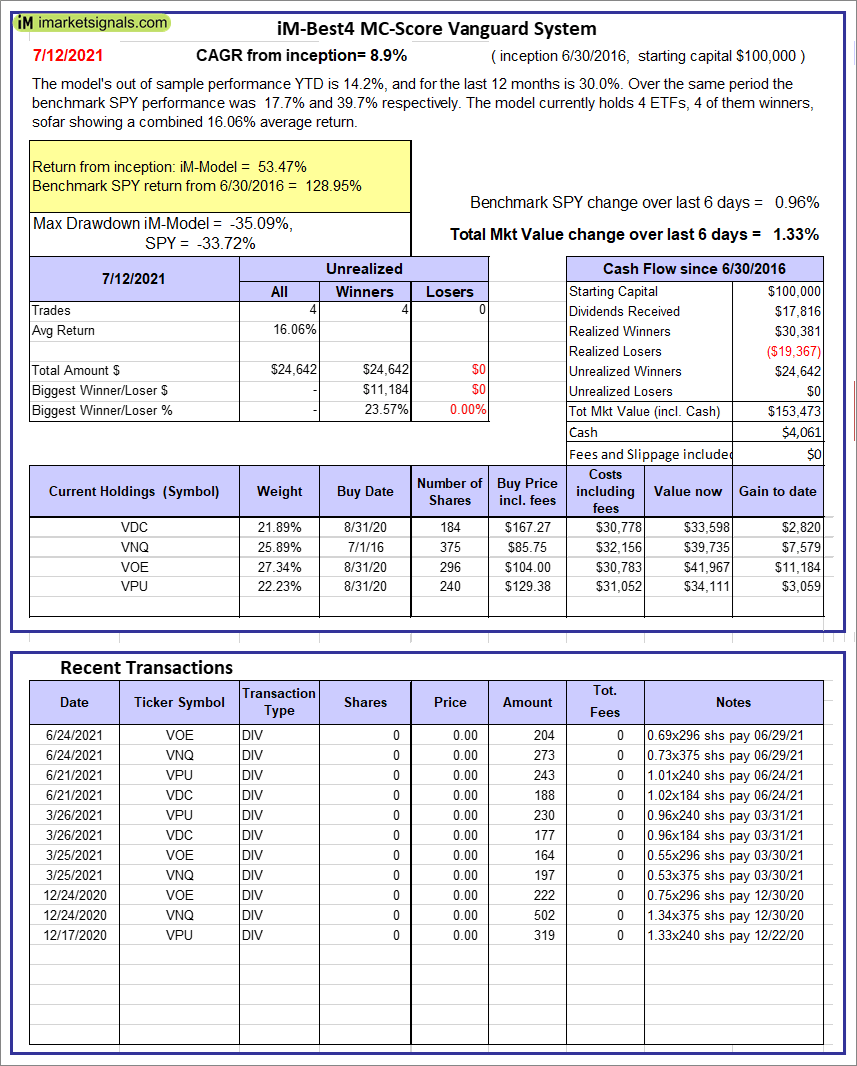 |
iM-Best4 MC-Score Vanguard System: The model’s out of sample performance YTD is 14.2%, and for the last 12 months is 30.0%. Over the same period the benchmark SPY performance was 17.7% and 39.7% respectively. Over the previous week the market value of the iM-Best4 MC-Score Vanguard System gained 1.33% at a time when SPY gained 0.96%. A starting capital of $100,000 at inception on 6/30/2016 would have grown to $153,473 which includes $4,061 cash and excludes $00 spent on fees and slippage. |
 |
iM-Composite (SPY-IEF) Timer: The model’s out of sample performance YTD is 17.5%, and for the last 12 months is 30.6%. Over the same period the benchmark SPY performance was 17.7% and 39.7% respectively. Over the previous week the market value of the iM-Composite (SPY-IEF) Timer gained 0.95% at a time when SPY gained 0.96%. A starting capital of $100,000 at inception on 6/30/2016 would have grown to $184,189 which includes $2,364 cash and excludes $3,984 spent on fees and slippage. |
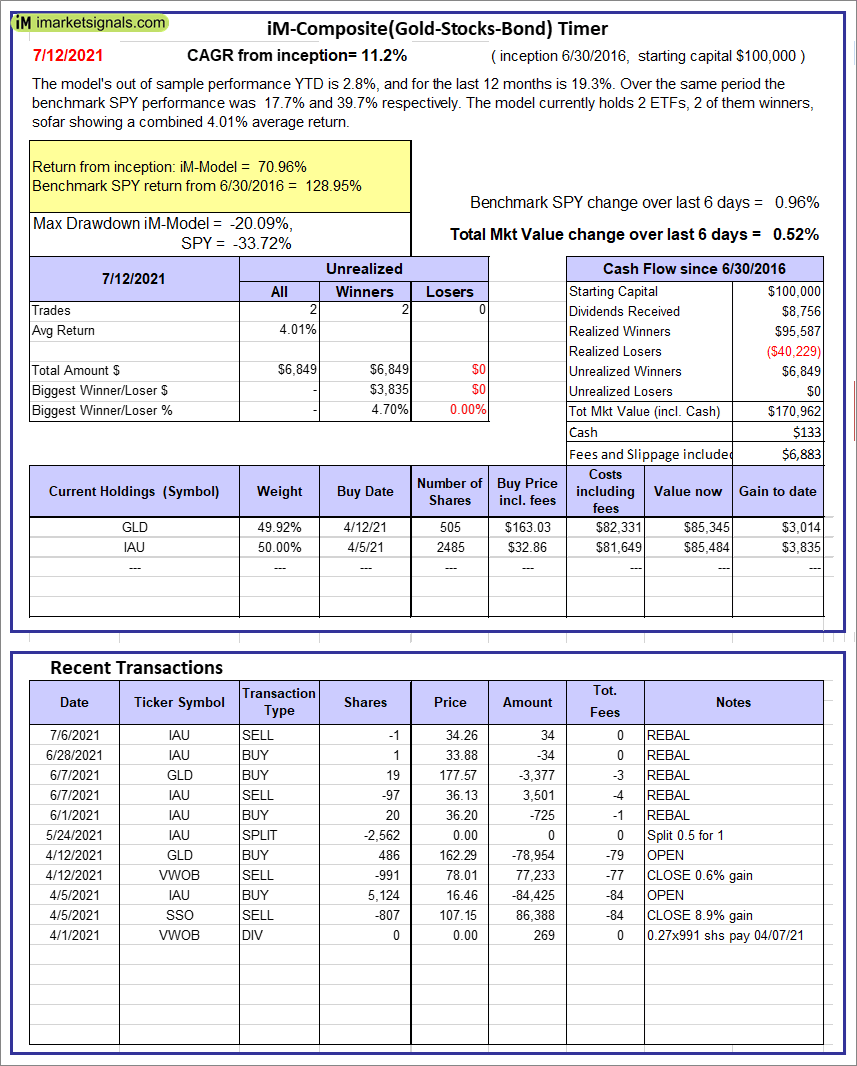 |
iM-Composite(Gold-Stocks-Bond) Timer: The model’s out of sample performance YTD is 2.8%, and for the last 12 months is 19.3%. Over the same period the benchmark SPY performance was 17.7% and 39.7% respectively. Over the previous week the market value of the iM-Composite(Gold-Stocks-Bond) Timer gained 0.52% at a time when SPY gained 0.96%. A starting capital of $100,000 at inception on 6/30/2016 would have grown to $170,962 which includes $133 cash and excludes $6,883 spent on fees and slippage. |
iM-Best Reports – 7/12/21
Posted in pmp SPY-SH
Leave a Reply
You must be logged in to post a comment.