
- Consumer Sentiment, when expressed as the difference in return of the Consumer Staples- and the Consumer Discretionary sectors, can provide risk-on and risk-off signals for equity investment.
- Also a reasonably reliable risk indicator is the Cyclically Adjusted Risk Premium (CARP), defined as the inverse of the Shiller CAPE Ratio (CAPE) in percent minus the 10-year note yield.
- The Consumer Sentiment Timer can be improved by including the value of the CARP in its rules to provide more profitable risk-on and risk-off signals for equity investment.
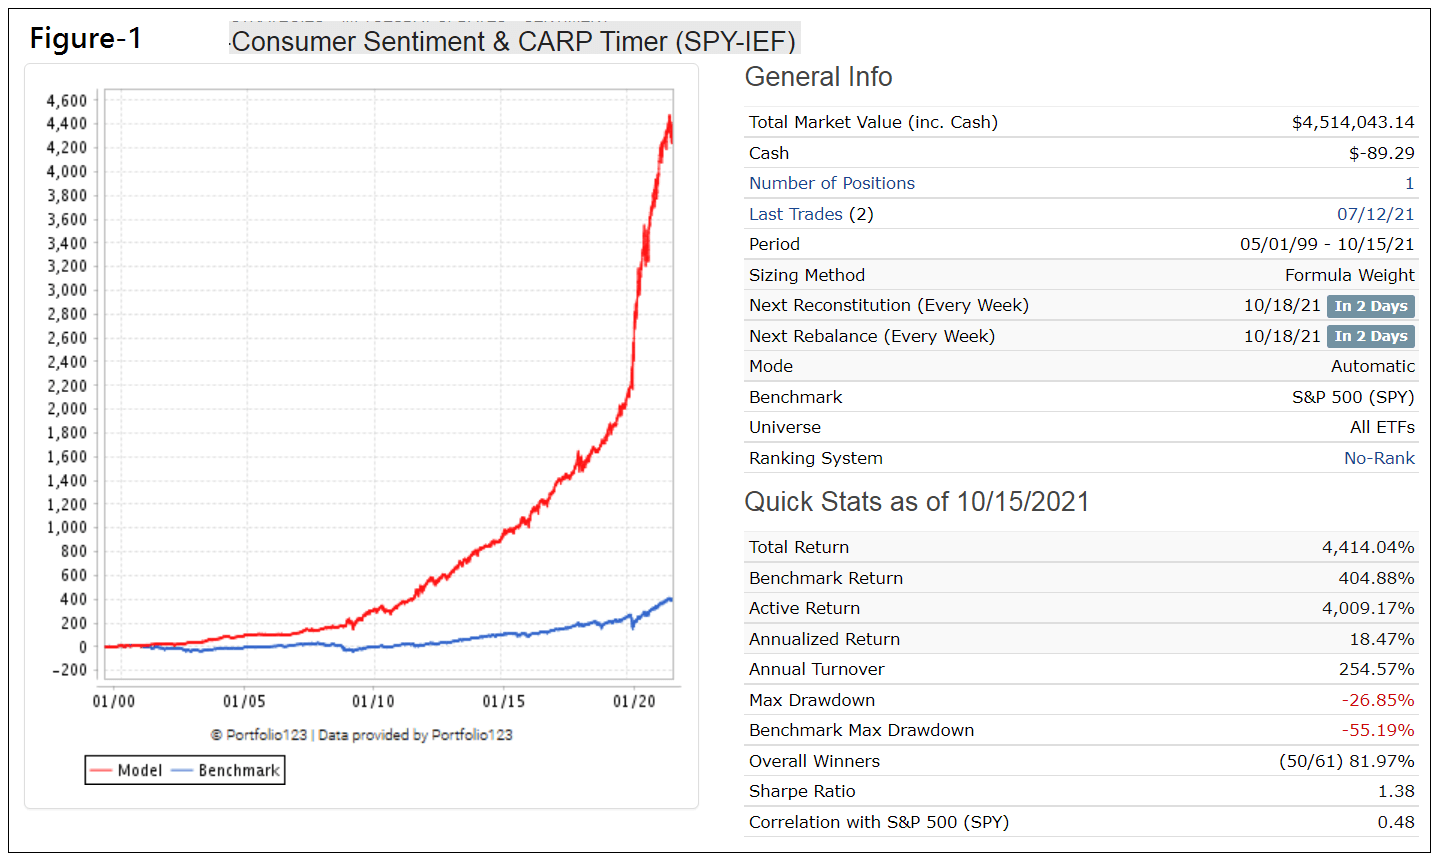
- From 5/1/1999 to 10/15/2021 the Consumer Sentiment & CARP Timer, when accordingly switching between ETFs SPY and IEF, would have produced 18.5% annualized return with a maximum drawdown of -27%.
The Consumer Sentiment Timer is described here, and the CARP Timer here.
Backtesting with historic point-in-time data
The backtest was performed on the online platform Portfolio 123 (P123) for the period 5/1/1999 to 10/15/2021. Trading costs of 0.05% of transaction amounts were assumed.
The backtest was started on 5/1/1999 because it is the earliest date available when allowing for the Consumer Sentiment Timer’s required lookback period.
Strategy Rules
- The signal for equity investment requires the value of CARP to exceed 1.8% or the discretionary sector to outperform the staples sector over a 15 week period.
- All trading is specified to occur on the first trading day of a week (typically on a Monday) after a signal at the end of the preceding week. Equities and fixed income can only be sold after a minimum holding period of 45 calendar days and 25 calendar days, respectively.
Backtest performance with equity ETF (SPY) and fixed income ETF (IEF) from 1999
The model’s performance from 5/1/1999 to 10/15/2021 is shown in Figure-1. The model produced an 18.5% annualized return with a maximum drawdown of -27%, while the benchmark ETF (SPY) produced 7.5% with a maximum drawdown of -55%.
Over this period, longer than 22 years, there were only 60 realized buy & sell trades, indicating that one would have to trade less than 3-times per year on average. (Note that the original model without CARP has a higher turnover, producing 70 trades over this period.)
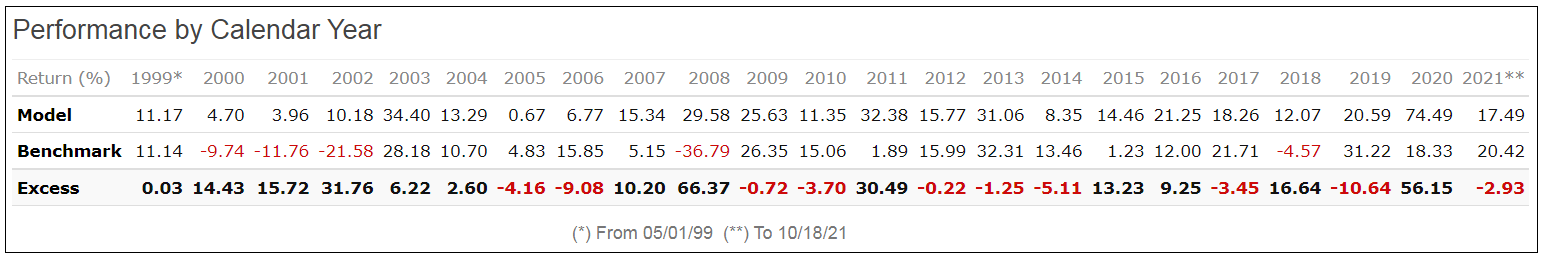
The calendar year performance is also shown below Figure-1. The model produced only positive returns each year.
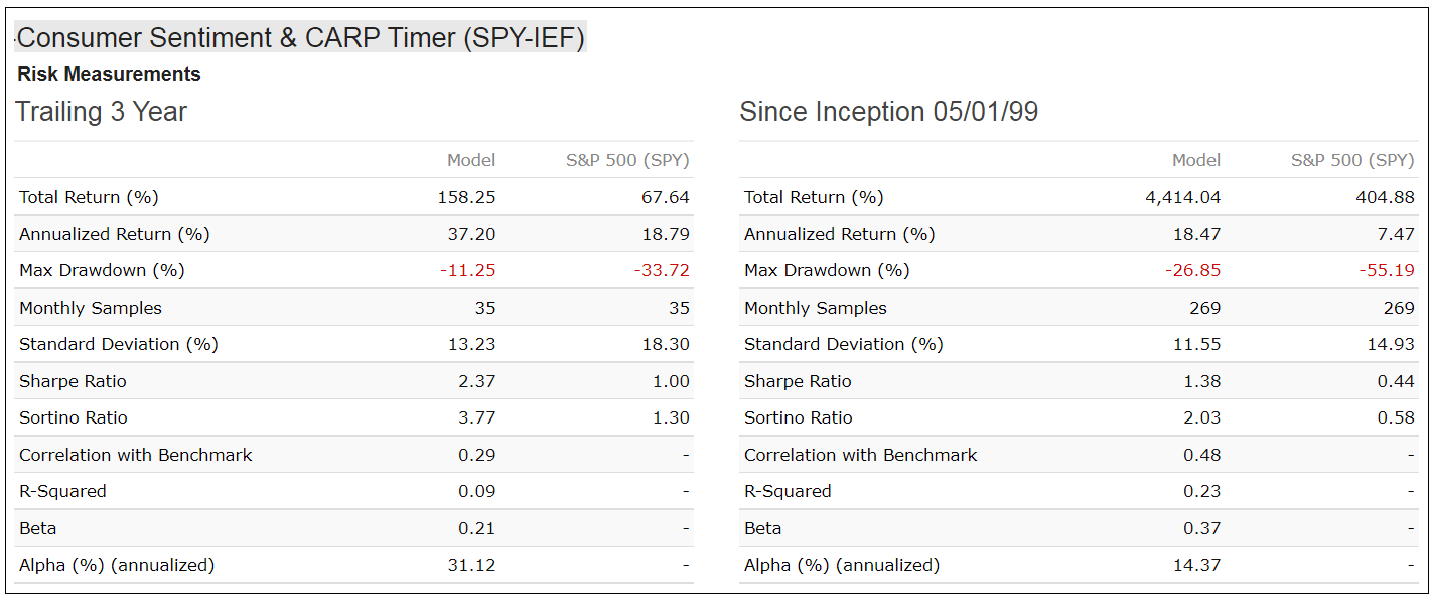
Risk Measurements
In the table below are the risk statistics for the model relative to the benchmark ETF (SPY). The model’s positive alpha indicates that this strategy would have outperformed its risk-adjusted benchmark return on average by 14.4% per year since 1999. Additionally, SPY’s much higher Standard Deviation of 15% (versus 12% for the Model) indicates higher volatility of SPY’s monthly returns and demonstrates that the model’s investment strategy should be a better alternative to buy-and-hold SPY over the longer term.
Conclusion
It would appear that one can out-perform the S&P 500 by selecting investments in equities or fixed income according to consumer sentiment together with the Cyclically Adjusted Risk Premium. No other market timing is used.
The model produced average annualized returns of 18.5% since 1999, and 37.2% for the trailing 3 years. It avoided being in equities during the worst market periods as indicated by the relatively reasonable maximum drawdown of -27% which occurred in March 2009.
Over the up-market period 3/9/2009 to 10/15/2021 the model significantly outperformed SPY. It produced a total return of 1,722% versus 742% for SPY, with a considerably better maximum drawdown of -15% versus -34% for SPY. It also avoided the market correction in December 2018 and the “covid” bear market early in 2020 as shown in Figure-2 in the appendix.
At iMarketSignals we will report weekly the holdings and performance of this model; it currently holds SPY since 7/12/2021.
Appendix
Backtest performance with equity ETF (SPY) and fixed income ETF (IEF) from 2016
The model’s performance from 1/1/2016 to 10/15/2021 is shown in Figure-2.

Trading History
| Symbol | Open | Close | Days | Pct |
| SPY | 5/3/1999 | 8/2/1999 | 91 | -2.00% |
| IEF | 8/2/1999 | 10/4/1999 | 63 | 0.50% |
| SPY | 10/4/1999 | 4/24/2000 | 203 | 8.70% |
| IEF | 4/24/2000 | 9/18/2000 | 147 | 3.10% |
| SPY | 9/18/2000 | 11/6/2000 | 49 | -0.70% |
| IEF | 11/6/2000 | 4/23/2001 | 168 | 7.20% |
| SPY | 4/23/2001 | 6/11/2001 | 49 | 3.10% |
| IEF | 6/11/2001 | 7/9/2001 | 28 | 0.10% |
| SPY | 7/9/2001 | 8/27/2001 | 49 | -1.30% |
| IEF | 8/27/2001 | 12/24/2001 | 119 | 0.70% |
| SPY | 12/24/2001 | 3/4/2002 | 70 | 0.80% |
| IEF | 3/4/2002 | 11/18/2002 | 259 | 10.10% |
| SPY | 11/18/2002 | 1/6/2003 | 49 | 2.60% |
| IEF | 1/6/2003 | 2/3/2003 | 28 | 0.30% |
| SPY | 2/3/2003 | 3/24/2003 | 49 | 0.40% |
| IEF | 3/24/2003 | 4/21/2003 | 28 | 0.00% |
| SPY | 4/21/2003 | 2/9/2004 | 294 | 27.60% |
| IEF | 2/9/2004 | 10/11/2004 | 245 | -0.20% |
| SPY | 10/11/2004 | 1/10/2005 | 91 | 5.20% |
| IEF | 1/10/2005 | 7/18/2005 | 189 | 0.30% |
| SPY | 7/18/2005 | 9/26/2005 | 70 | -0.70% |
| IEF | 9/26/2005 | 1/17/2006 | 113 | -0.60% |
| SPY | 1/17/2006 | 3/13/2006 | 55 | 0.30% |
| IEF | 3/13/2006 | 4/10/2006 | 28 | -1.00% |
| SPY | 4/10/2006 | 5/30/2006 | 50 | -2.90% |
| IEF | 5/30/2006 | 10/9/2006 | 132 | 2.50% |
| SPY | 10/9/2006 | 2/5/2007 | 119 | 7.10% |
| IEF | 2/5/2007 | 3/5/2007 | 28 | 2.00% |
| SPY | 3/5/2007 | 4/23/2007 | 49 | 7.70% |
| IEF | 4/23/2007 | 6/25/2007 | 63 | -2.90% |
| SPY | 6/25/2007 | 8/13/2007 | 49 | -3.20% |
| IEF | 8/13/2007 | 4/7/2008 | 238 | 9.80% |
| SPY | 4/7/2008 | 5/27/2008 | 50 | 1.10% |
| IEF | 5/27/2008 | 12/1/2008 | 188 | 8.10% |
| SPY | 12/1/2008 | 6/28/2010 | 574 | 30.80% |
| IEF | 6/28/2010 | 7/26/2010 | 28 | 0.20% |
| SPY | 7/26/2010 | 3/28/2011 | 245 | 17.30% |
| IEF | 3/28/2011 | 8/22/2011 | 147 | 11.40% |
| SPY | 8/22/2011 | 3/31/2014 | 952 | 65.70% |
| IEF | 3/31/2014 | 8/4/2014 | 126 | 1.80% |
| SPY | 8/4/2014 | 10/6/2014 | 63 | 1.10% |
| IEF | 10/6/2014 | 2/2/2015 | 119 | 5.80% |
| SPY | 2/2/2015 | 7/13/2015 | 161 | 3.80% |
| IEF | 7/13/2015 | 10/5/2015 | 84 | 3.10% |
| SPY | 10/5/2015 | 12/21/2015 | 77 | 1.50% |
| IEF | 12/21/2015 | 2/1/2016 | 42 | 2.00% |
| SPY | 2/1/2016 | 3/13/2017 | 406 | 22.70% |
| IEF | 3/13/2017 | 5/15/2017 | 63 | 2.20% |
| SPY | 5/15/2017 | 8/21/2017 | 98 | 1.00% |
| IEF | 8/21/2017 | 9/18/2017 | 28 | -0.40% |
| SPY | 9/18/2017 | 8/27/2018 | 343 | 15.90% |
| IEF | 8/27/2018 | 2/4/2019 | 161 | 1.10% |
| SPY | 2/4/2019 | 5/20/2019 | 105 | 4.30% |
| IEF | 5/20/2019 | 9/3/2019 | 106 | 7.00% |
| SPY | 9/3/2019 | 10/21/2019 | 48 | 3.10% |
| IEF | 10/21/2019 | 11/25/2019 | 35 | 0.10% |
| SPY | 11/25/2019 | 2/10/2020 | 77 | 6.70% |
| IEF | 2/10/2020 | 3/16/2020 | 35 | 6.00% |
| SPY | 3/16/2020 | 6/14/2021 | 455 | 77.10% |
| IEF | 6/14/2021 | 7/12/2021 | 28 | 0.90% |
| SPY | 7/12/2021 | — | — | — |
Not a single negative year. Very interesting. Could you please publish the results of the original model (without CARP) ? Thank you