
  |
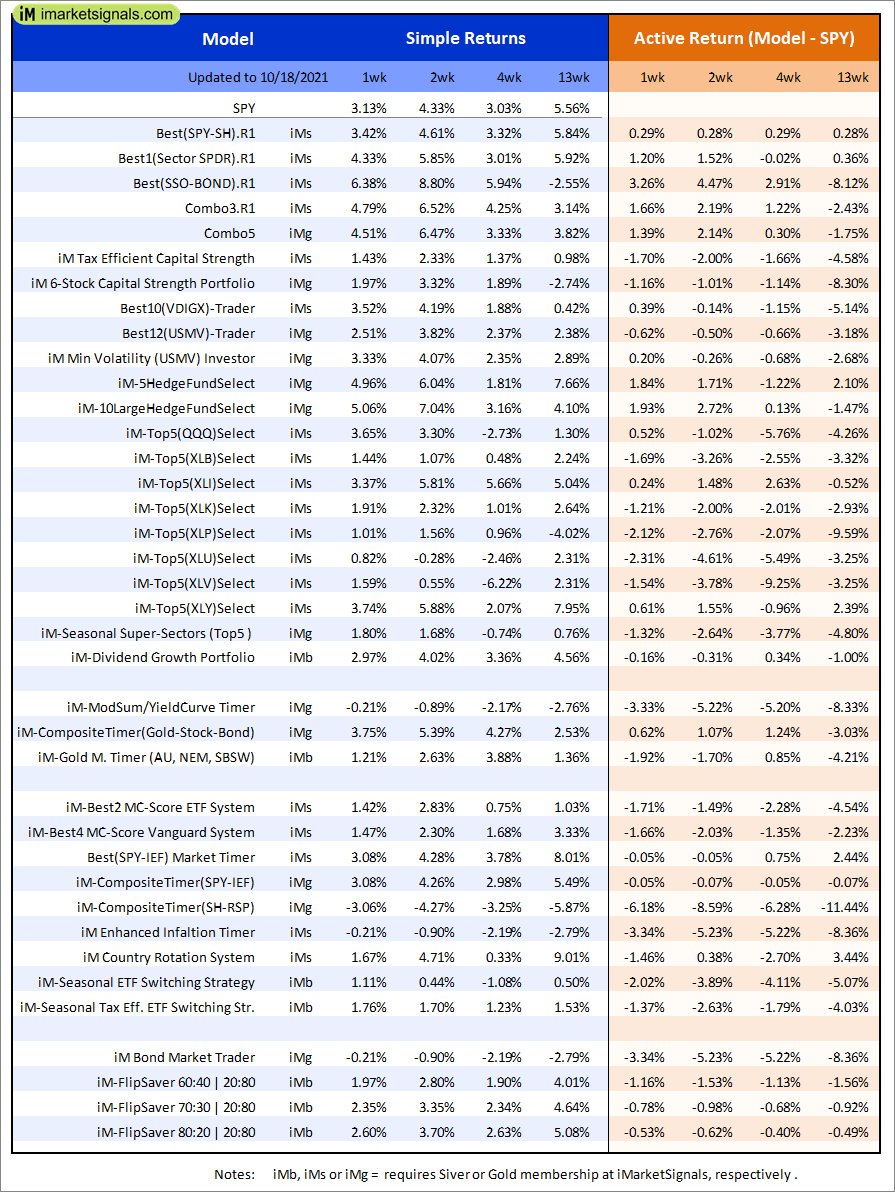
Out of sample performance summary of our models for the past 1, 2, 4 and 13 week periods. The active active return indicates how the models over- or underperformed the benchmark ETF SPY. Also the YTD, and the 1-, 3-, 5- and 10-year annualized returns are shown in the second table |
 |
iM-FlipSaver 60:40 | 20:80 – 2017: The model’s out of sample performance YTD is 14.0%, and for the last 12 months is 21.5%. Over the same period the benchmark E60B40 performance was 11.3% and 17.1% respectively. Over the previous week the market value of iM-FlipSaver 80:20 | 20:80 gained 2.11% at a time when SPY gained 1.93%. A starting capital of $100,000 at inception on 7/16/2015 would have grown to $157,280 which includes $506 cash and excludes $1,786 spent on fees and slippage. |
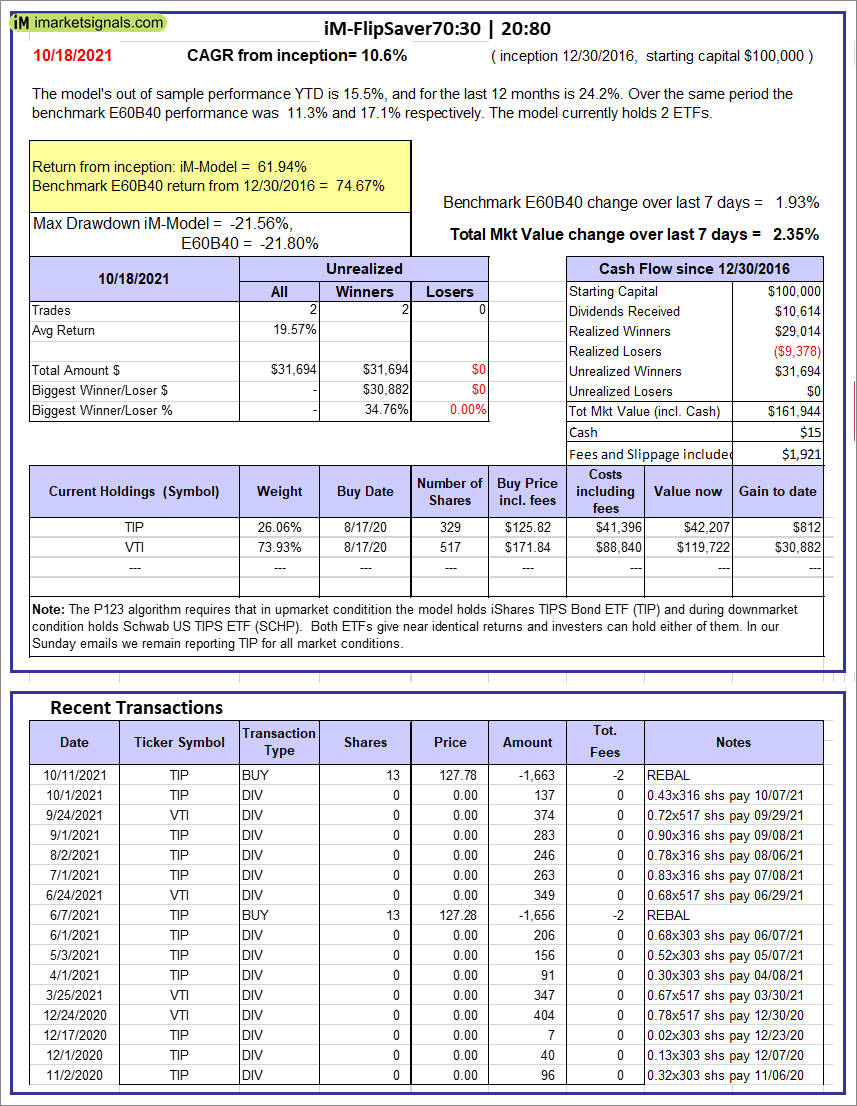 |
iM-FlipSaver 70:30 | 20:80 – 2017: The model’s out of sample performance YTD is 15.5%, and for the last 12 months is 24.2%. Over the same period the benchmark E60B40 performance was 11.3% and 17.1% respectively. Over the previous week the market value of iM-FlipSaver 70:30 | 20:80 gained 2.35% at a time when SPY gained 1.93%. A starting capital of $100,000 at inception on 7/15/2015 would have grown to $161,944 which includes $15 cash and excludes $1,921 spent on fees and slippage. |
 |
iM-FlipSaver 80:20 | 20:80 – 2017: The model’s out of sample performance YTD is 17.0%, and for the last 12 months is 26.8%. Over the same period the benchmark E60B40 performance was 11.3% and 17.1% respectively. Over the previous week the market value of iM-FlipSaver 80:20 | 20:80 gained 2.57% at a time when SPY gained 1.93%. A starting capital of $100,000 at inception on 1/2/2017 would have grown to $166,478 which includes $1,574 cash and excludes $2,047 spent on fees and slippage. |
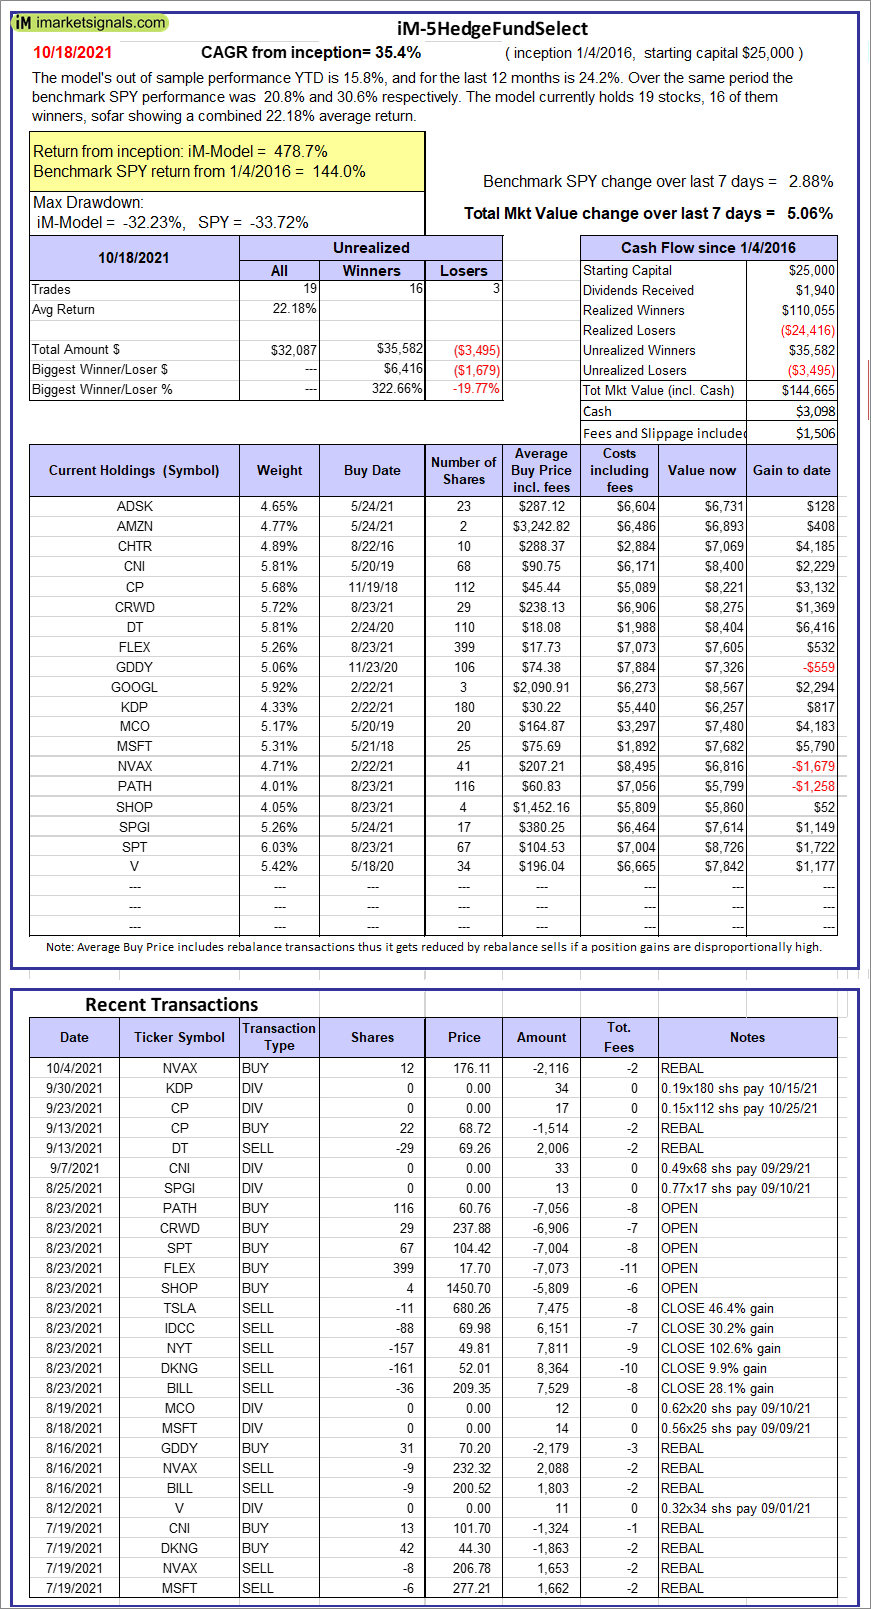  |
iM-5HedgeFundSelect: Since inception, on 1/5/2016, the model gained 478.66% while the benchmark SPY gained 143.95% over the same period. Over the previous week the market value of iM-5HedgeFundSelect gained 5.06% at a time when SPY gained 2.88%. A starting capital of $25,000 at inception on 1/5/2016 would have grown to $144,665 which includes $3,098 cash and excludes $1,506 spent on fees and slippage. |
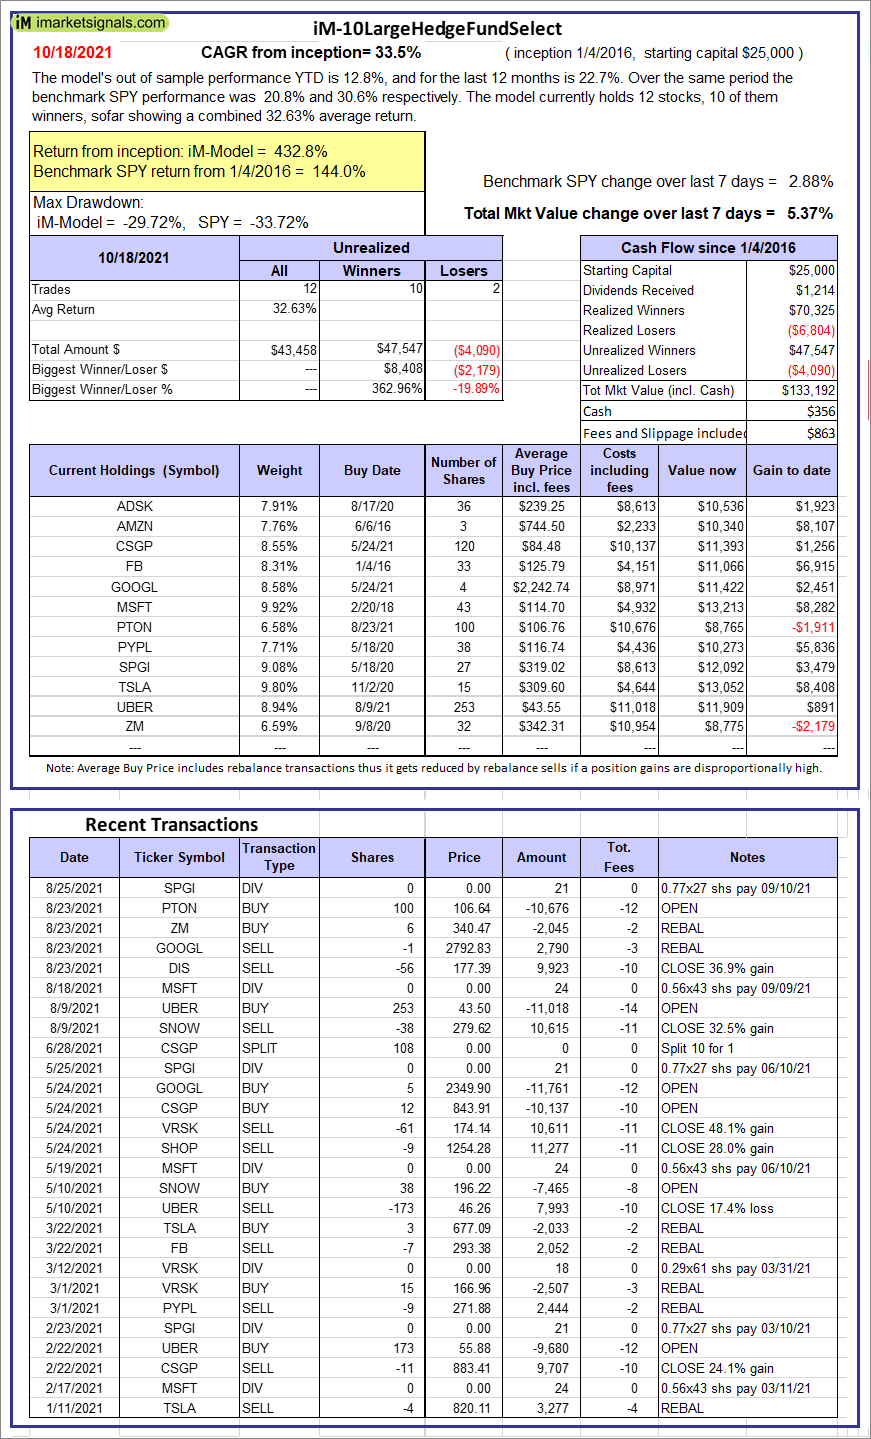 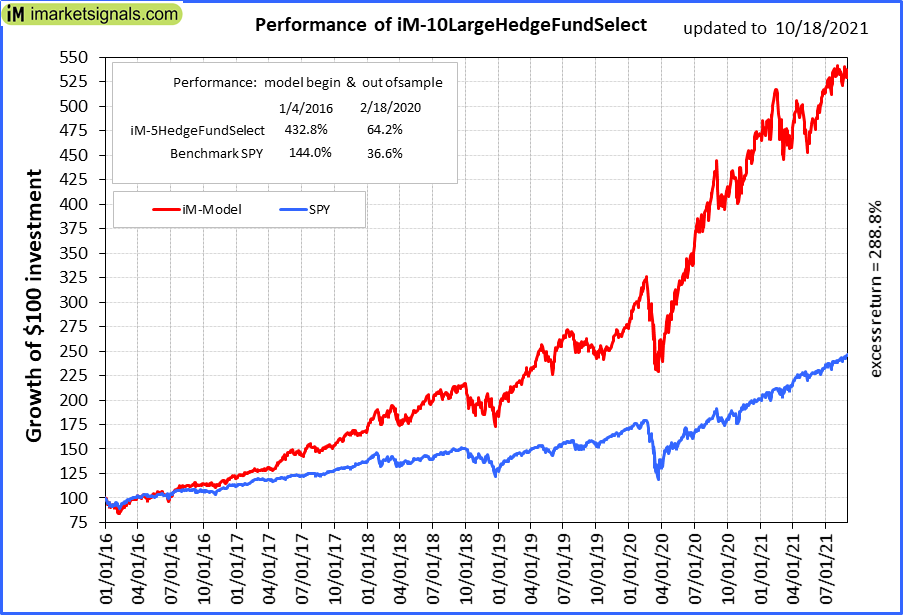 |
iM-10LargeHedgeFundSelect: Since inception, on 1/5/2016, the model gained 432.77% while the benchmark SPY gained 143.95% over the same period. Over the previous week the market value of iM-10LargeHedgeFundSelect gained 5.37% at a time when SPY gained 2.88%. A starting capital of $25,000 at inception on 1/5/2016 would have grown to $133,192 which includes $356 cash and excludes $863 spent on fees and slippage. |
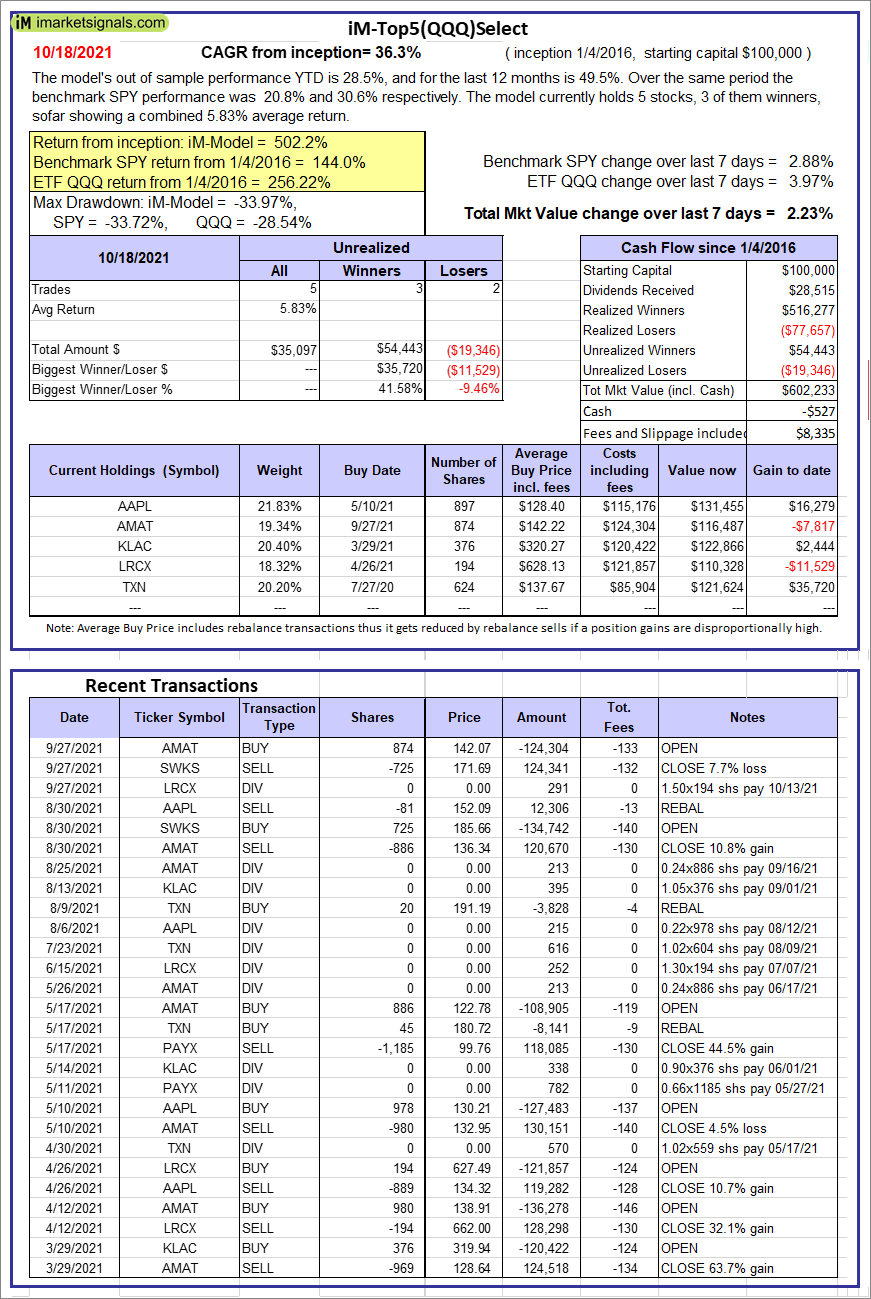 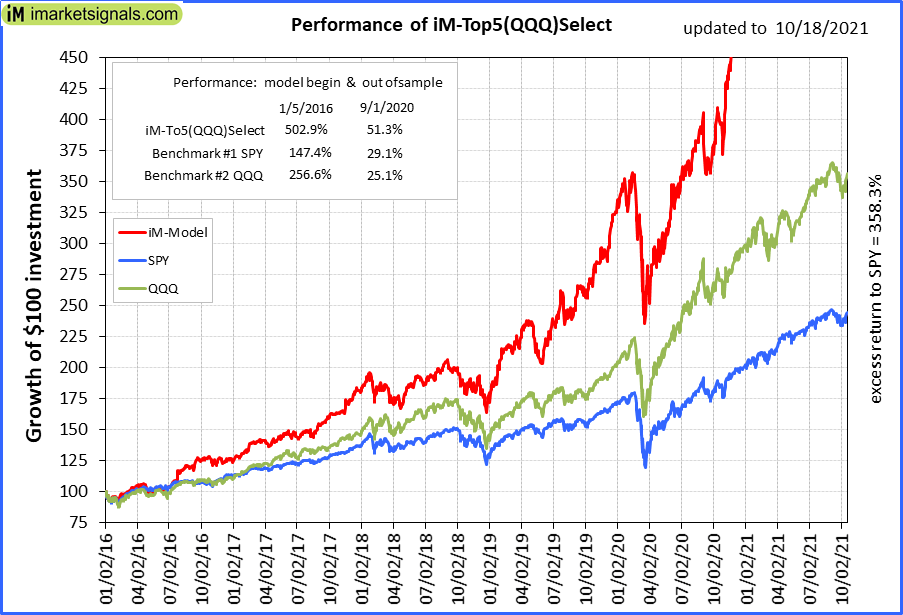 |
iM-Top5(QQQ)Select: Since inception, on 1/5/2016, the model gained 502.23% while the benchmark SPY gained 143.95% over the same period. Over the previous week the market value of iM-Top5(QQQ)Select gained 2.23% at a time when SPY gained 2.88%. A starting capital of $100,000 at inception on 1/5/2016 would have grown to $602,233 which includes -$527 cash and excludes $8,335 spent on fees and slippage. |
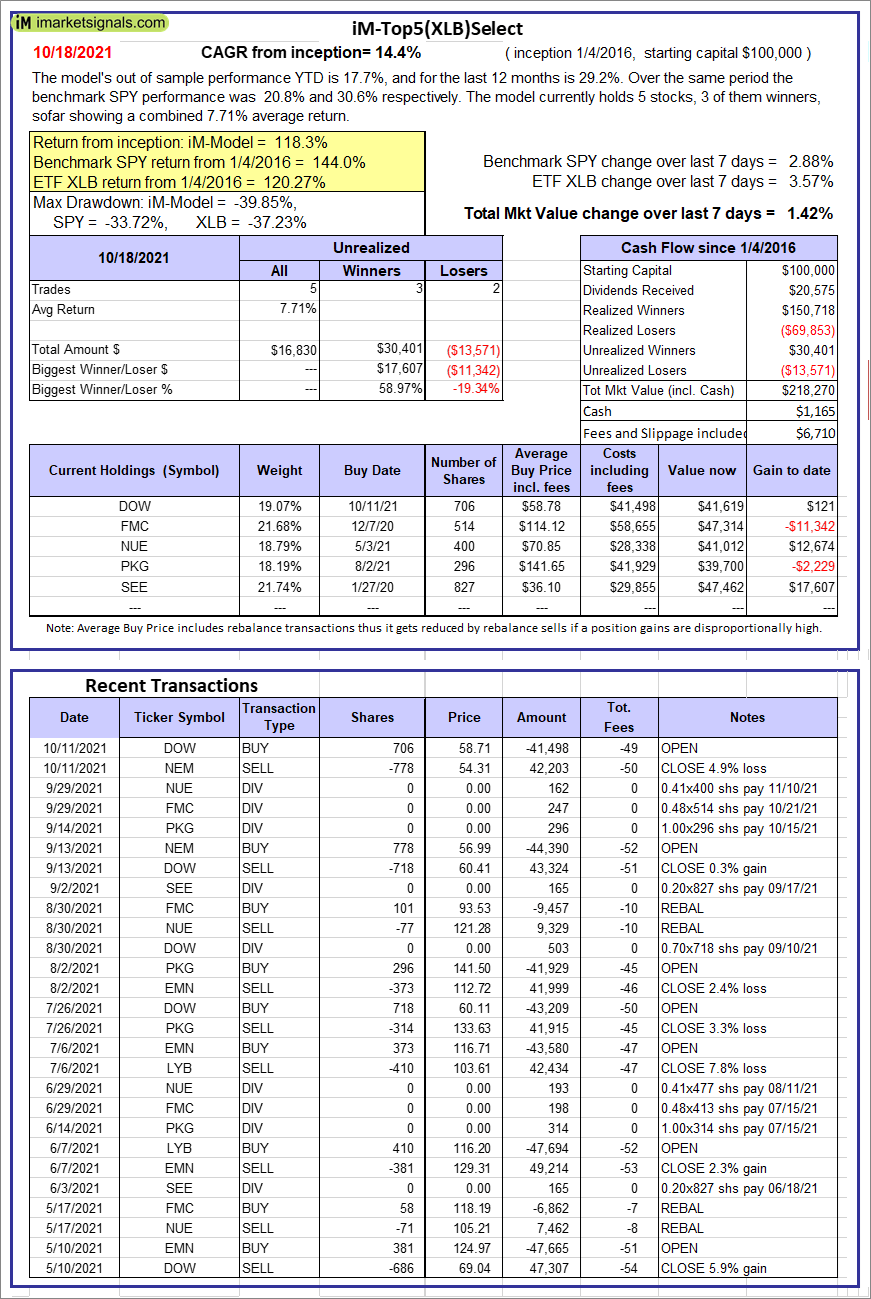 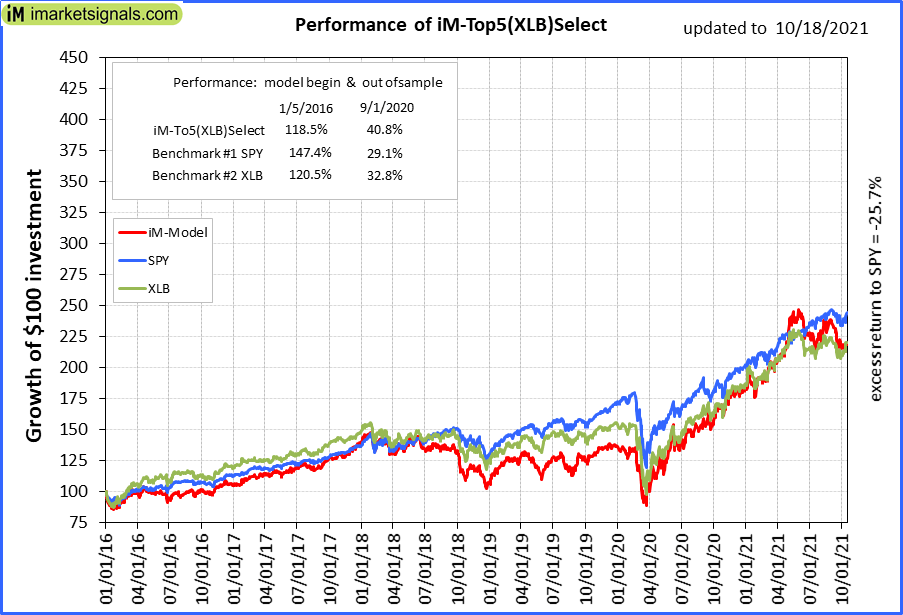 |
iM-Top5(XLB)Select: Since inception, on 1/5/2016, the model gained 118.27% while the benchmark SPY gained 143.95% over the same period. Over the previous week the market value of iM-Top5(XLB)Select gained 1.42% at a time when SPY gained 2.88%. A starting capital of $100,000 at inception on 1/5/2016 would have grown to $218,270 which includes $1,165 cash and excludes $6,710 spent on fees and slippage. |
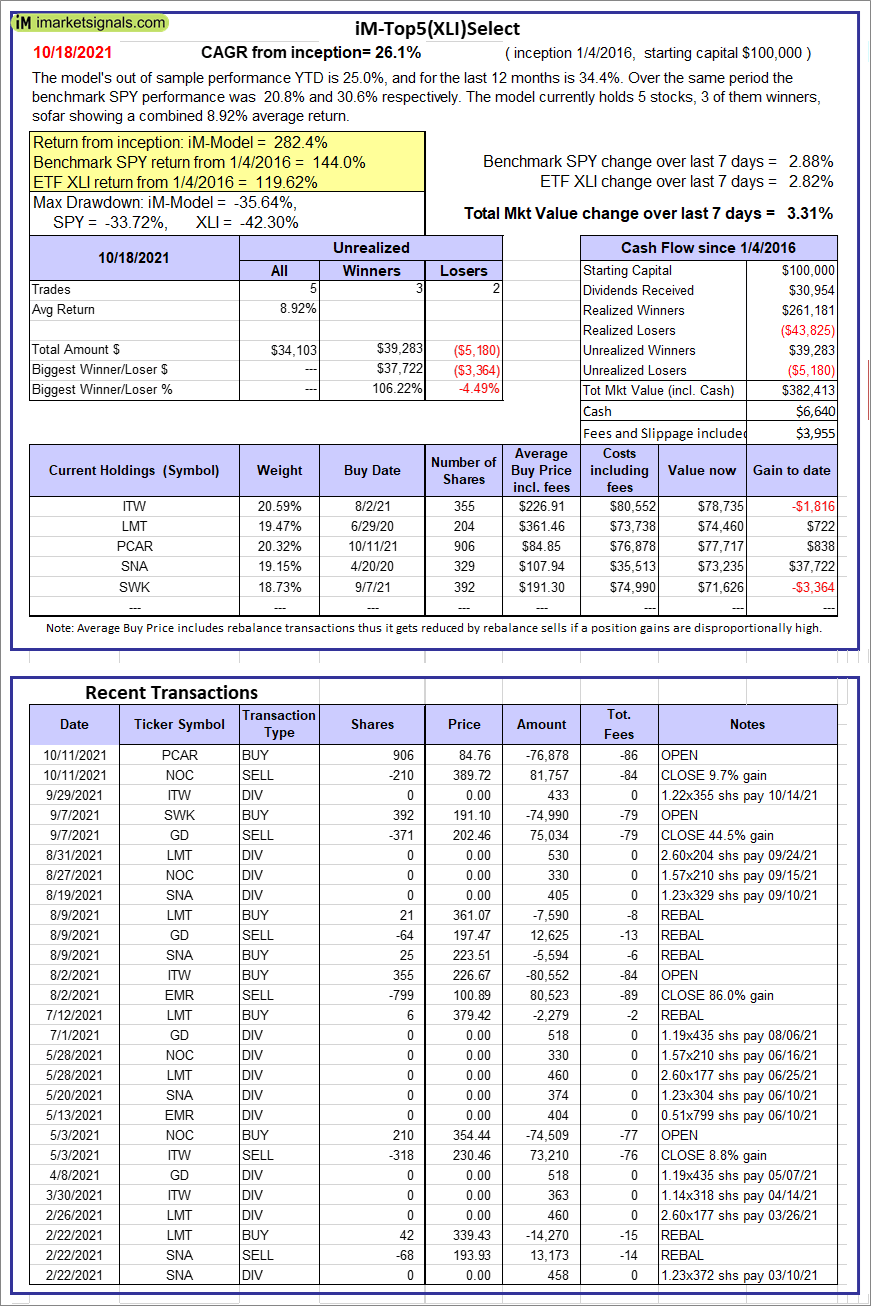  |
iM-Top5(XLI)Select: Since inception, on 1/5/2016, the model gained 282.41% while the benchmark SPY gained 143.95% over the same period. Over the previous week the market value of iM-Top5(XLI)Select gained 3.31% at a time when SPY gained 2.88%. A starting capital of $100,000 at inception on 1/5/2016 would have grown to $382,413 which includes $6,640 cash and excludes $3,955 spent on fees and slippage. |
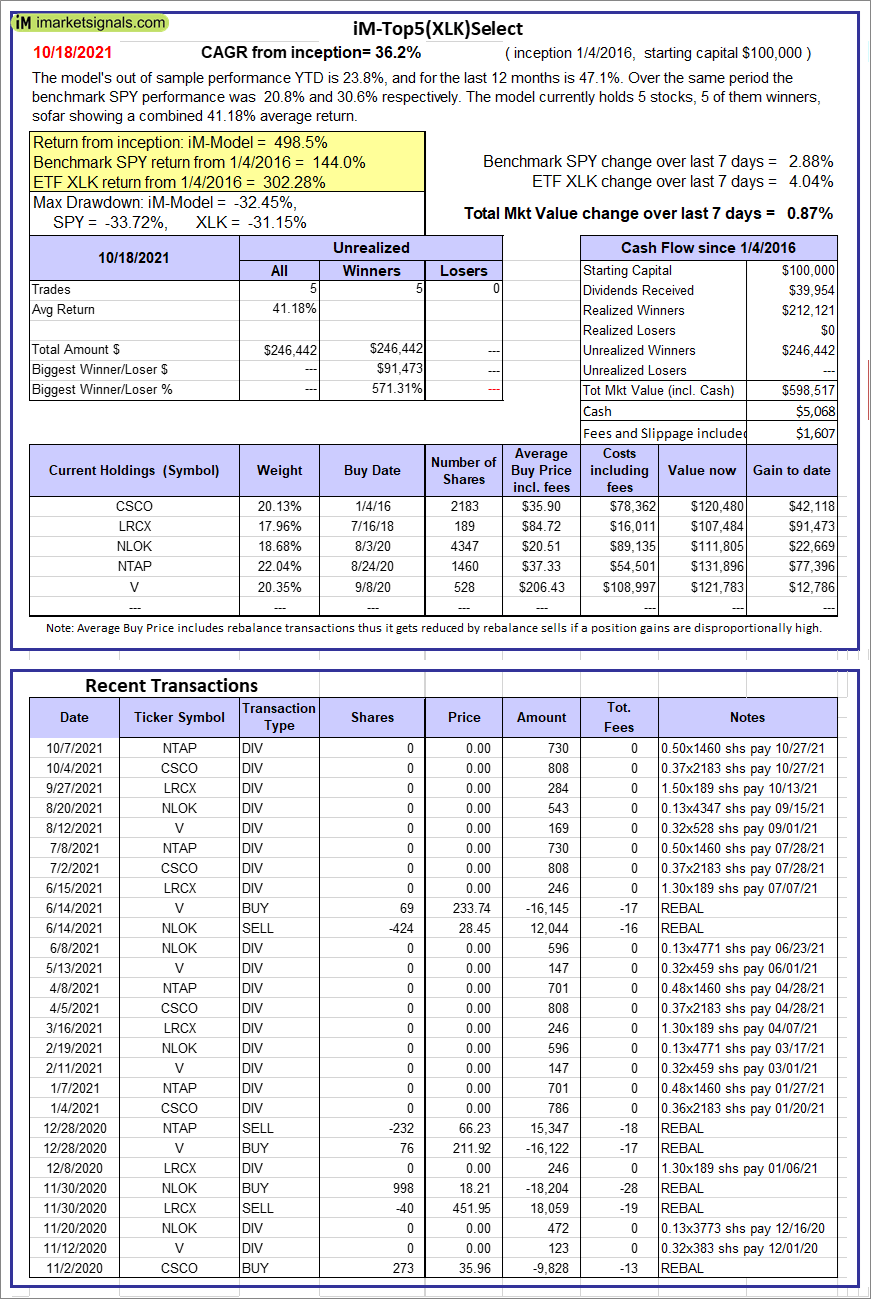 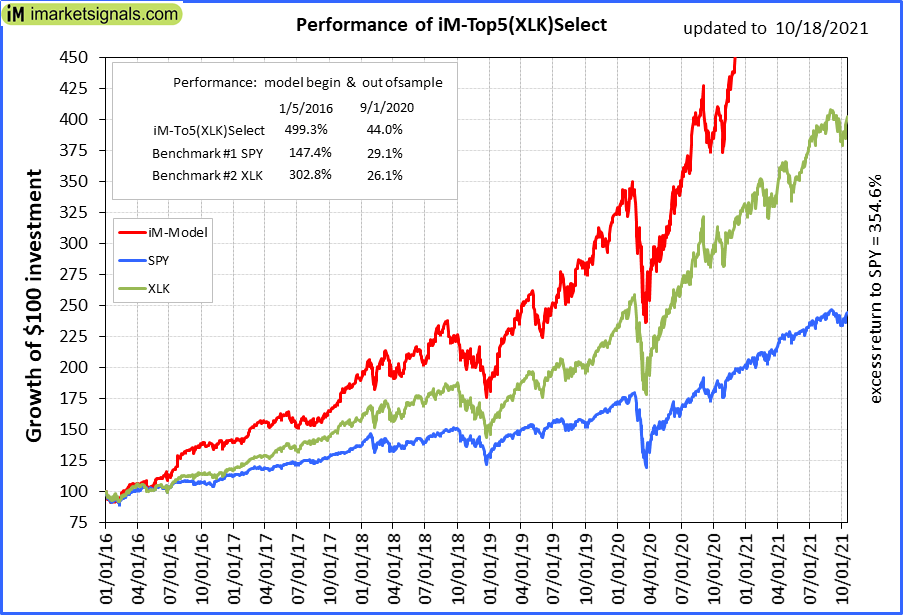 |
iM-Top5(XLK)Select: Since inception, on 1/5/2016, the model gained 498.52% while the benchmark SPY gained 143.95% over the same period. Over the previous week the market value of iM-Top5(XLK)Select gained 0.87% at a time when SPY gained 2.88%. A starting capital of $100,000 at inception on 1/5/2016 would have grown to $598,517 which includes $5,068 cash and excludes $1,607 spent on fees and slippage. |
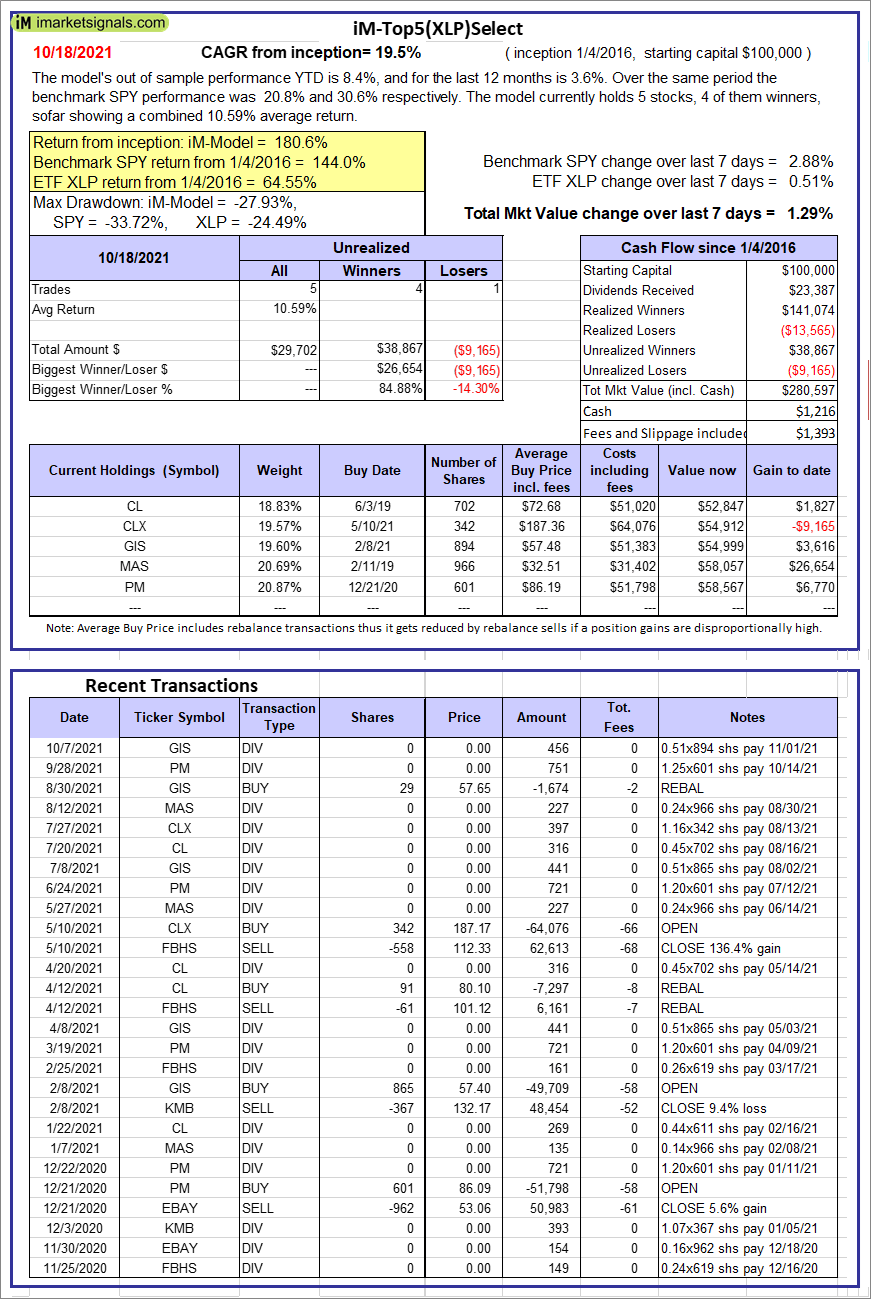 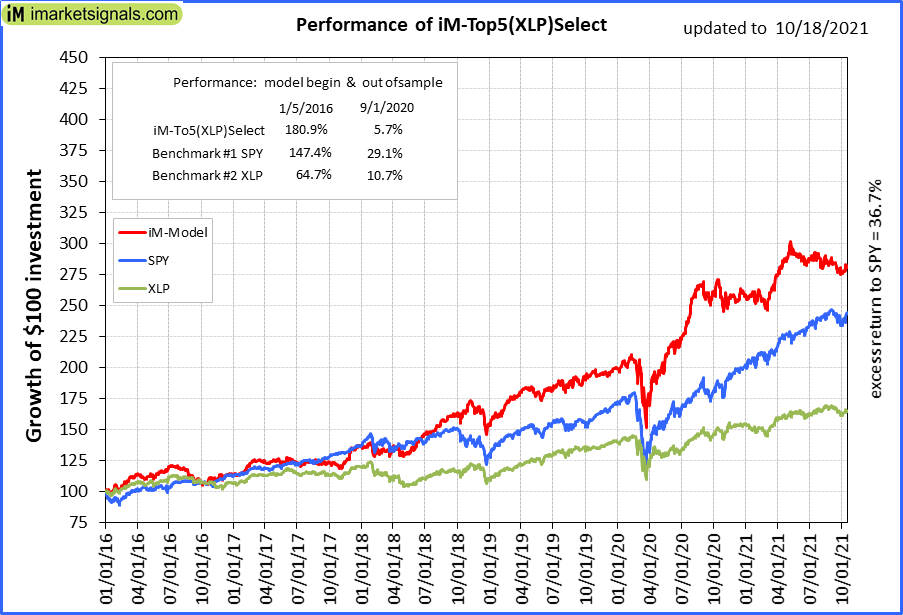 |
iM-Top5(XLP)Select: Since inception, on 1/5/2016, the model gained 180.60% while the benchmark SPY gained 143.95% over the same period. Over the previous week the market value of iM-Top5(XLP)Select gained 1.29% at a time when SPY gained 2.88%. A starting capital of $100,000 at inception on 1/5/2016 would have grown to $280,597 which includes $1,216 cash and excludes $1,393 spent on fees and slippage. |
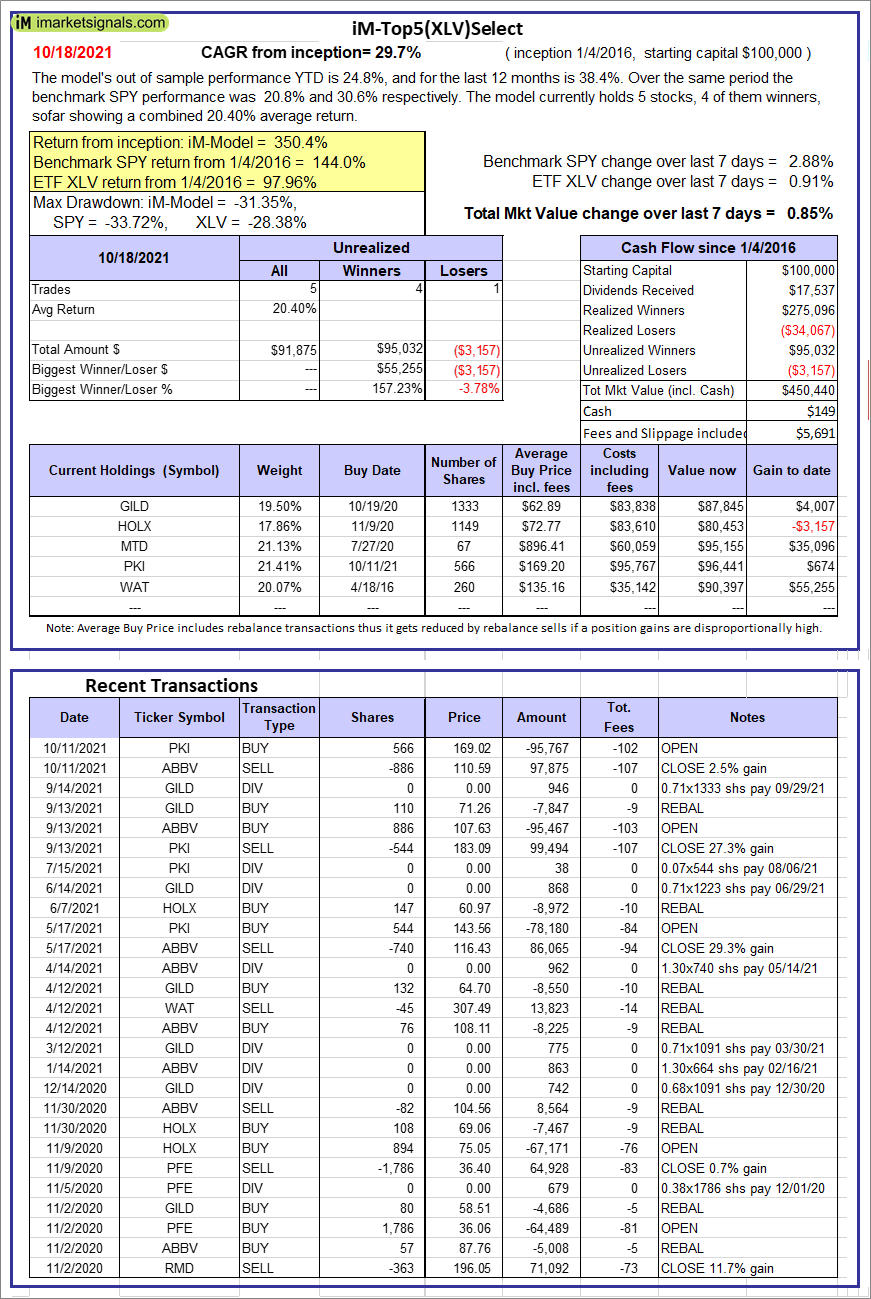 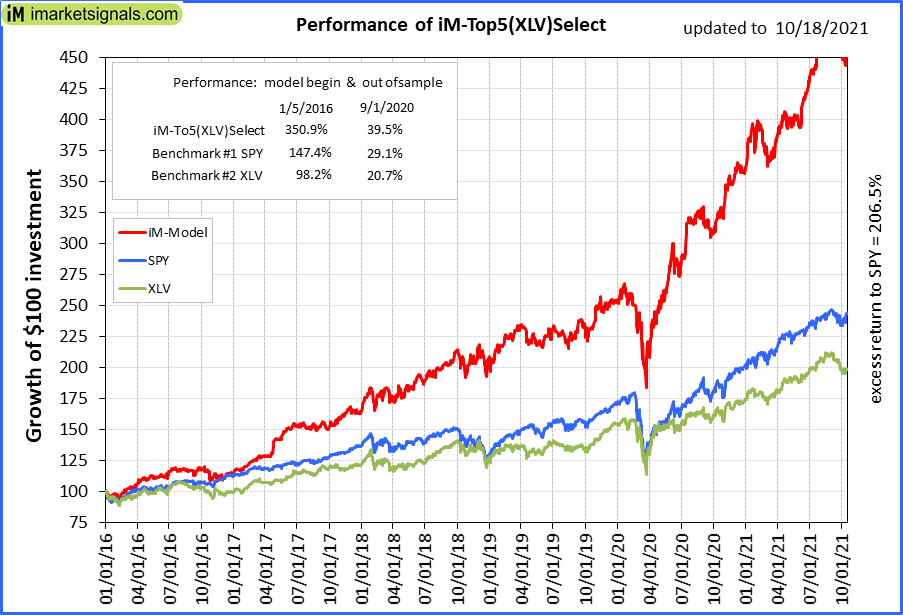 |
iM-Top5(XLV)Select: Since inception, on 1/5/2016, the model gained 350.44% while the benchmark SPY gained 143.95% over the same period. Over the previous week the market value of iM-Top5(XLV)Select gained 0.85% at a time when SPY gained 2.88%. A starting capital of $100,000 at inception on 1/5/2016 would have grown to $450,440 which includes $149 cash and excludes $5,691 spent on fees and slippage. |
  |
iM-Top5(XLU)Select: Since inception, on 1/5/2016, the model gained 100.83% while the benchmark SPY gained 143.95% over the same period. Over the previous week the market value of iM-Top5(XLU)Select gained 1.55% at a time when SPY gained 2.88%. A starting capital of $100,000 at inception on 1/5/2016 would have grown to $200,830 which includes $422 cash and excludes $7,883 spent on fees and slippage. |
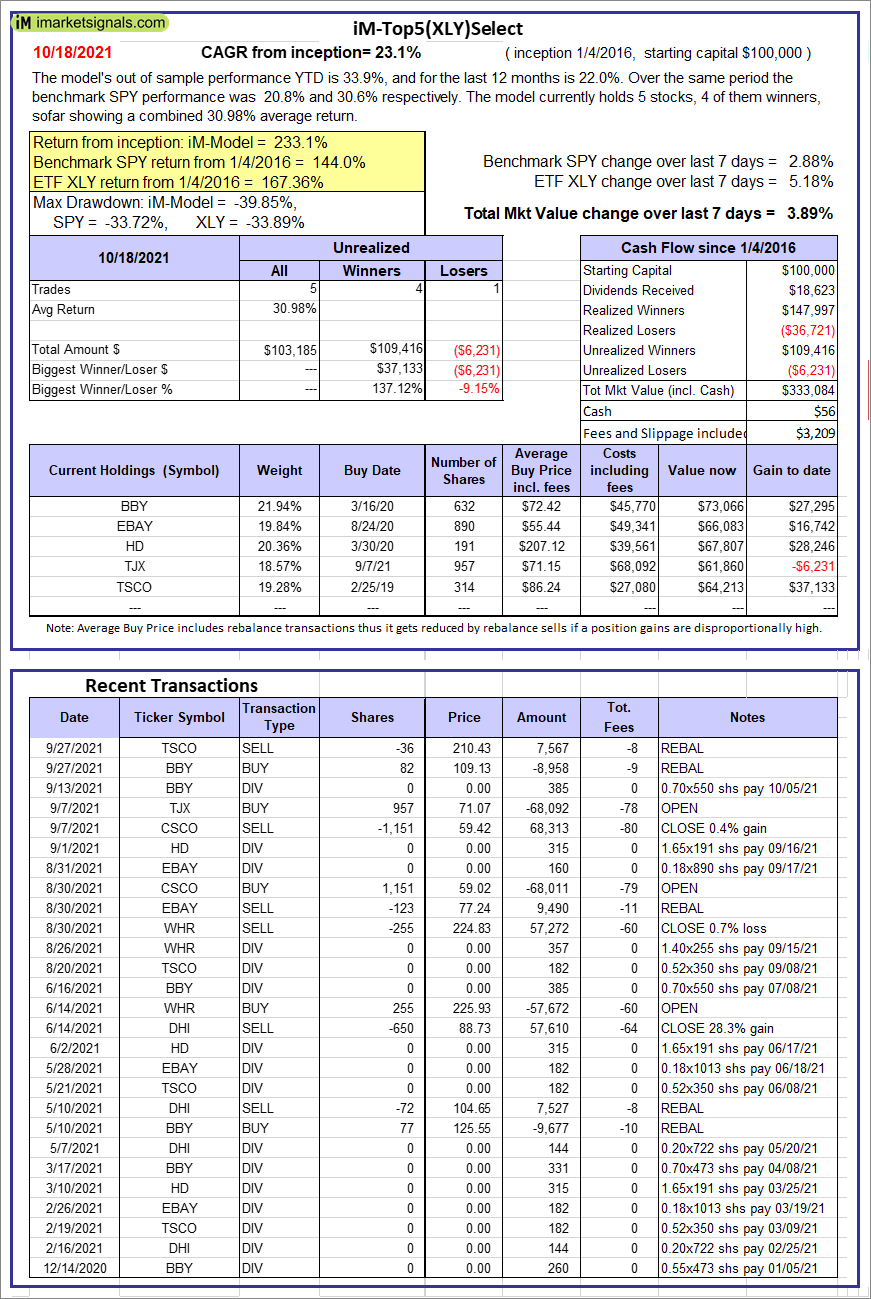 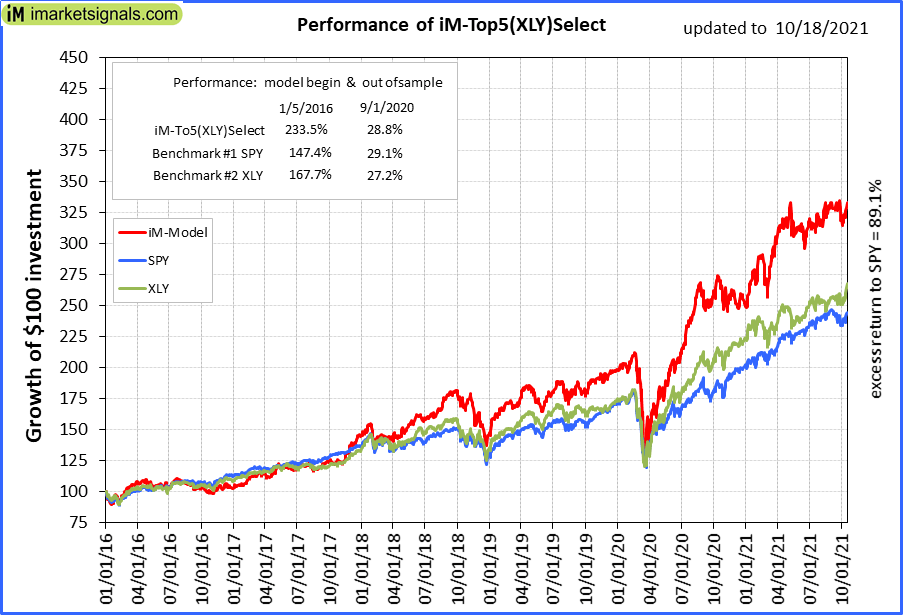 |
iM-Top5(XLY)Select: Since inception, on 1/5/2016, the model gained 233.08% while the benchmark SPY gained 143.95% over the same period. Over the previous week the market value of iM-Top5(XLY)Select gained 3.89% at a time when SPY gained 2.88%. A starting capital of $100,000 at inception on 1/5/2016 would have grown to $333,084 which includes $56 cash and excludes $3,209 spent on fees and slippage. |
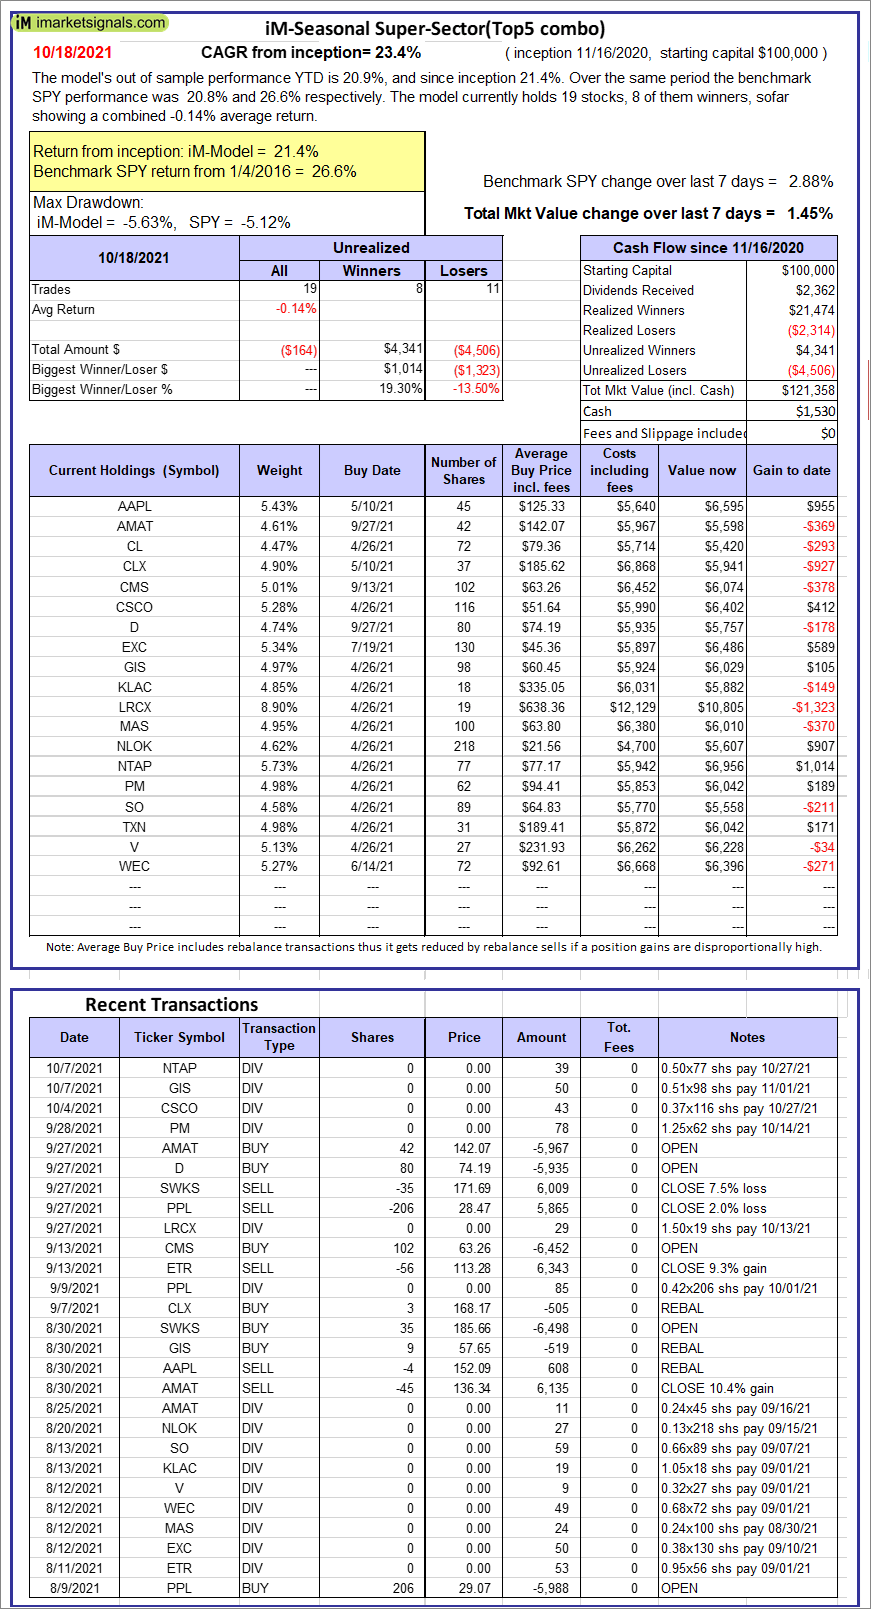 |
iM-Seasonal Super-Sectors (Top5 combo) : Since inception, on 11/17/2020, the model gained 21.36% while the benchmark SPY gained 26.64% over the same period. Over the previous week the market value of iM-Seasonal Super-Sectors (Top5 combo) gained 1.45% at a time when SPY gained 2.88%. A starting capital of $100,000 at inception on 11/17/2020 would have grown to $121,358 which includes $1,530 cash and excludes $00 spent on fees and slippage. |
 |
iM-Dividend Growth Portfolio: The model’s out of sample performance YTD is 19.9%, and for the last 12 months is 31.5%. Over the same period the benchmark SPY performance was 20.8% and 30.6% respectively. Over the previous week the market value of the iM-Dividend Growth Portfolio gained 1.86% at a time when SPY gained 2.88%. A starting capital of $100,000 at inception on 6/30/2016 would have grown to $406,055 which includes $2,696 cash and excludes $7,008 spent on fees and slippage. |
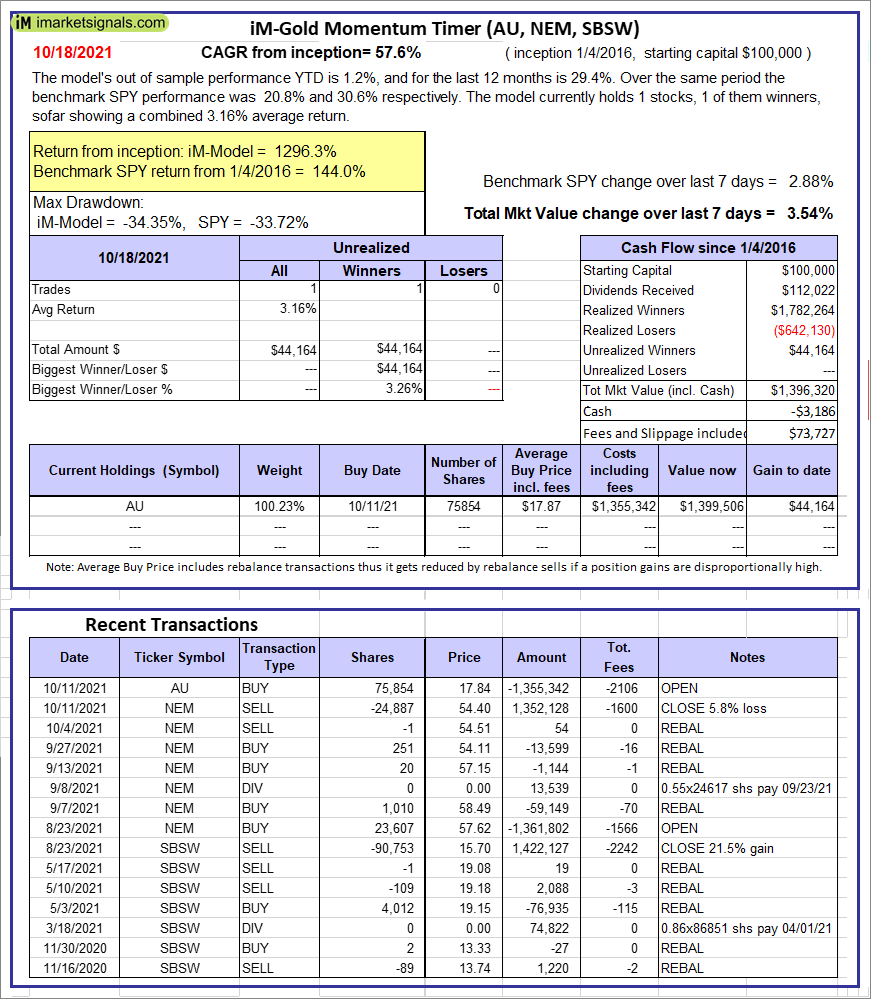 |
iM-Gold Momentum Timer (AU, NEM, SBSW): The model’s out of sample performance YTD is 1.2%, and for the last 12 months is 29.4%. Over the same period the benchmark SPY performance was 20.8% and 30.6% respectively. Over the previous week the market value of iM-Gold Momentum Timer (AU, NEM, SBSW) gained 3.54% at a time when SPY gained 2.88%. A starting capital of $100,000 at inception on 6/30/2016 would have grown to -$3,186 which includes $73,727 cash and excludes Gain to date spent on fees and slippage. |
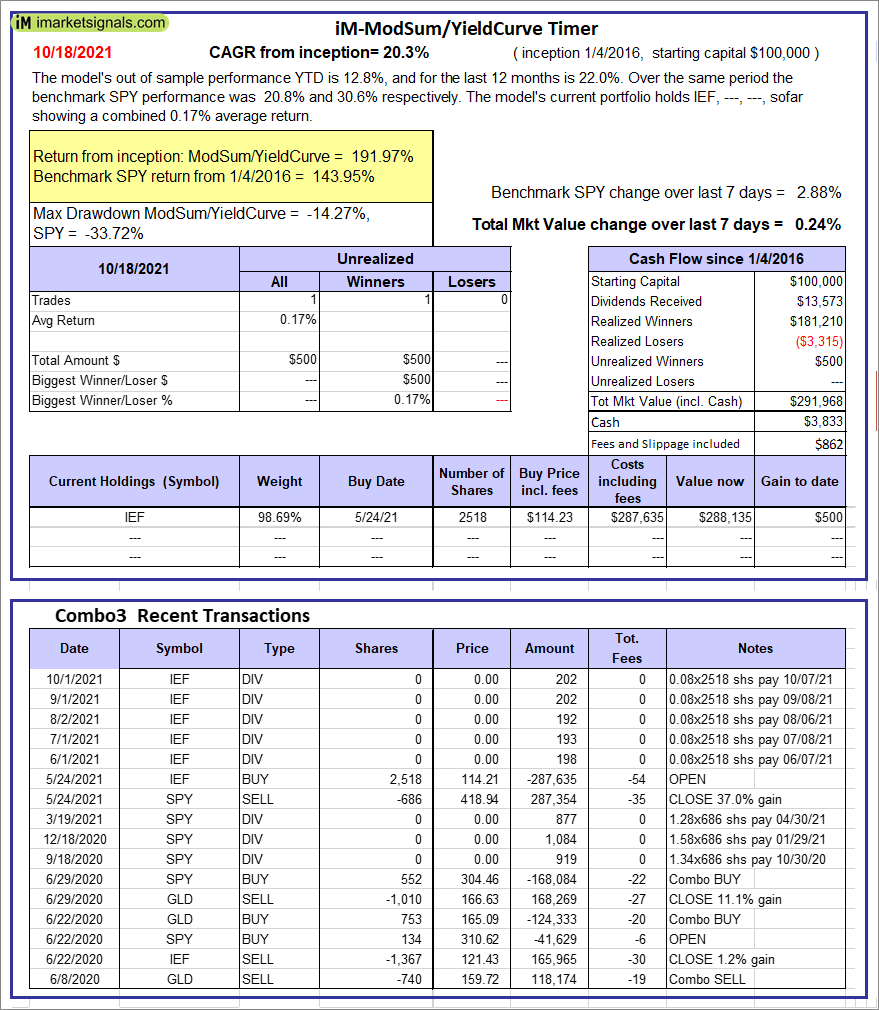 |
iM-ModSum/YieldCurve Timer: The model’s out of sample performance YTD is 12.8%, and for the last 12 months is 22.0%. Over the same period the benchmark SPY performance was 20.8% and 30.6% respectively. Over the previous week the market value of iM-PortSum/YieldCurve Timer gained 0.24% at a time when SPY gained 2.88%. A starting capital of $100,000 at inception on 1/1/2016 would have grown to $291,968 which includes $3,833 cash and excludes $862 spent on fees and slippage. |
 |
iM-Best(SPY-SH).R1: The model’s out of sample performance YTD is 20.6%, and for the last 12 months is 30.1%. Over the same period the benchmark SPY performance was 20.8% and 30.6% respectively. Over the previous week the market value of Best(SPY-SH) gained 2.84% at a time when SPY gained 2.88%. A starting capital of $100,000 at inception on 1/2/2009 would have grown to $798,948 which includes $10,552 cash and excludes $25,118 spent on fees and slippage. |
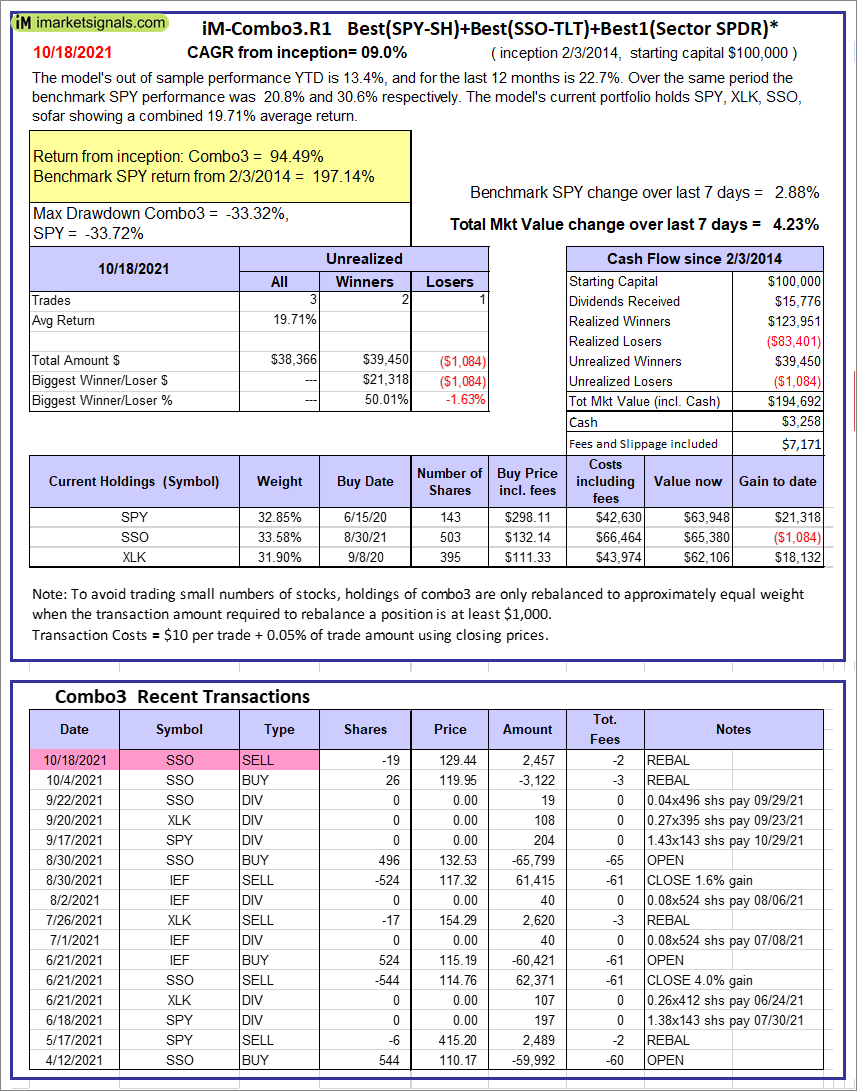 |
iM-Combo3.R1: The model’s out of sample performance YTD is 13.4%, and for the last 12 months is 22.7%. Over the same period the benchmark SPY performance was 20.8% and 30.6% respectively. Over the previous week the market value of iM-Combo3.R1 gained 4.23% at a time when SPY gained 2.88%. A starting capital of $100,000 at inception on 2/3/2014 would have grown to $194,692 which includes $3,258 cash and excludes $7,171 spent on fees and slippage. |
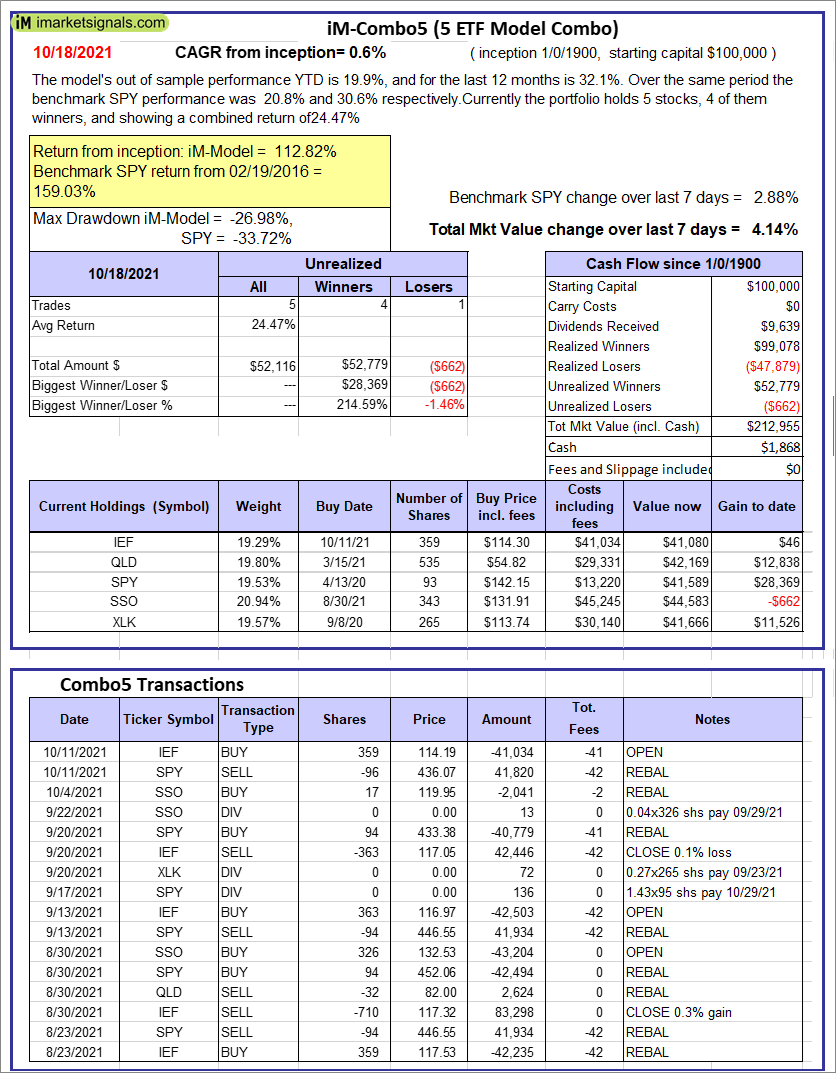 |
iM-Combo5: The model’s out of sample performance YTD is 19.9%, and for the last 12 months is 32.1%. Over the same period the benchmark SPY performance was 20.8% and 30.6% respectively. Over the previous week the market value of iM-Combo5 gained 4.14% at a time when SPY gained 2.88%. A starting capital of $100,000 at inception on 2/22/2016 would have grown to $212,955 which includes $1,868 cash and excludes $0 spent on fees and slippage. |
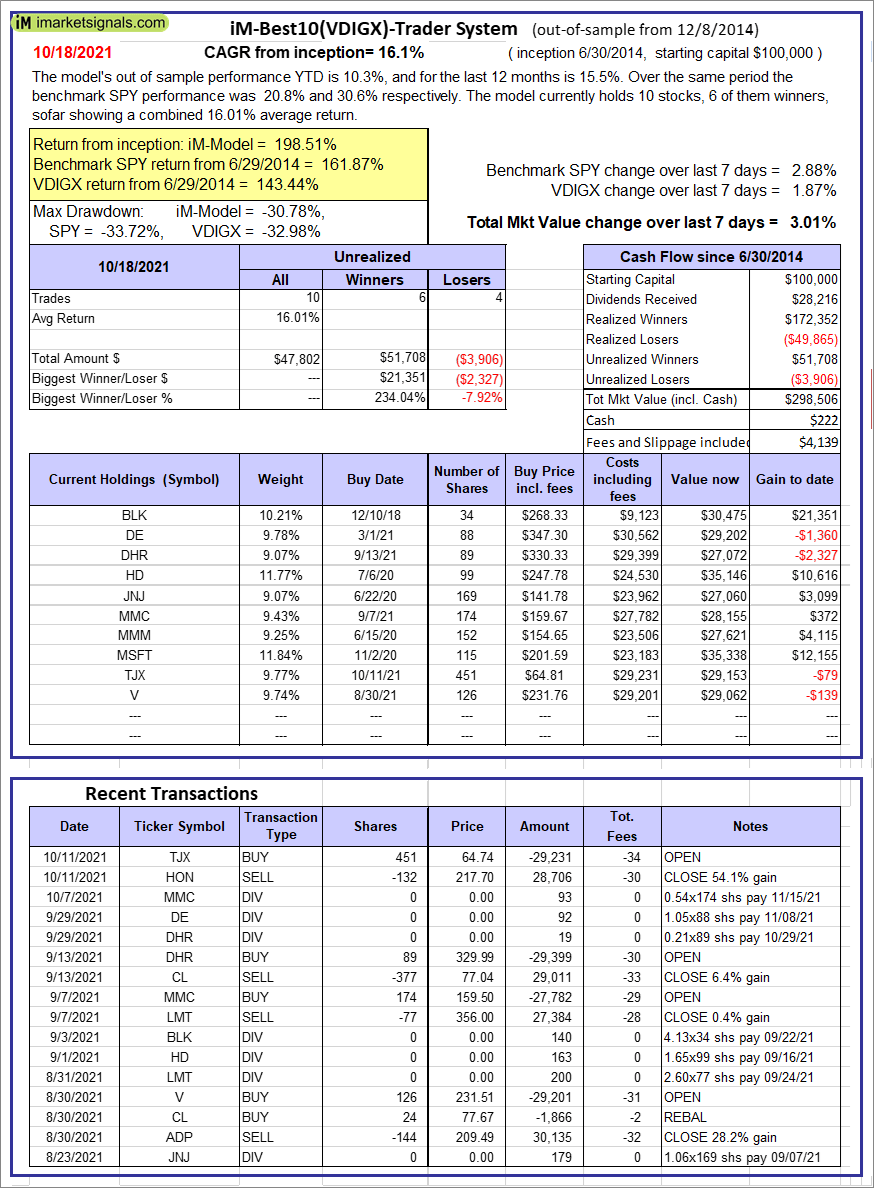 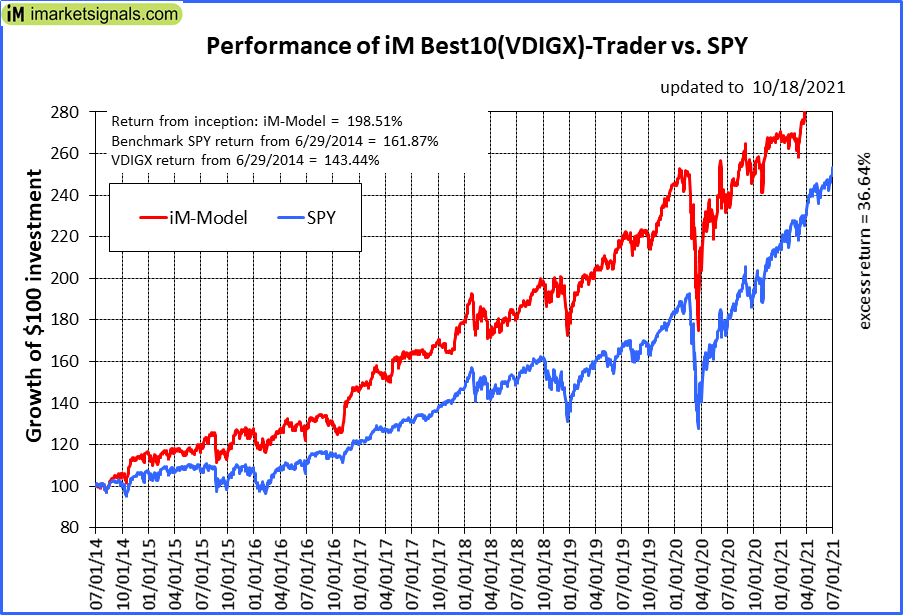 |
iM-Best10(VDIGX)-Trader: The model’s out of sample performance YTD is 10.3%, and for the last 12 months is 15.5%. Over the same period the benchmark SPY performance was 20.8% and 30.6% respectively. Since inception, on 7/1/2014, the model gained 198.51% while the benchmark SPY gained 161.87% and VDIGX gained 143.44% over the same period. Over the previous week the market value of iM-Best10(VDIGX) gained 3.01% at a time when SPY gained 2.88%. A starting capital of $100,000 at inception on 7/1/2014 would have grown to $298,506 which includes $222 cash and excludes $4,139 spent on fees and slippage. |
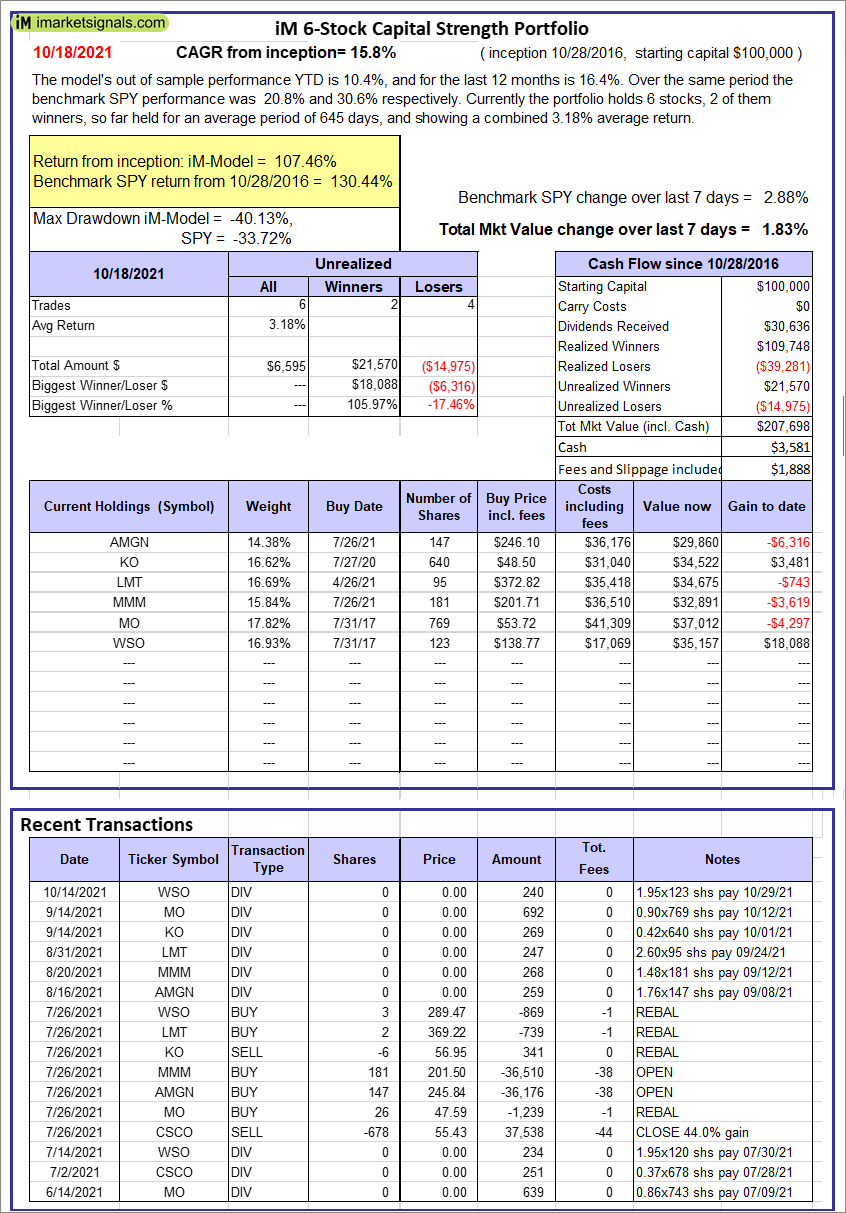 |
iM 6-Stock Capital Strength Portfolio: The model’s out of sample performance YTD is 10.4%, and for the last 12 months is 16.4%. Over the same period the benchmark SPY performance was 20.8% and 30.6% respectively. Over the previous week the market value of the iM 6-Stock Capital Strength Portfolio gained 1.83% at a time when SPY gained 2.88%. A starting capital of $100,000 at inception on 10/28/2016 would have grown to $207,698 which includes $3,581 cash and excludes $1,888 spent on fees and slippage. |
 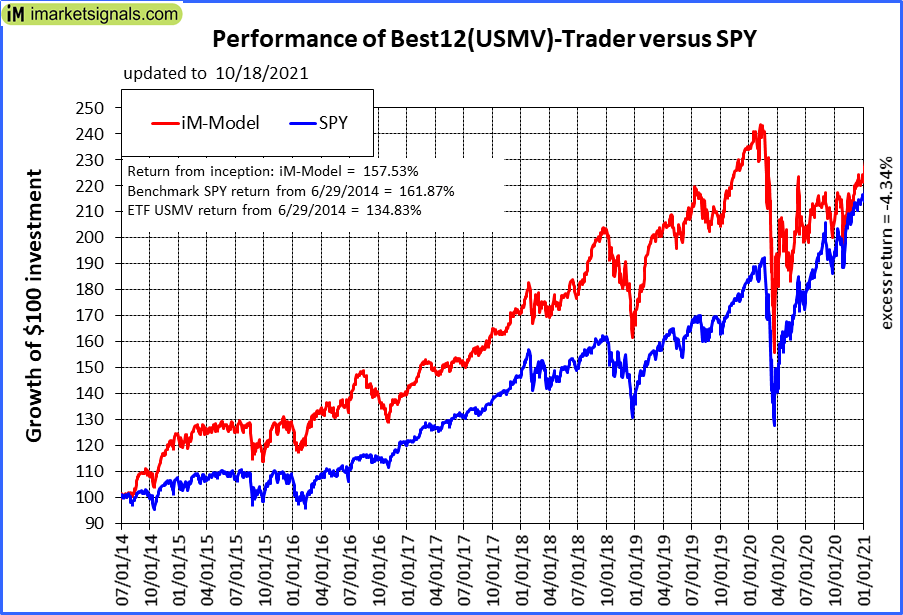 |
iM-Best12(USMV)-Trader: The model’s out of sample performance YTD is 14.8%, and for the last 12 months is 19.4%. Over the same period the benchmark SPY performance was 20.8% and 30.6% respectively. Since inception, on 6/30/2014, the model gained 157.53% while the benchmark SPY gained 161.87% and the ETF USMV gained 134.83% over the same period. Over the previous week the market value of iM-Best12(USMV)-Trader gained 2.12% at a time when SPY gained 2.88%. A starting capital of $100,000 at inception on 6/30/2014 would have grown to $257,528 which includes $1,782 cash and excludes $7,357 spent on fees and slippage. |
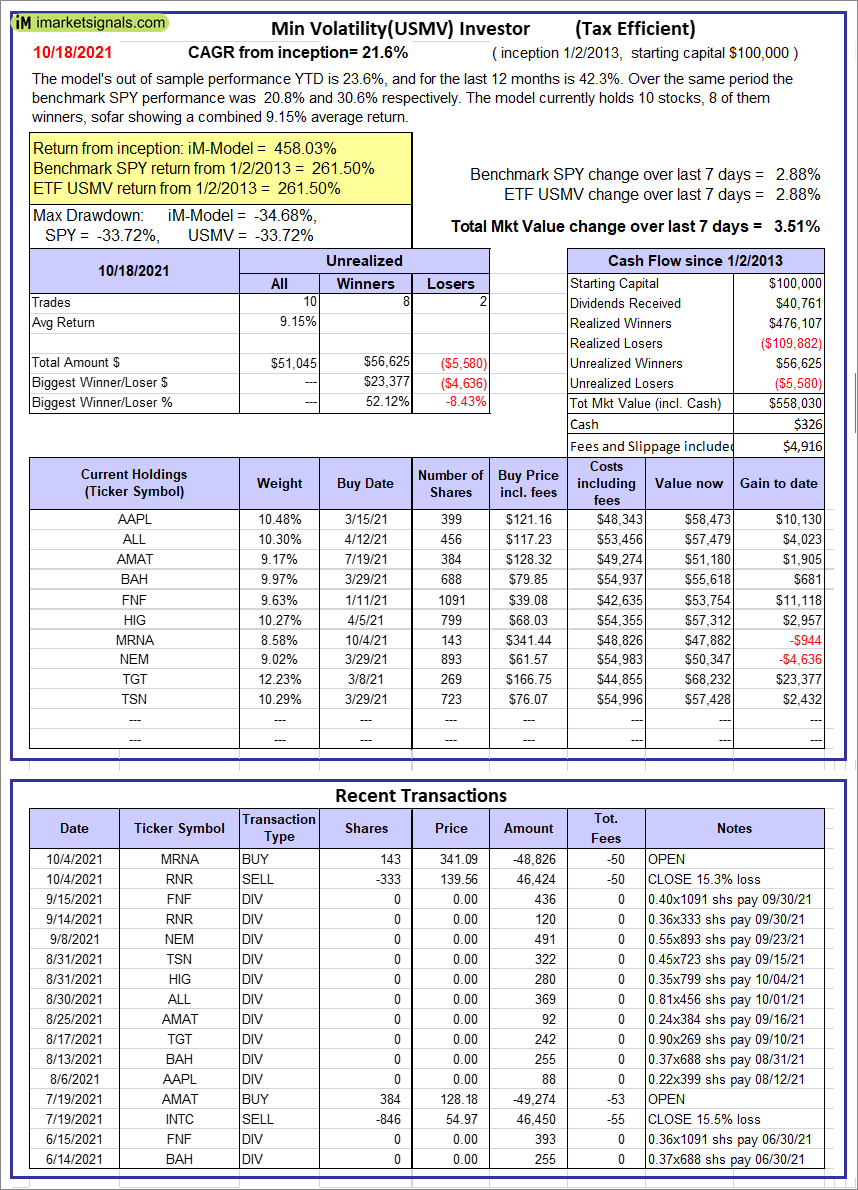 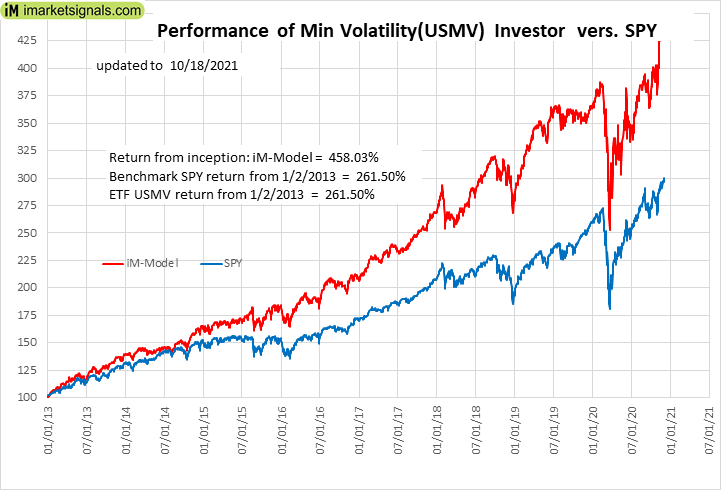 |
iM-Min Volatility(USMV) Investor (Tax Efficient): The model’s out of sample performance YTD is 23.6%, and for the last 12 months is 42.3%. Over the same period the benchmark SPY performance was 20.8% and 30.6% respectively. Since inception, on 1/3/2013, the model gained 458.03% while the benchmark SPY gained 261.50% and the ETF USMV gained 261.50% over the same period. Over the previous week the market value of iM-Best12(USMV)Q1 gained 3.51% at a time when SPY gained 2.88%. A starting capital of $100,000 at inception on 1/3/2013 would have grown to $558,030 which includes $326 cash and excludes $4,916 spent on fees and slippage. |
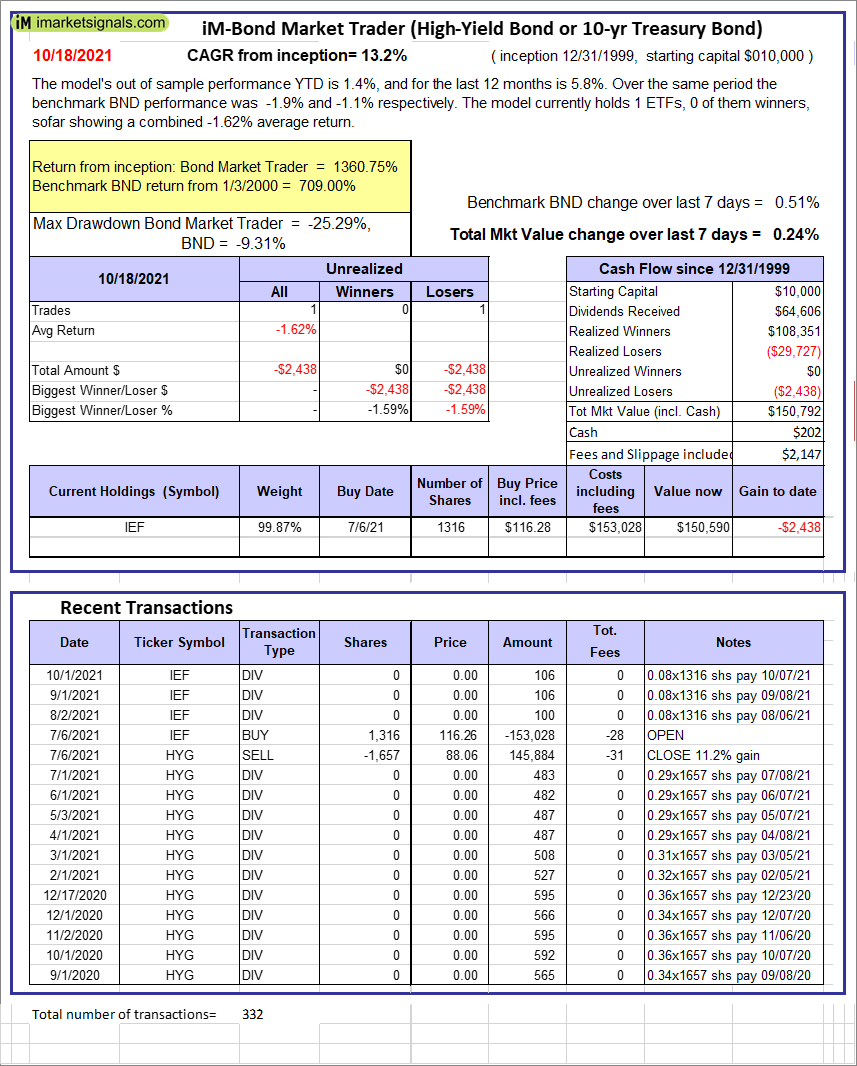 |
iM-Bond Market Trader (High-Yield Bond or 10-yr Treasury Bond): The model’s out of sample performance YTD is 1.4%, and for the last 12 months is 5.8%. Over the same period the benchmark BND performance was -1.9% and -1.1% respectively. Over the previous week the market value of the iM-Bond Market Trader (High-Yield Bond or 10-yr Treasury Bond) gained 0.24% at a time when BND gained 0.51%. A starting capital of $10,000 at inception on 1/3/2000 would have grown to $150,792 which includes $202 cash and excludes $2,147 spent on fees and slippage. |
|
|
iM-ModSum/YieldCurve Timer: The model’s out of sample performance YTD is 12.8%, and for the last 12 months is 22.0%. Over the same period the benchmark SPY performance was 20.8% and 30.6% respectively. Over the previous week the market value of iM-PortSum/YieldCurve Timer gained 0.24% at a time when SPY gained 2.88%. A starting capital of $100,000 at inception on 1/1/2016 would have grown to $291,968 which includes $3,833 cash and excludes $862 spent on fees and slippage. |
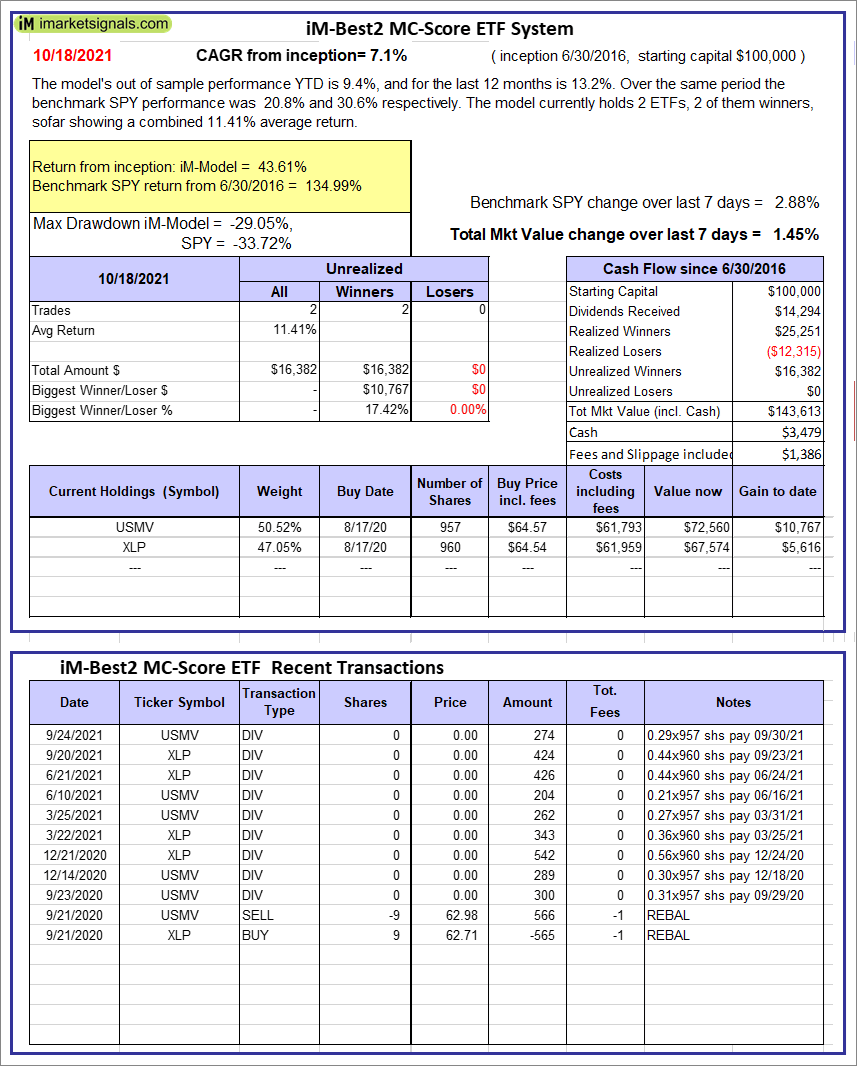 |
iM-Best2 MC-Score ETF System: The model’s out of sample performance YTD is 9.4%, and for the last 12 months is 13.2%. Over the same period the benchmark SPY performance was 20.8% and 30.6% respectively. Over the previous week the market value of the iM-Best2 MC-Score ETF System gained 1.45% at a time when SPY gained 2.88%. A starting capital of $100,000 at inception on 6/30/2016 would have grown to $143,613 which includes $3,479 cash and excludes $1,386 spent on fees and slippage. |
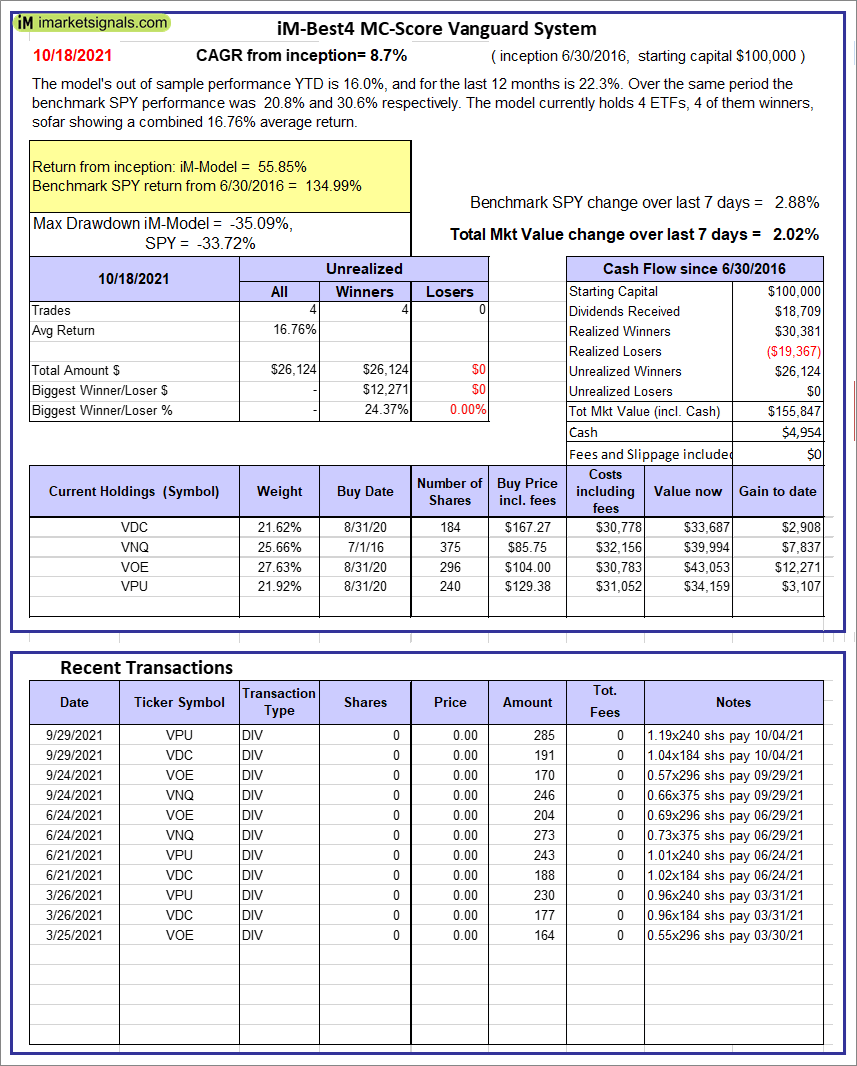 |
iM-Best4 MC-Score Vanguard System: The model’s out of sample performance YTD is 16.0%, and for the last 12 months is 22.3%. Over the same period the benchmark SPY performance was 20.8% and 30.6% respectively. Over the previous week the market value of the iM-Best4 MC-Score Vanguard System gained 2.02% at a time when SPY gained 2.88%. A starting capital of $100,000 at inception on 6/30/2016 would have grown to $155,847 which includes $4,954 cash and excludes $00 spent on fees and slippage. |
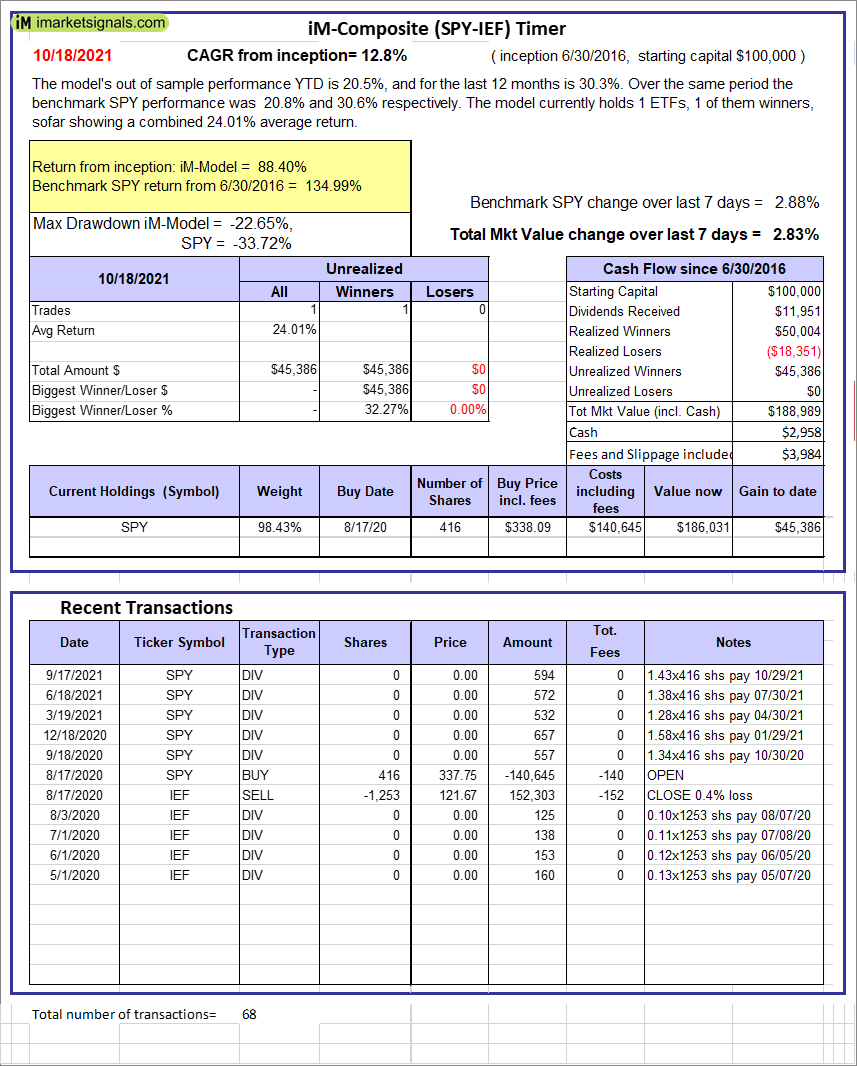 |
iM-Composite (SPY-IEF) Timer: The model’s out of sample performance YTD is 20.5%, and for the last 12 months is 30.3%. Over the same period the benchmark SPY performance was 20.8% and 30.6% respectively. Over the previous week the market value of the iM-Composite (SPY-IEF) Timer gained 2.83% at a time when SPY gained 2.88%. A starting capital of $100,000 at inception on 6/30/2016 would have grown to $188,989 which includes $2,958 cash and excludes $3,984 spent on fees and slippage. |
 |
iM-Composite(Gold-Stocks-Bond) Timer: The model’s out of sample performance YTD is -0.9%, and for the last 12 months is 6.0%. Over the same period the benchmark SPY performance was 20.8% and 30.6% respectively. Over the previous week the market value of the iM-Composite(Gold-Stocks-Bond) Timer gained 3.52% at a time when SPY gained 2.88%. A starting capital of $100,000 at inception on 6/30/2016 would have grown to $164,717 which includes $475 cash and excludes $7,877 spent on fees and slippage. |
iM-Best Reports – 10/18/21
Posted in pmp SPY-SH
Leave a Reply
You must be logged in to post a comment.