
- This model only holds fixed income asset class ETFs, never equity. It significantly out-performs the S&P 500 ETF (SPY) over longer periods by strategically switching holdings for risk-on and risk-off situations.
- It uses three previously published market timing algorithms, the ModSum Timer, the YieldCurve Timer, and the Cyclically Adjusted Risk Premium (CARP) to define risk-on, risk-off, and hedging periods.
- During risk-on periods, as indicated by the ModSum Timer and the CARP, the model holds the SPDR Bloomberg Barclays Convertible Securities ETF (CWB).
- During risk-off periods the model switches to iShares 20+ Year Treasury Bond ETF (TLT).
- Near, or during recession periods, as indicated by the YieldCurve Timer, the model is hedged with the iShares 7-10 Year Treasury Bond ETF (IEF), irrespective of the risk situation.
The strategy described here demonstrates that contrary to the accepted believe investing in fixed income can produce superior returns to equity investments. This model uses three previously published market timing algorithms to define risk-on, risk-off, and hedging periods.
- Risk-on periods are defined by either the Cyclically Adjusted Risk Premium (CARP) indication risk-on or when the ModSum Timer is invested in (SPY), otherwise it is a risk-off period.
- Hedge-on periods are defined by our YieldCurve Timer when it is invested in (IEF).
The iM-Fixed Income Trader is modeled using following ETFs:
- SPDR Bloomberg Barclays Convertible Securities ETF (CWB)
- iShares 20+ Year Treasury Bond ETF (TLT)
- iShares 7-10 Year Treasury Bond ETF (IEF)
- iShares iBoxx $ High Yield Corporate Bond ETF (HYG) prior to the inception of CWB
The model trading rules are defined in the following table:
| Risk-on | Risk-off | |
| Hedge-off | 100% CWB | 100% TLT |
| Hedge-on | 50% CWB 50% IEF |
50% TLT 50% IEF |
Performance of the Fixed Income Trader
The model was back-tested on the on-line simulation platform Portfolio123 which provides historical economic and financial data from January 1999 onward, as well as extended price data for many ETFs before their inception dates. Transaction costs of 0.05% of each trade amount were taken into account to determine the performance.
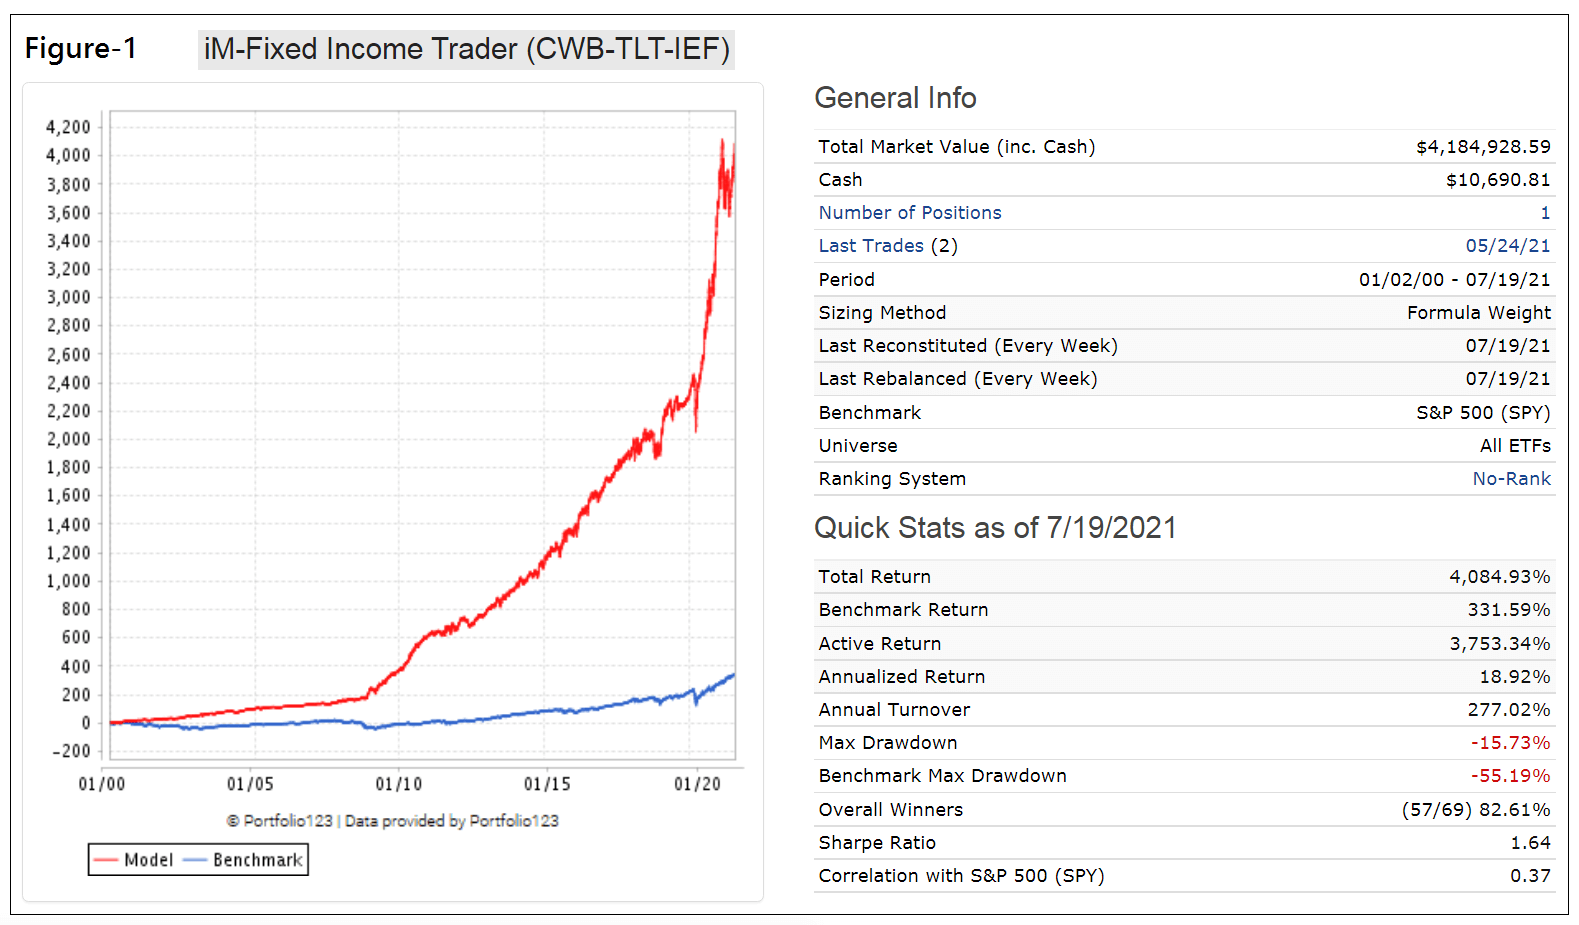
The backtest shows that for the period 1/2/2000 to 7/19/2021 (Figure-1) the annualized return would have been 18.9% with a maximum drawdown of -16%, versus SPY’s annualized return of 7.0% and maximum drawdown of -55%. The current trailing dividend yield for the model is 2.05%.
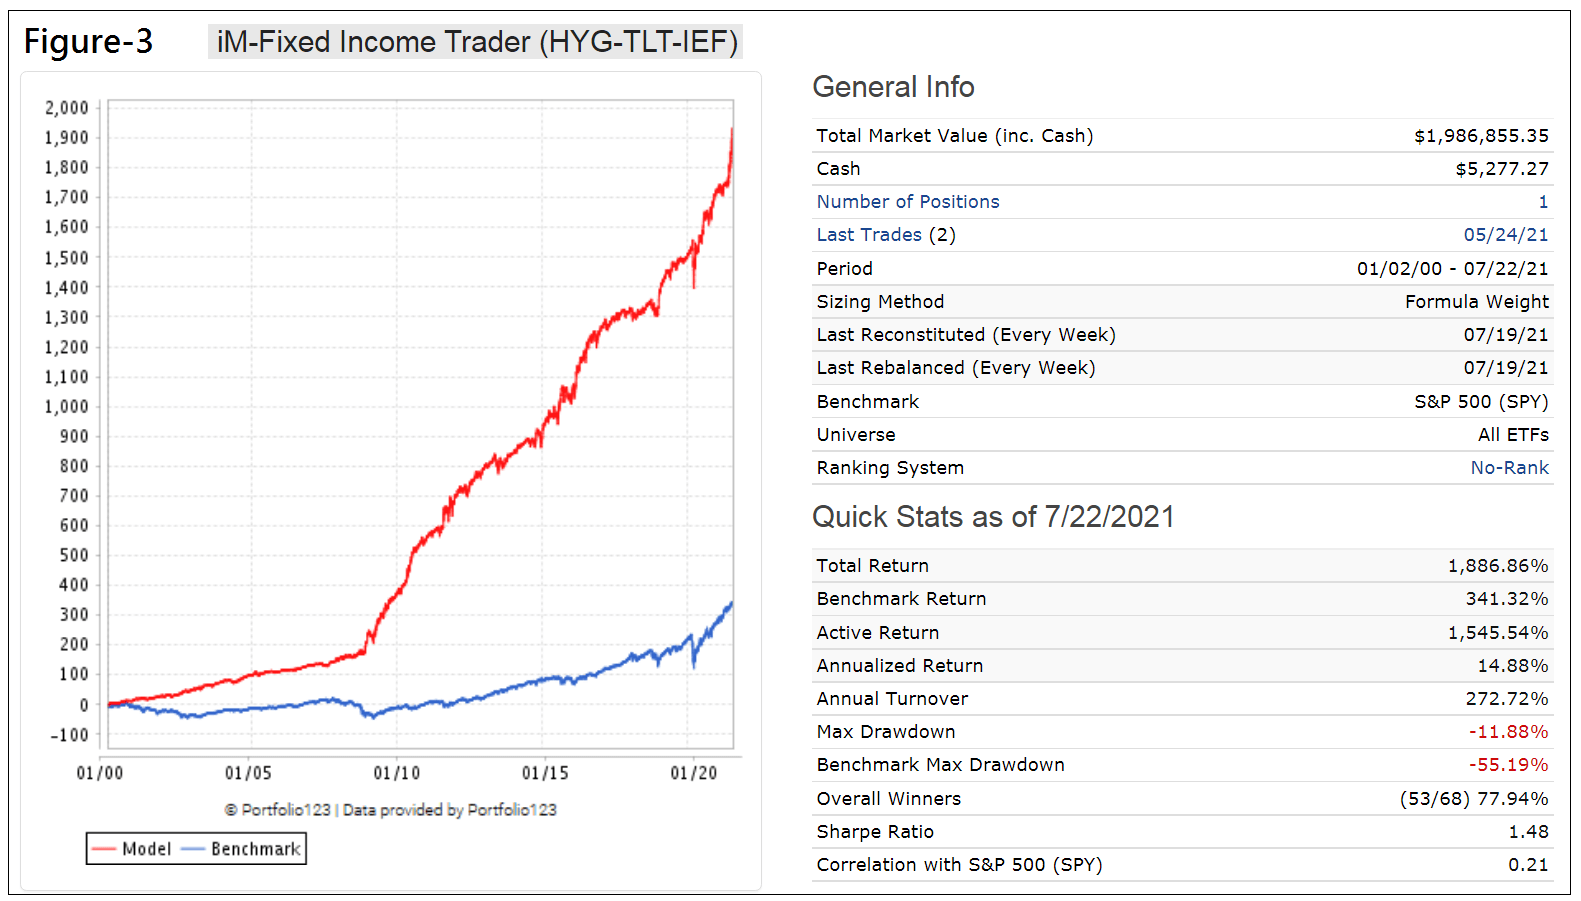
The performance of a model which excludes CWB and uses HYG instead is shown in Figure-3 in the appendix. It produced an annualized return of 14.9% with a maximum drawdown of -12% and would only have had positive returns for each calendar year.
Current holdings are for risk-off: 100% TLT since 5/24/2021, showing a gain of 9.6% to 7/19/2021.
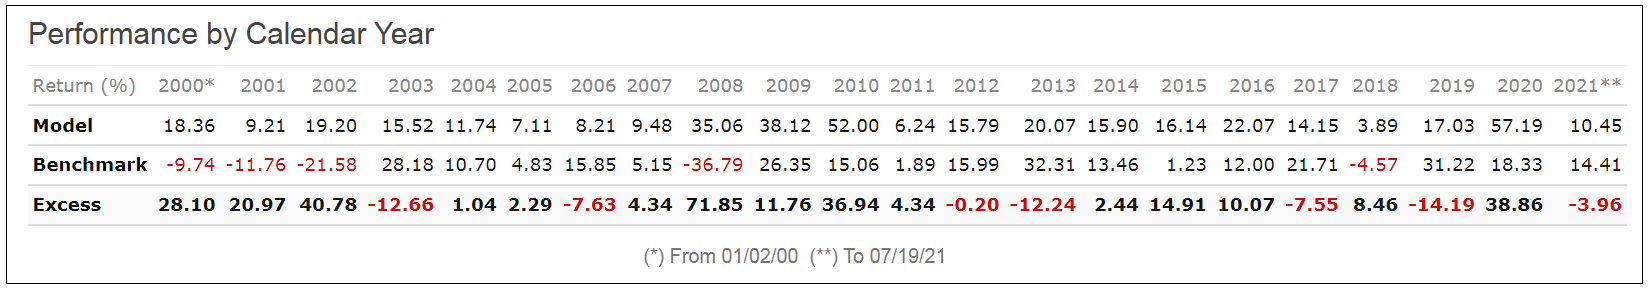
The performance for each calendar year is shown in the table below. This model would only have had positive returns for each year.
Investment Risk
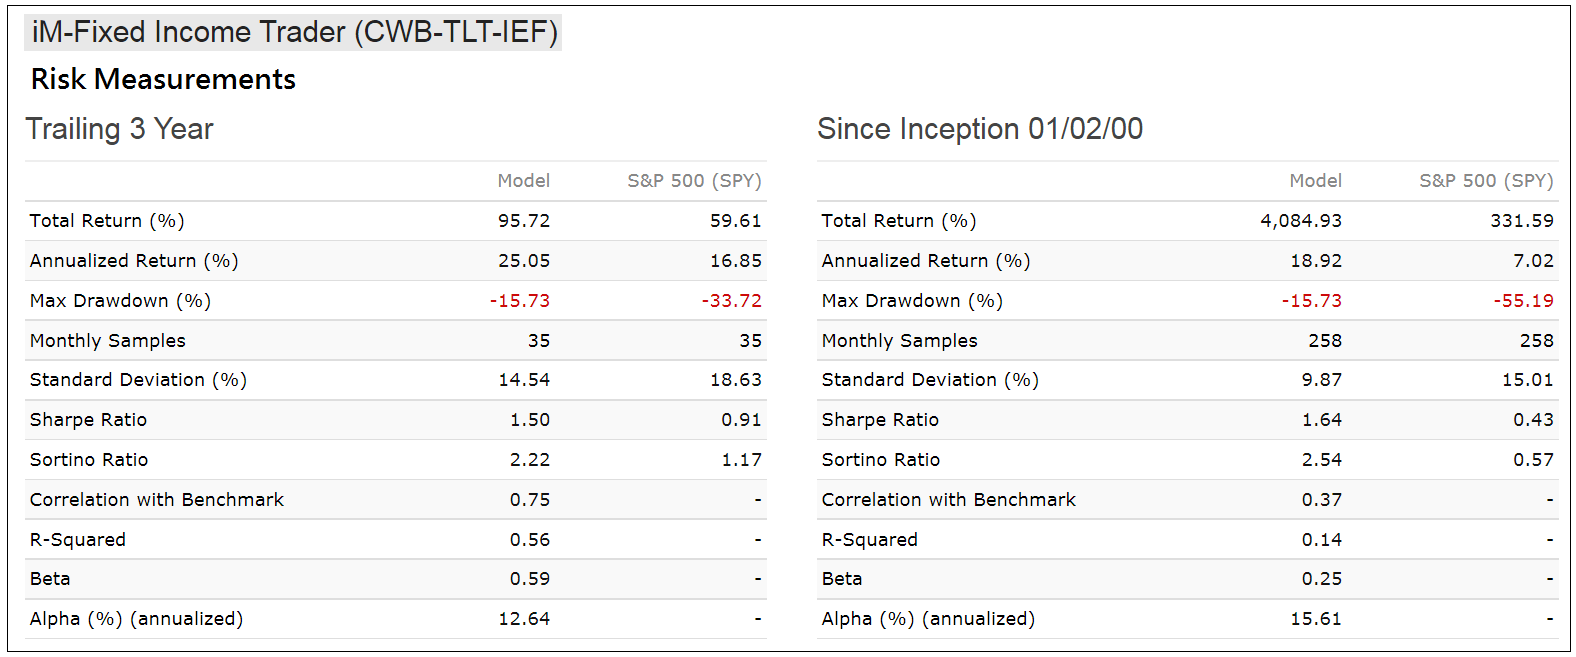
In the table below are the risk statistics from 2000 to 2021 for the model relative to the benchmark S&P 500 (SPY). It is evident from the risk measures that the trading strategy carries less risk than investing in SPY over the longer term. The much lower Standard Deviation points toward the models lower volatility and the positive alpha indicates that this strategy would have outperformed its risk-adjusted benchmark return on average by 15.6% per year over the last 21 years, and by 12.6% over the trailing 3 year period.
Trading Information
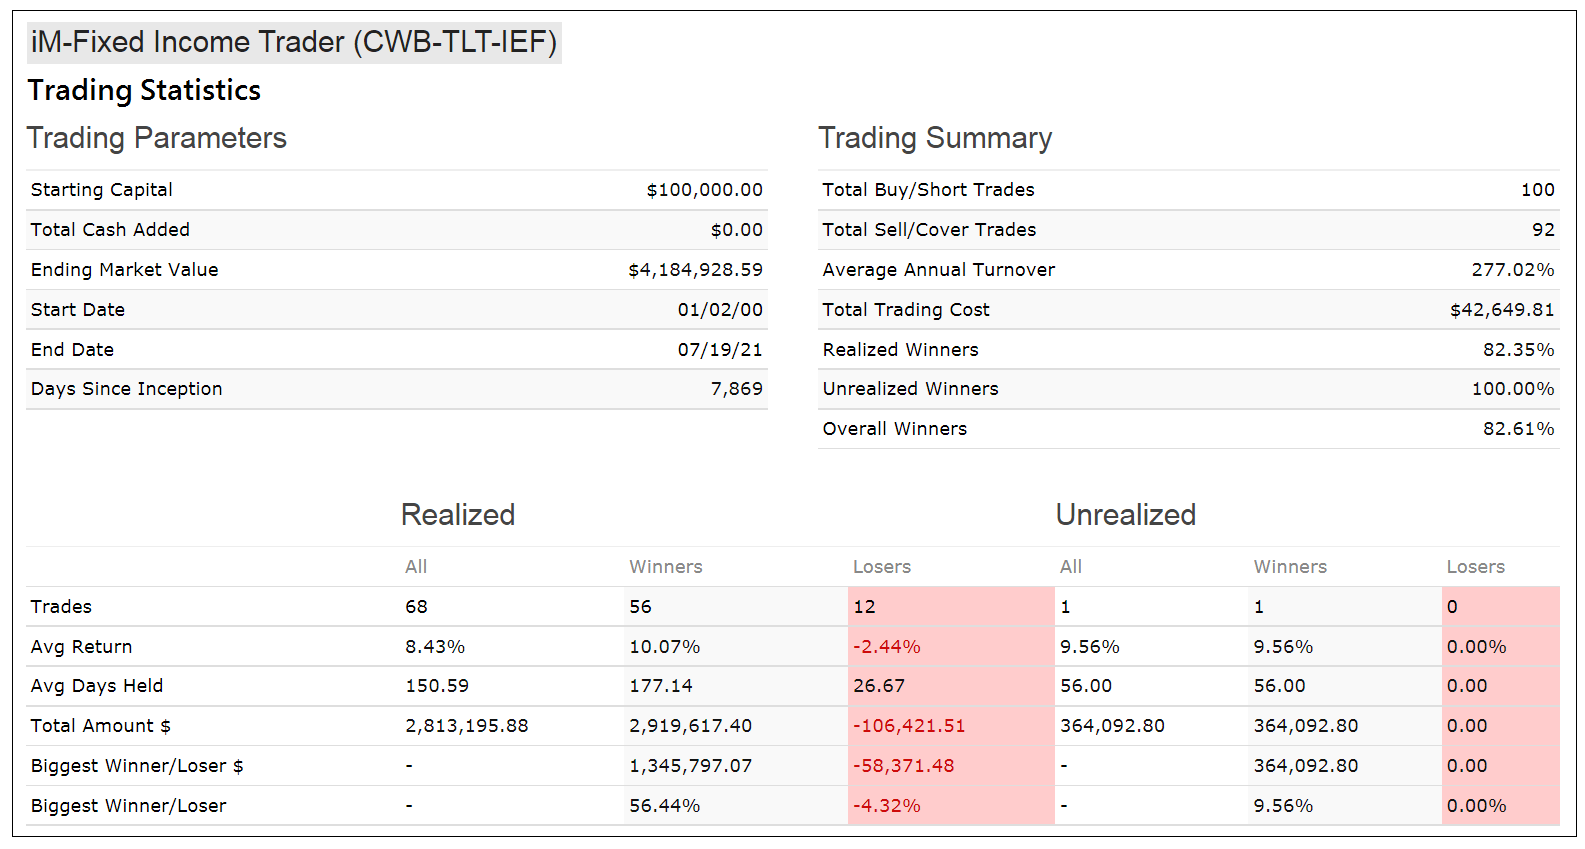
The minimum and average holding period for a position would have been 2 and 21 weeks, respectively. There were 68 completed trades of which 56 were winners. There were 12 losers, and the maximum loss would have been -4.3%. (Note that dividends are not included in these figures.)
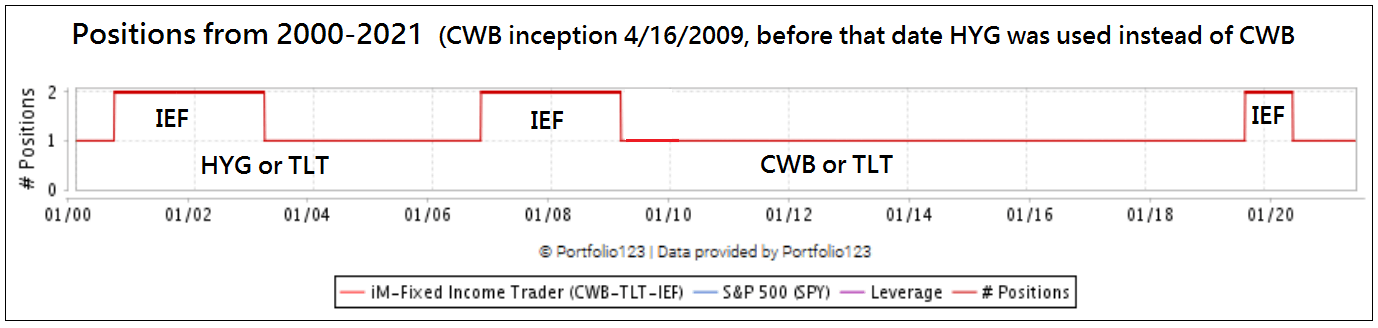
The diagram below plots the number of positions over time. During the three hedge periods the model holds two positions with IEF added.
Conclusion
From the analysis it is apparent that one can limit investments only to fixed income ETFs and beat the stock market with much less risk and minimum trading effort. Over the 21.5 year backtest period there were only 68 completed trades (about 3 trades per year).
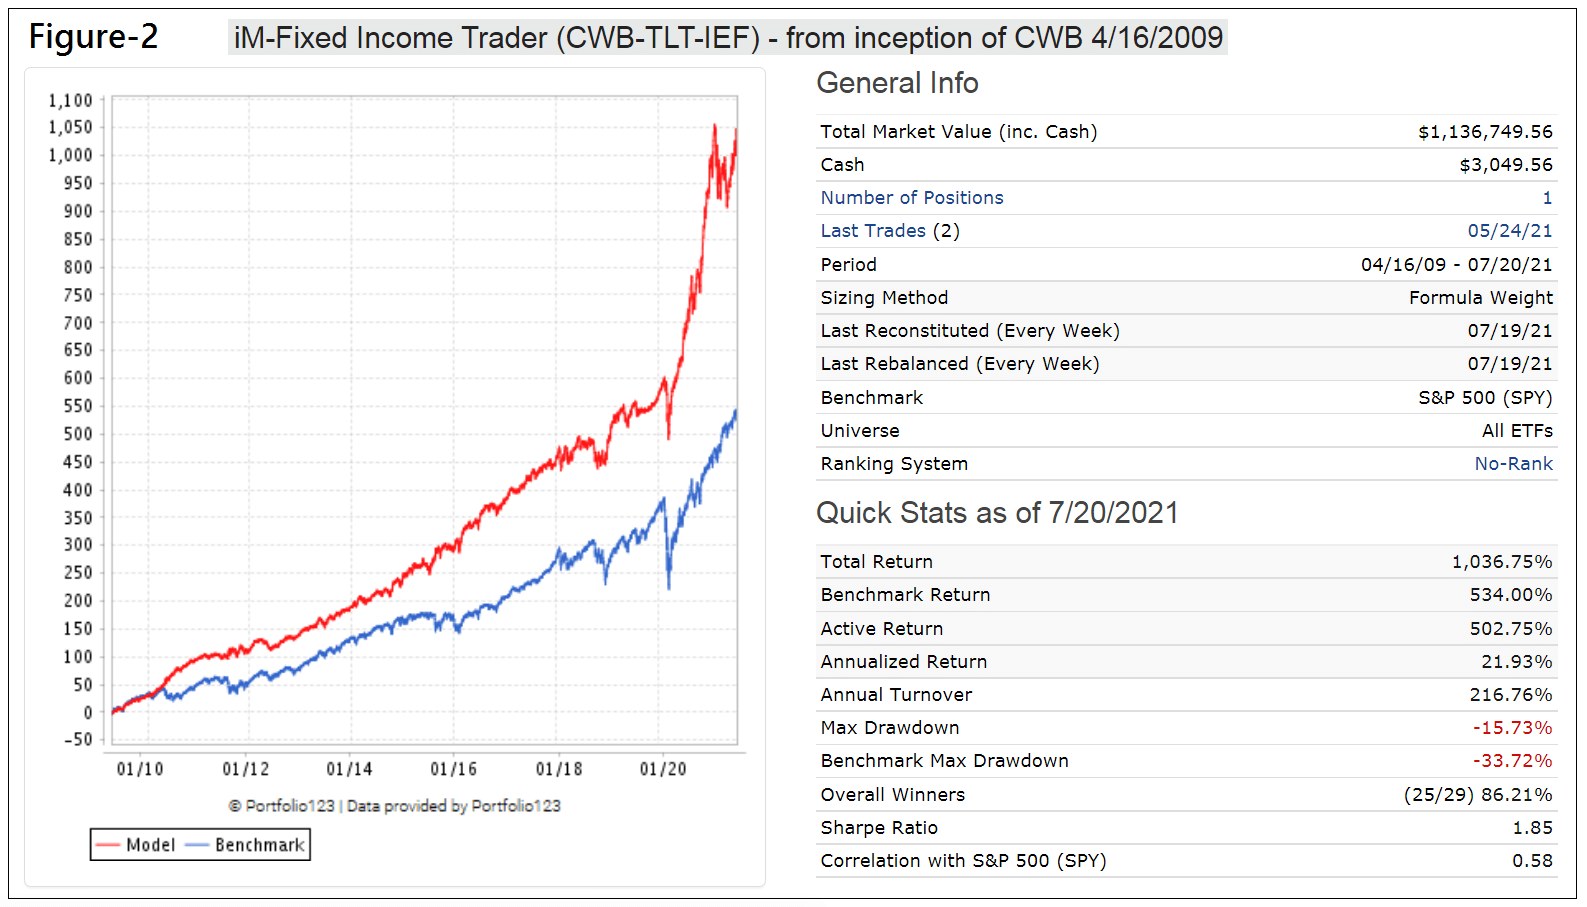
Even for the up-stock market period beginning in 2009 this strategy would have produced twice the total return of SPY with only 28 realized trades. For this period the model shows an annualized return of 21.9% (versus 16.3% for SPY) with a maximum drawdown of -16%; Figure-2 in the appendix.
At iMarketSignals we will report weekly holdings and performance of this model.
Appendix
Trading History
| Symbol | Open | Close | Days | Pct |
| TLT | 1/3/2000 | 2/22/2000 | 50 | 6.00% |
| HYG | 2/22/2000 | 6/26/2000 | 125 | 2.10% |
| TLT | 6/26/2000 | 10/2/2000 | 98 | 3.10% |
| HYG | 10/2/2000 | 11/6/2000 | 35 | -2.20% |
| TLT | 11/6/2000 | 10/22/2001 | 350 | 14.10% |
| HYG | 10/22/2001 | 12/10/2001 | 49 | 3.00% |
| TLT | 12/10/2001 | 9/3/2002 | 267 | 16.10% |
| HYG | 9/3/2002 | 11/4/2002 | 62 | -2.20% |
| TLT | 11/4/2002 | 11/18/2002 | 14 | 2.10% |
| HYG | 11/18/2002 | 12/2/2002 | 14 | 3.50% |
| IEF | 8/28/2000 | 3/10/2003 | 924 | 20.40% |
| TLT | 11/25/2002 | 3/31/2003 | 126 | 0.50% |
| HYG | 3/31/2003 | 7/28/2003 | 119 | 6.80% |
| TLT | 7/28/2003 | 8/11/2003 | 14 | -1.50% |
| HYG | 8/4/2003 | 4/5/2004 | 245 | 10.10% |
| TLT | 4/5/2004 | 4/19/2004 | 14 | -2.00% |
| HYG | 4/19/2004 | 5/10/2004 | 21 | -1.70% |
| TLT | 5/10/2004 | 5/24/2004 | 14 | 1.00% |
| HYG | 5/17/2004 | 6/7/2004 | 21 | 0.30% |
| TLT | 6/7/2004 | 7/6/2004 | 29 | 3.20% |
| HYG | 7/6/2004 | 7/19/2004 | 13 | 1.30% |
| TLT | 7/19/2004 | 8/9/2004 | 21 | 0.60% |
| HYG | 8/9/2004 | 10/18/2004 | 70 | 3.90% |
| TLT | 10/18/2004 | 11/1/2004 | 14 | -0.30% |
| HYG | 10/25/2004 | 1/10/2005 | 77 | 1.70% |
| TLT | 1/10/2005 | 4/18/2005 | 98 | 2.50% |
| HYG | 4/18/2005 | 5/30/2006 | 407 | 5.10% |
| TLT | 5/30/2006 | 6/12/2006 | 13 | 1.80% |
| HYG | 6/5/2006 | 6/26/2006 | 21 | -1.60% |
| TLT | 6/26/2006 | 7/10/2006 | 14 | 1.20% |
| HYG | 7/10/2006 | 7/31/2006 | 21 | 0.20% |
| TLT | 7/31/2006 | 8/14/2006 | 14 | -0.70% |
| HYG | 8/7/2006 | 8/13/2007 | 371 | 2.80% |
| TLT | 8/13/2007 | 8/27/2007 | 14 | 2.20% |
| HYG | 8/20/2007 | 11/5/2007 | 77 | 2.80% |
| TLT | 11/5/2007 | 4/7/2008 | 154 | 4.00% |
| HYG | 4/7/2008 | 5/5/2008 | 28 | 2.10% |
| TLT | 5/5/2008 | 12/1/2008 | 210 | 19.30% |
| IEF | 10/30/2006 | 3/9/2009 | 861 | 9.80% |
| CWB | 4/20/2009 | 1/4/2010 | 259 | 25.10% |
| HYG | 3/9/2009 | 1/4/2010 | 301 | 43.50% |
| TLT | 1/4/2010 | 1/25/2010 | 21 | 1.90% |
| CWB | 1/25/2010 | 4/5/2010 | 70 | 7.00% |
| TLT | 4/5/2010 | 6/7/2010 | 63 | 12.50% |
| CWB | 6/7/2010 | 6/21/2010 | 14 | 3.30% |
| TLT | 6/14/2010 | 6/28/2010 | 14 | 2.80% |
| CWB | 6/28/2010 | 5/23/2011 | 329 | 14.20% |
| TLT | 5/23/2011 | 6/6/2011 | 14 | -0.30% |
| CWB | 5/31/2011 | 8/1/2011 | 62 | -4.00% |
| TLT | 8/1/2011 | 8/15/2011 | 14 | 5.90% |
| CWB | 8/8/2011 | 10/6/2014 | 1155 | 31.00% |
| TLT | 10/6/2014 | 10/20/2014 | 14 | 3.10% |
| CWB | 10/13/2014 | 12/22/2014 | 70 | 5.20% |
| TLT | 12/22/2014 | 1/5/2015 | 14 | 2.50% |
| CWB | 1/5/2015 | 3/16/2015 | 70 | 2.60% |
| TLT | 3/16/2015 | 4/6/2015 | 21 | 1.50% |
| CWB | 4/6/2015 | 5/18/2015 | 42 | 1.10% |
| TLT | 5/18/2015 | 6/1/2015 | 14 | 1.20% |
| CWB | 6/1/2015 | 7/6/2015 | 35 | -4.30% |
| TLT | 7/6/2015 | 8/24/2015 | 49 | 6.80% |
| CWB | 8/24/2015 | 12/7/2015 | 105 | 2.10% |
| TLT | 12/7/2015 | 2/1/2016 | 56 | 3.90% |
| CWB | 2/1/2016 | 3/27/2017 | 420 | 15.50% |
| TLT | 3/27/2017 | 4/10/2017 | 14 | -0.20% |
| CWB | 4/3/2017 | 12/10/2018 | 616 | 4.40% |
| TLT | 12/10/2018 | 12/24/2018 | 14 | 1.90% |
| IEF | 9/9/2019 | 6/29/2020 | 294 | 7.20% |
| CWB | 12/24/2018 | 5/24/2021 | 882 | 59.00% |
Disclaimer: All performance results are hypothetical and the result of backtesting over the period 2000 to 2021. Since performance is dependent on market-timing rules, the future out-of-sample performance may be significantly less if those rules are not as effective as they were during the backtest period.
Georg,
For both this latest Fixed Income ETF and your CARP offerings, I would encourage you to post the returns, both in and out of sample, in the tables displaying the 1,2,4, 13 week report and the 1,3,5,10 year. Likewise for the upcoming strategy you indicated you were working on currently.
This helps when your readers compare strategies they want to use.
Hi Georg,
I love this strategy!
Would you please be able to post the key stats if this was 50% combined with the QQQ strategy you have?
I’m hoping the combo outperforms this Bond strategy, but keeps the drawdowns to minimum
Thanks
James
50%Fixed Income Trader + 50%Top5 (QQQ) from 2000
Period 12/31/99 – 08/13/21
Benchmark S&P 500 (SPY)
Quick Stats as of 8/13/2021
Total Return 7,320.91%
Benchmark Return 352.87%
Active Return 6,968.05%
Annualized Return 22.03%
Max Drawdown -25.45%
Benchmark Max Drawdown -55.19%
Sharpe Ratio 1.43
Correlation with S&P 500 (SPY) 0.74
50%Fixed Income Trader + 50%Top5 (QQQ) from 2016
Period 12/31/15 – 08/13/21
Quick Stats as of 8/13/2021
Total Return 326.25%
Benchmark Return 142.48%
Active Return 183.77%
Annualized Return 29.42%
Max Drawdown -23.64%
Benchmark Max Drawdown -33.72%
Sharpe Ratio 1.75
Correlation with S&P 500 (SPY) 0.82
Thanks Georg, this looks great! :)
Georg,
I second the motion to list this in your performance tables as well as include it in your weekly email updates regarding any changes. I am amazed how you can get such an outstanding return by just using bond ETFs.
Jimbo
Agreed with the above – still waiting for it to be included in the weekly email like you promised on SeekingAlpha?
Fascinating strategy. I’m not able to find a history of trades. Have I missed it? If not, would it be possible for you to post one? Many thanks.
This repeats my earlier comment about trading history. I’m wondering whether you can post a history of trades for this model. Try though I have, I can’t find one, nor can I find histories of your calls on the three underlying algorithms (if those were available, a subscriber might be able to make educated guesses about the trades for the model). I’d like to put the model to work, but I feel I need to see the trades first. Thanks.
The post is now amended with the trading history list.