
- The average of S&P 500 for May 2021 was 4168 (previous month 4141). This is 1718 points higher than the long-term trend value of 2450.
- The current percentage difference of S&P 500 level relative to the current long-term trend level is 70%, a value not exceeded in the recent past since August 2001.
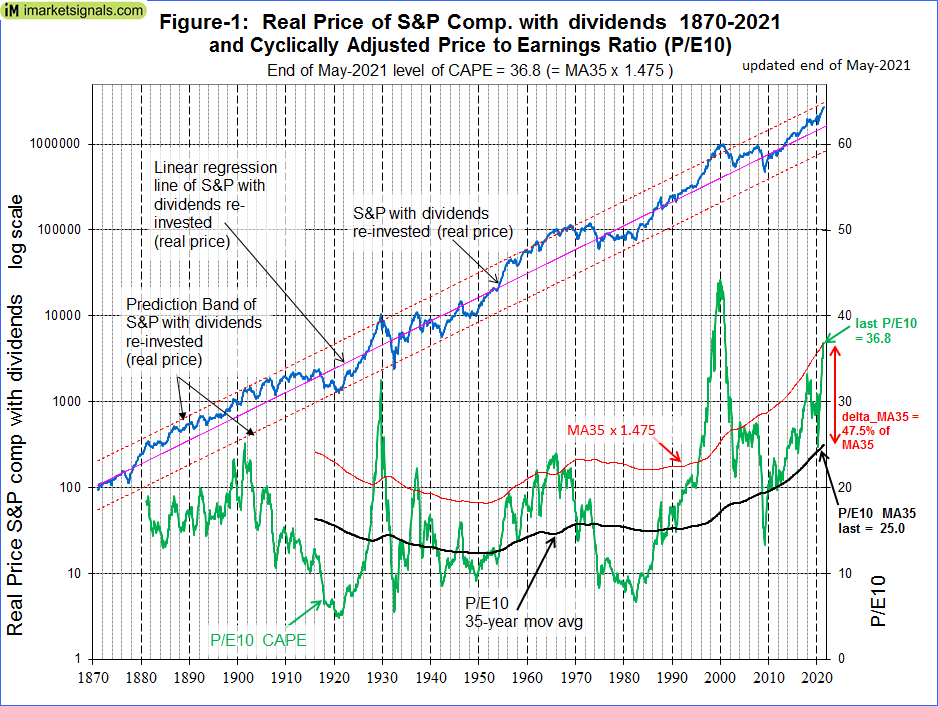
- The Shiller Cyclically Adjusted Price to Earnings Ratio (CAPE) is at a level of 36.8. That is 47.5% higher than its 35-year moving average (MA35), currently at 25.0.
- The CAPE-MA35 ratio is 1.48, forecasting a 10-year annualized real return of about 4.0%. Should the CAPE-MA35 ratio increase further, then 10-year forward returns will be even lower.
- End of May the 12-mo As Reported Earnings per share for the S&P 500 was $138.96, up from February’s $88.10. Should this trend continue then stocks may show further gains.
This is an update to our series of articles started in 2012 assessing market valuation and estimating forward stock market returns. The most recent previous update was for end of April 2021.
The projections here are partly based on Estimating Forward 10-Year Stock Market Returns using the Shiller CAPE Ratio and its 35-Year Moving Average, which is referred to as the “referenced article” further down.
What short-term stock market returns can be expected?
Nobody knows, and the best one can do is to use the historic data (which is from Shiller’s S&P series) to guide us to make estimates for the future. From the real price of the S&P-Composite with dividends re-invested (S&P-real) one finds that the best-fit line from 1871 onward is a straight line when plotted to a semi-log scale. There is no reason to believe that this long-term trend of S&P-real will be interrupted. S&P-real, updated to end of May 2021, and the best fit line together with its 95% prediction bands are shown in Figure-1. (See appendix for the equation.)
The current level of the S&P-real is 70% above the long-term trend line. A reversal to the mean trend would entail a 41% decline, possibly over a short period. But it is also possible if the upward earnings trend continues (see Figure-4 in the appendix) that S&P-real could reach the upper prediction band line. This would amount to a gain of about 20% from the current level.
Forecasting 10-year stock market returns with the CAPE-MA35 Ratio
Also shown in Figure-1 are the CAPE (which is the S&P-real divided by the average of the real earnings over the preceding 10 years) and its 35-year moving average, having end of May 2021 values of 36.8 and 25.0, respectively.
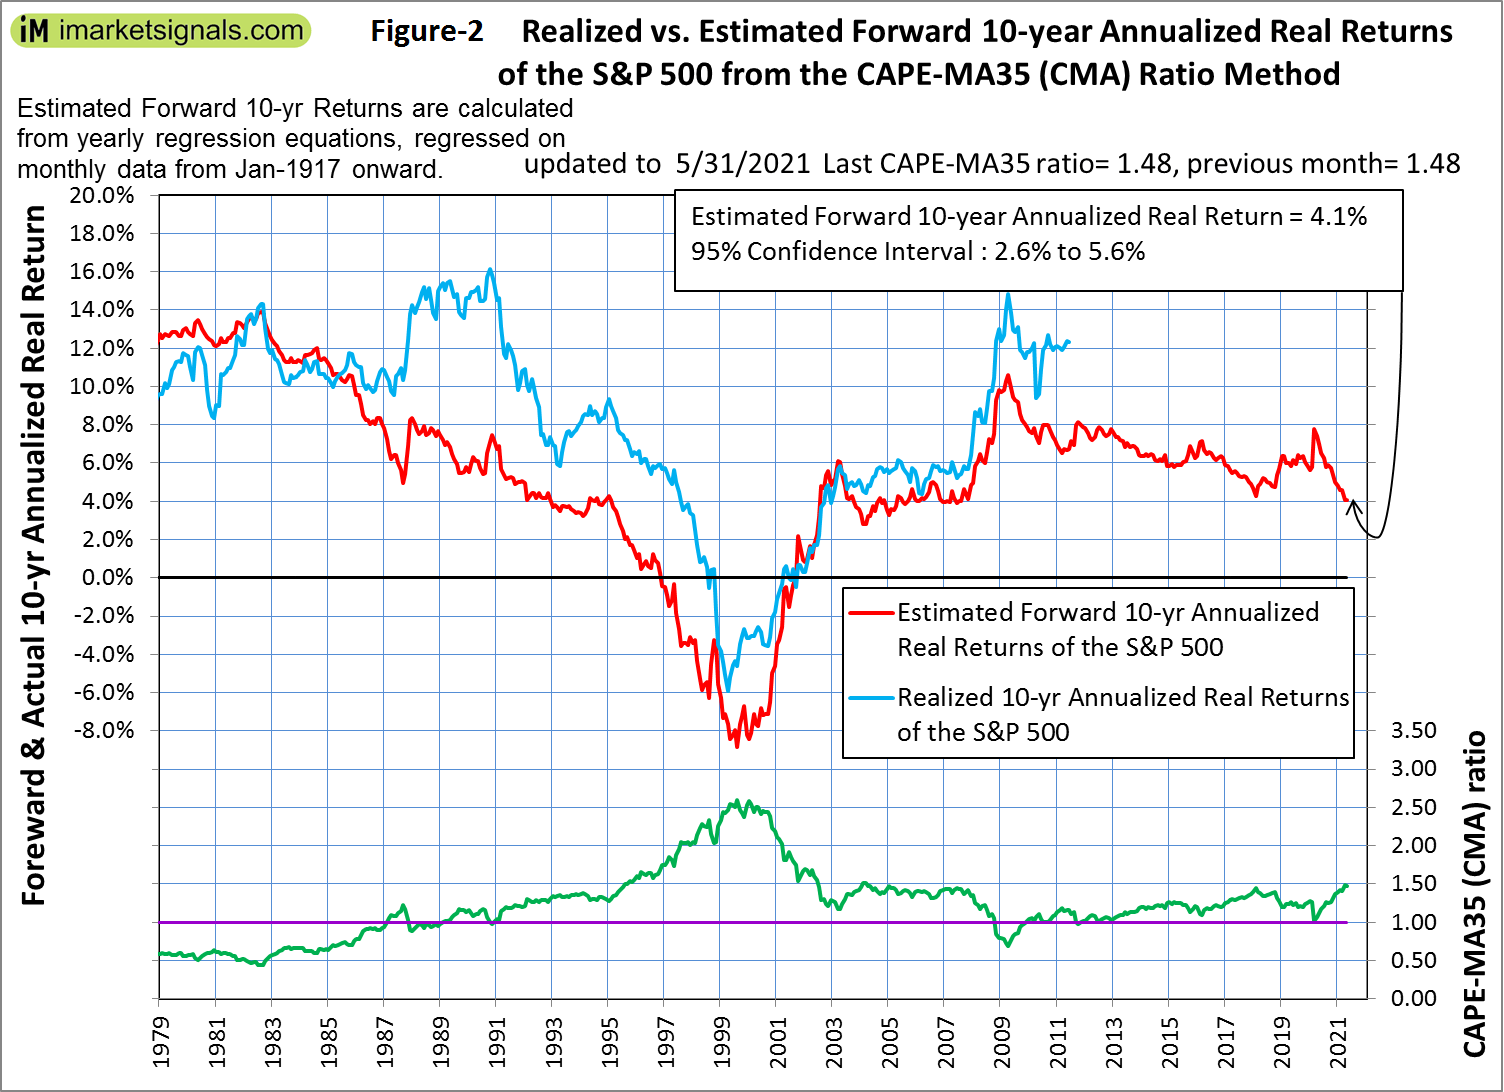
As shown in the referenced article, a superior method to the standard use of the Shiller CAPE-ratio is to predict 10-year real returns using the CAPE-MA35 ratio as a valuation measure. It is simply the value of the Shiller CAPE-ratio divided by the corresponding value of its 35-year moving average (36.8 / 25.0 = 1.48).
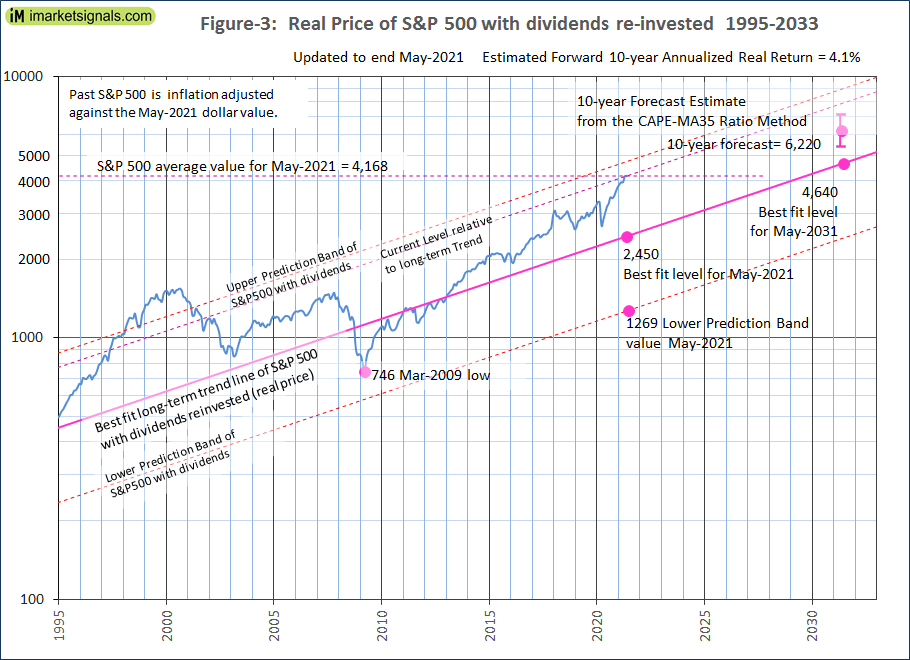
Currently the CAPE-MA35 ratio of 1.48 forecasts an annualized real return of about 4.0% to May 2031. Based on the current S&P 500 value this would indicate an end of May 2031 value of 6220 for S&P-real, with upper and lower confidence values of 7180 and 5370, respectively, all as shown in Figures-2 and -3.
Also in Figure-3 the current level of the S&P 500 relative to the long-term trend is indicated by the line parallel to the long-term trend line. Note that since August 2001 this relative level has never been greater than what it is now.
Forecasting returns to 2031 with the long-term trend
When extending the best fit line and the prediction bands (Figure-3), then the S&P-real end of May 2031 value would be 4640, while the highest and lowest values shown by the prediction bands would be about 8960 and 2400, respectively.
Thus the historic trend forecasts a probable gain of only about 11% (or an annualized return of 1.1%) for S&P-real from its current level of 4164 to the end of May 2031. The worst case scenario would be a possible loss of about 42% (annualized return -5.4%), and the best outcome could be a 115% gain (annualized return 8.0%).
Conclusion
- The current elevated level of the S&P 500 relative to the current long-term trend level warns that stocks are overvalued; and
- The current CAPE-MA35 ratio of 1.48 forecasts only a 4.1% real 10-year forward return for the S&P 500.
- Should the S&P 500 earnings continue to increase (end of 2021 estimate is $174.43 per share) then it is quite possible for the current bull market to continue.
One has to monitor the CAPE-MA35 ratio, because the 10-year forward returns will get lower with increasing values of this ratio. Extreme overvaluation is signaled when the CAPE-MA35 ratio exceeds a value of 1.50, which is near the current value of 1.48.
Updates of the estimated 10-year forward returns of the S&P 500 (Figure-2) are posted monthly at imarketsignals.com.
Appendix
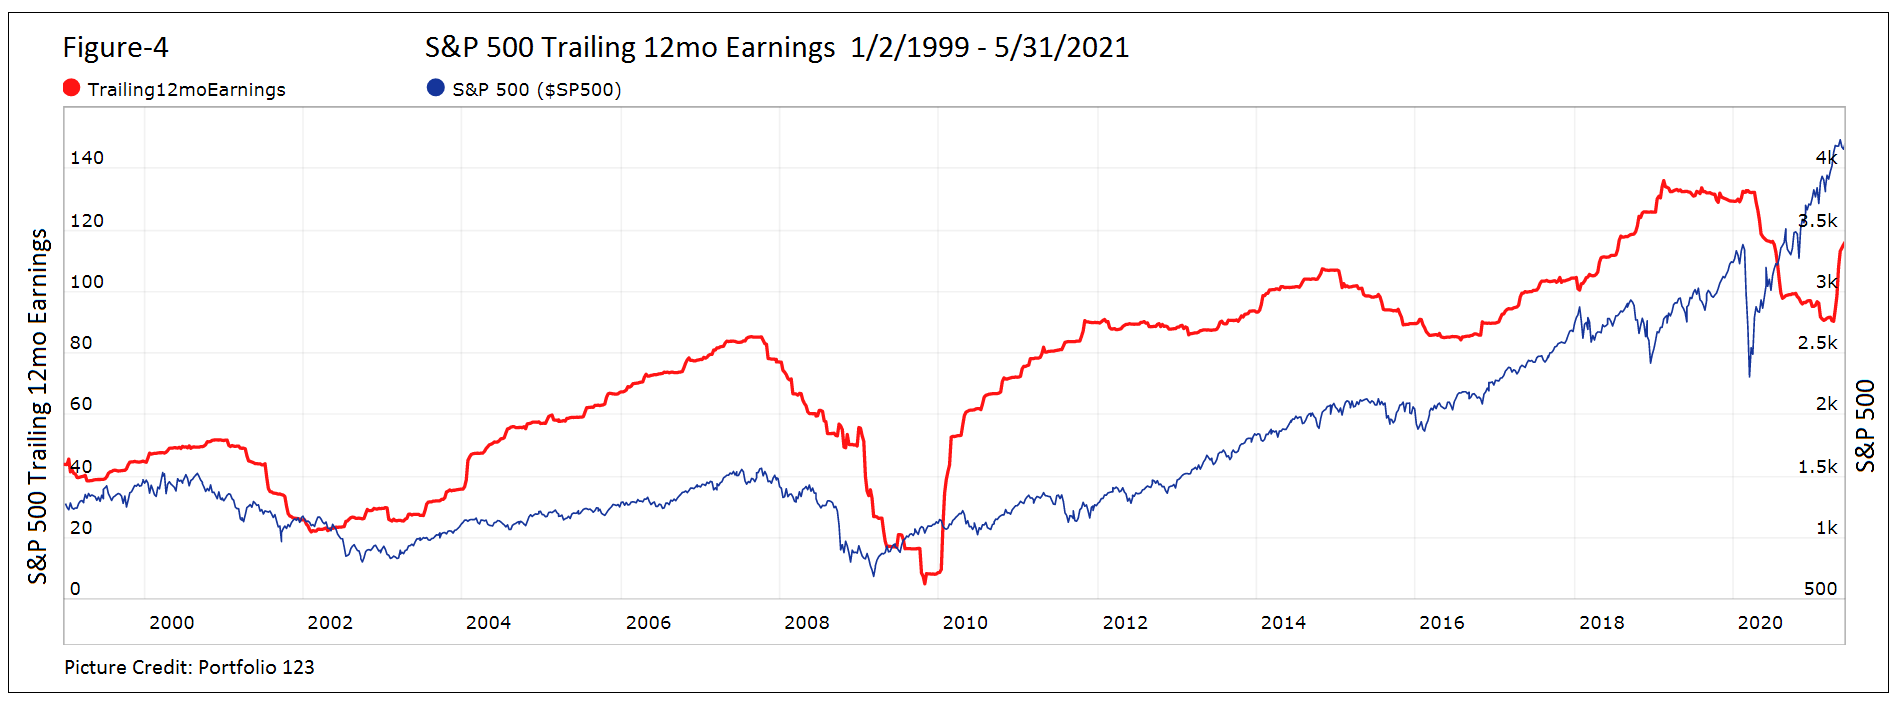
S&P 500 Trailing 12mo Earnings
Figure-4 shows the historic Trailing 12mo Earning per share of the S&P500 (data from Portfolio 123). As one can observe there was a sharp reversal of the downward trend at the end of April 2021, similar to the trend reversal in January 2010.
The best fit line and prediction band
The best fit line and prediction band were calculated from monthly data from Jan-1871 to July-2012. The SP-real values for the period after July-2012 are “out of sample” and were not included in the regression analysis.
The equation of the best fit line is: y = 10(ax+b)
where:
y = is the dependent variable of the best fit line.
x = are the number of months from January 1871 onward.
a = 0.0023112648
b = 2.02423522
Leave a Reply
You must be logged in to post a comment.