
- The new Federal Reserve Bank of Chicago Brave-Butters-Kelley Indexes ( BBK ) provide useful input for recession forecasting.
- In the past, low estimates of BBK GDP growth related to the respective recessions, this allow the extraction of a recession warning signal from this growth series.
- We combine two BBK indexes with the Conference Board LEI and iMarketSignals’ Business Cycle Index BCIg to derive our Long Leading Index (iM-LLI) for the US economy.
- Currently neither index signals a recession warning.
In previous contributions ( article-1 and article-2) we demonstrated that the new Federal Reserve Bank of Chicago Brave-Butters-Kelley Indexes provide good recession capturing indicators. From the latest data set we can reasonably conclude that a recession is not imminent, as detailed below.
The FED released the December 2019 values of their BBK Indexes on 2/4/2020, they summarize:
BBK Indexes point to growth remaining below trend in December
The Brave-Butters-Kelley ( BBK ) Coincident Index was –0.3 standard deviations from trend growth in December 2019, and the BBK Leading Index was 0.0 standard deviations from trend growth. In annualized real gross domestic product ( GDP ) units, BBK Monthly GDP Growth was 2.0% in December. The trend component contributed 2.4%, the cycle component contributed –0.6%, and the irregular component contributed 0.2%. The leading subcomponent contributed 0.0% and the lagging subcomponent contributed –0.6% to the cycle component of BBK Monthly GDP Growth.
| Recent values Brave-Butters-Kelley Indexes | ||||||
| Dec ’19 | Nov | Oct | Sep | Aug | Jul | |
| Coincident Index | –0.3 | –0.2 | –0.4 | –0.5 | –0.3 | –0.3 |
| Leading Index | 0.0 | 0.1 | –0.1 | –0.1 | 0.2 | 0.1 |
| Cycle component | –0.6 | –0.5 | –1.1 | –1.1 | –0.7 | –0.8 |
| Leading subcomponent | 0.0 | 0.0 | –0.1 | 0.0 | 0.1 | 0.1 |
| Lagging subcomponent | –0.6 | –0.5 | –1.0 | –1.1 | –0.8 | –0.8 |
| Trend component | 2.4 | 2.4 | 2.4 | 2.4 | 2.4 | 2.4 |
| Irregular component | 0.2 | 0.4 | 0.6 | 0.6 | 0.6 | 0.5 |
| Monthly GDP Growth | 2.0 | 2.3 | 1.9 | 1.9 | 2.3 | 2.2 |
The estimates are based on data as of January 31, 2020.
Recession forecasting with the BBK Monthly GDP Growth less its Irregular component.
In Figure 1 we plot the sum of the Cycle and Trend components (3 rd and 6 th entry row of table above) for BBK Monthly GDP Growth(BBK-GDPg). (The irregular component is only available after quarterly GDP releases.) This plot is a point-in-time graph, i.e. we have added two months to the FED’s series dates, because this is when one would, for the first time, have had the data update for this indicator.
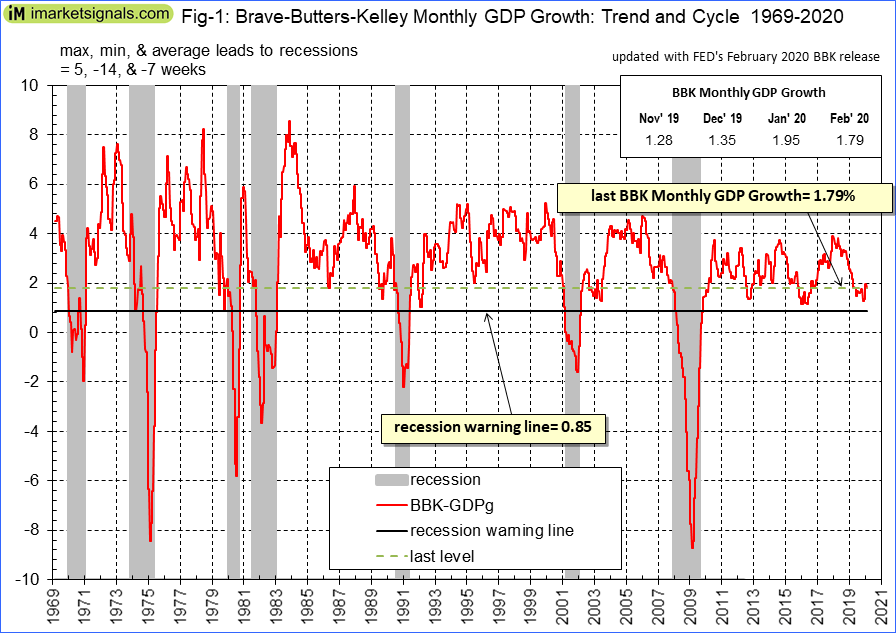
The BBK-GDPg declined to 1.79% from last month’s downward revised 1.95% (previous 2.15%). From analyzing past values, a recession warning is triggered when the growth reduces to less than 0.85%, hence a recession warning is currently not signaled.
Recession forecasting with iMarketSignal’s Long Leading Indicator.
The iM-LLI is constructed by combining following data series
- The BBK Coincident Index
- The BBK Leading Index
- The Conference Board LEI Growth
- The iM-Business Cycle Growth
The plot in Figure-2 is the sum of the weighted normalized weekly values of the component indicators listed above. It is a point-in-time growth series that triggers a long leading recession warning when its level moves below zero.

The iM-LLI fell to 3.89 from last month’s upward revised 3.99 (previous 3.83), hence this indicator signals that a recession is unlikely to begin during the next 8 months.
Leave a Reply
You must be logged in to post a comment.