
  |
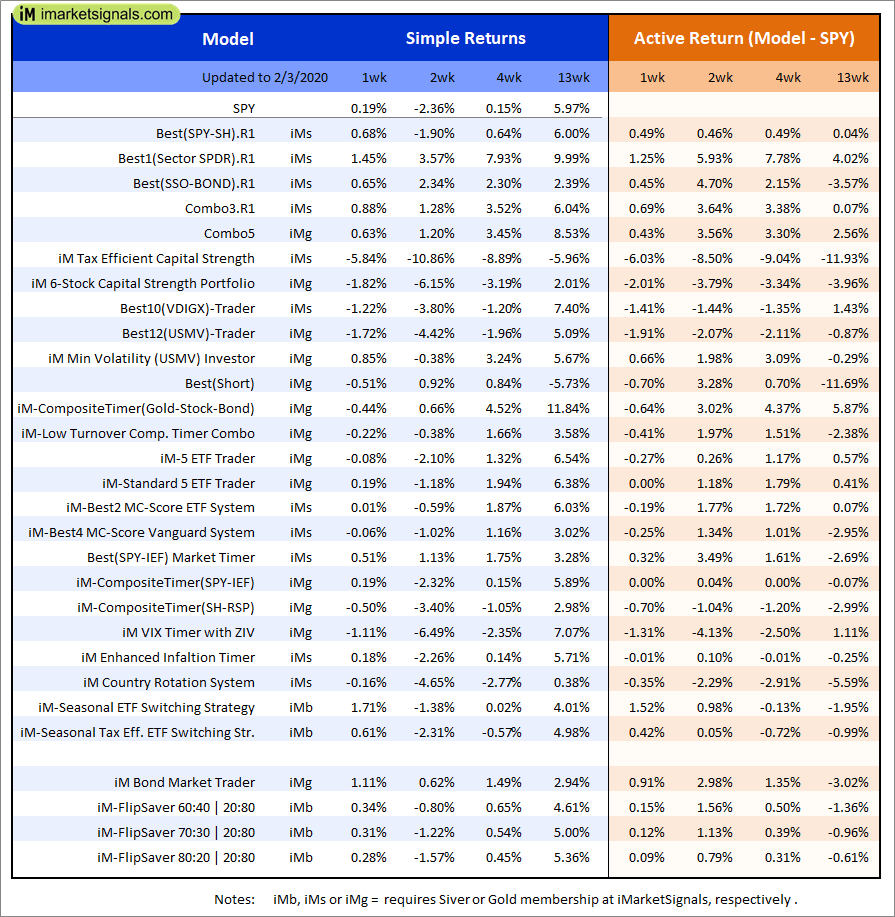
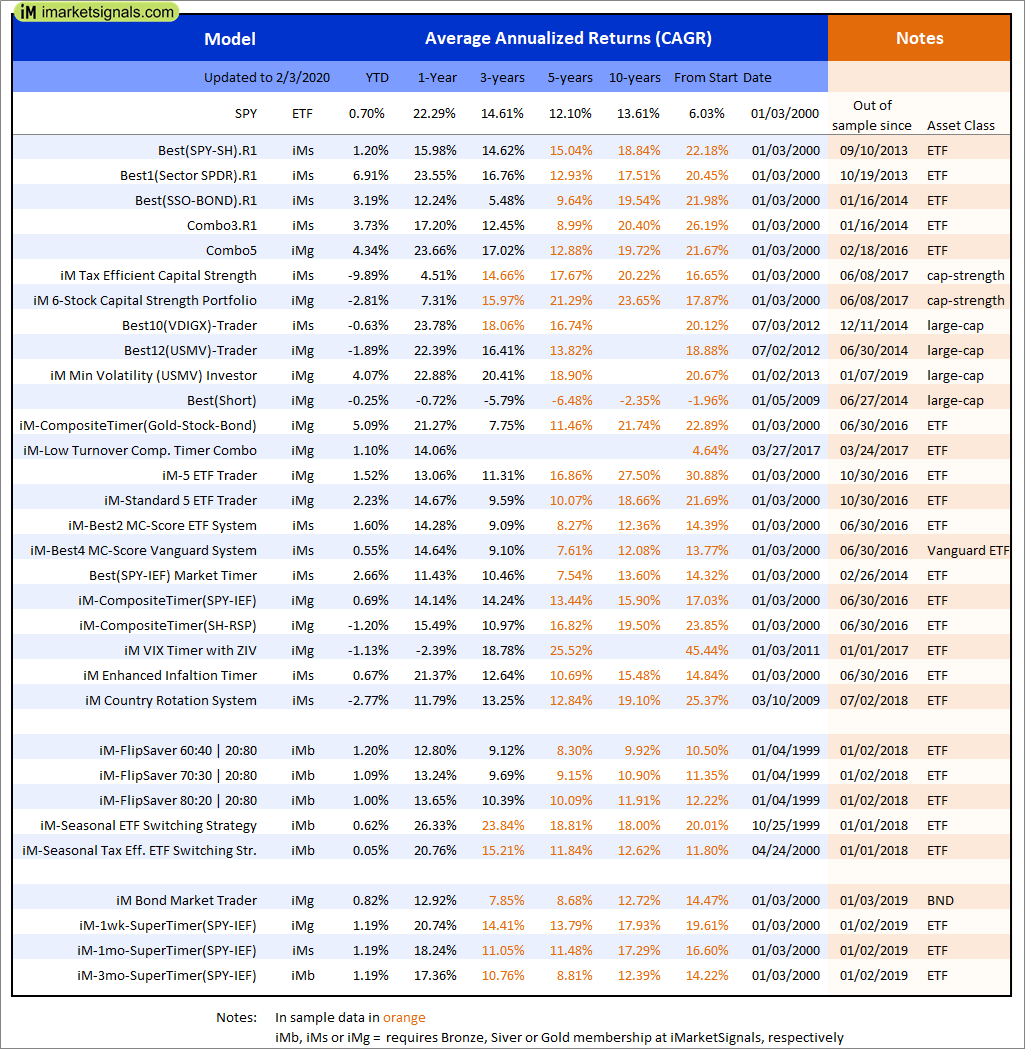
Out of sample performance summary of our models for the past 1, 2, 4 and 13 week periods. The active active return indicates how the models over- or underperformed the benchmark ETF SPY. Also the YTD, and the 1-, 3-, 5- and 10-year annualized returns are shown in the second table |
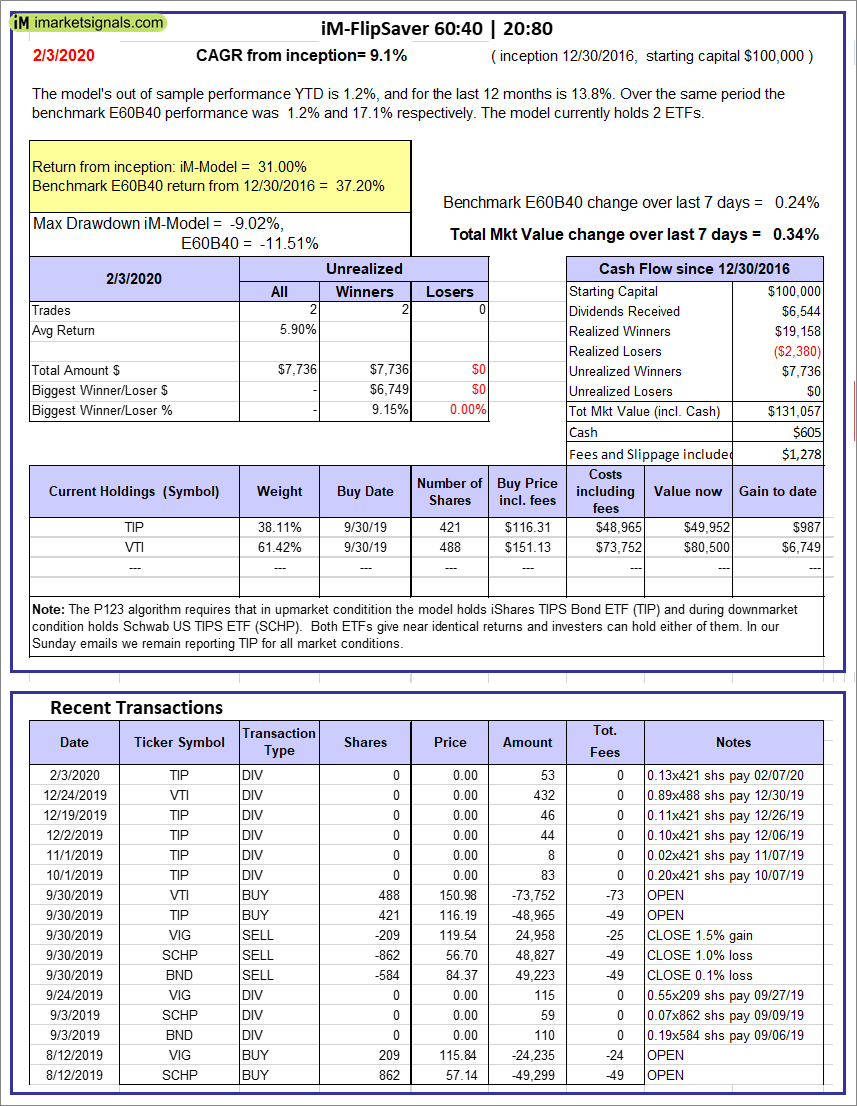 |
iM-FlipSaver 60:40 | 20:80 – 2017: The model’s out of sample performance YTD is 1.2%, and for the last 12 months is 13.8%. Over the same period the benchmark E60B40 performance was 1.2% and 17.1% respectively. Over the previous week the market value of iM-FlipSaver 80:20 | 20:80 gained 0.34% at a time when SPY gained 0.24%. A starting capital of $100,000 at inception on 7/16/2015 would have grown to $131,057 which includes $605 cash and excludes $1,278 spent on fees and slippage. |
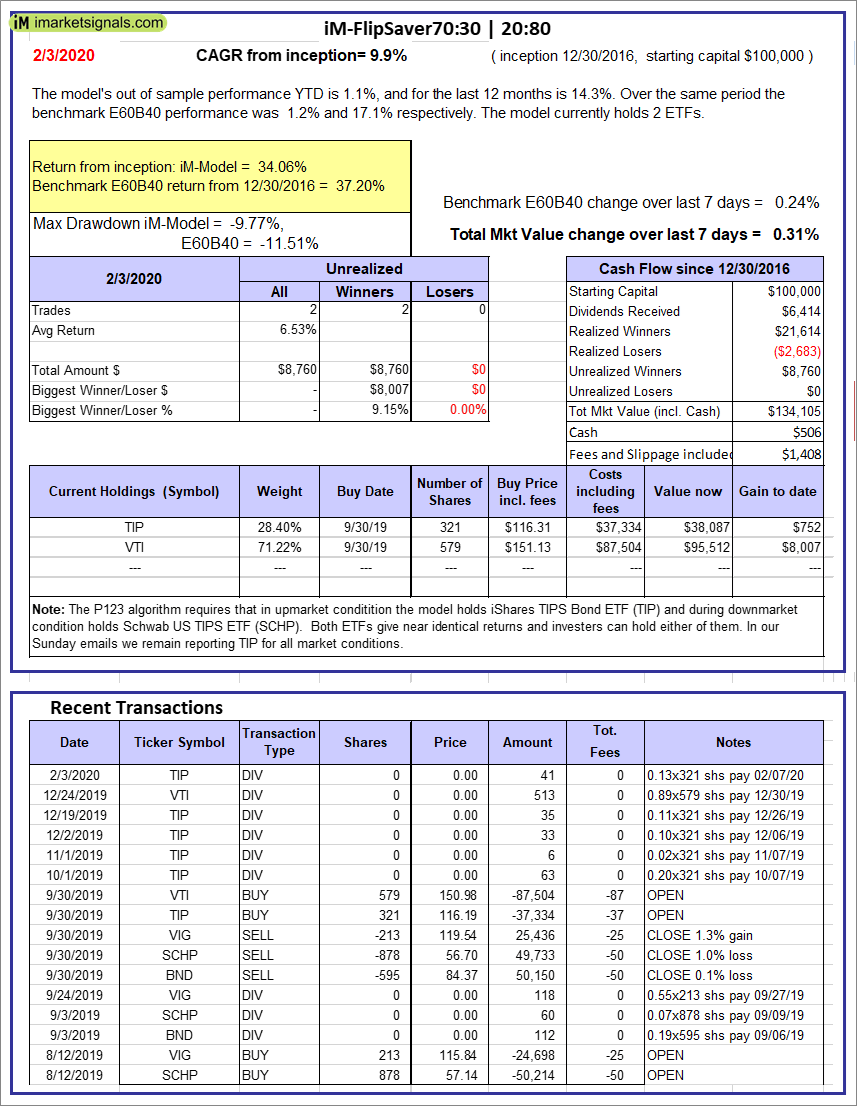 |
iM-FlipSaver 70:30 | 20:80 – 2017: The model’s out of sample performance YTD is 1.1%, and for the last 12 months is 14.3%. Over the same period the benchmark E60B40 performance was 1.2% and 17.1% respectively. Over the previous week the market value of iM-FlipSaver 70:30 | 20:80 gained 0.31% at a time when SPY gained 0.24%. A starting capital of $100,000 at inception on 7/15/2015 would have grown to $134,105 which includes $506 cash and excludes $1,408 spent on fees and slippage. |
 |
iM-FlipSaver 80:20 | 20:80 – 2017: The model’s out of sample performance YTD is 1.0%, and for the last 12 months is 14.7%. Over the same period the benchmark E60B40 performance was 1.2% and 17.1% respectively. Over the previous week the market value of iM-FlipSaver 80:20 | 20:80 gained 0.28% at a time when SPY gained 0.24%. A starting capital of $100,000 at inception on 1/2/2017 would have grown to $137,145 which includes $545 cash and excludes $1,531 spent on fees and slippage. |
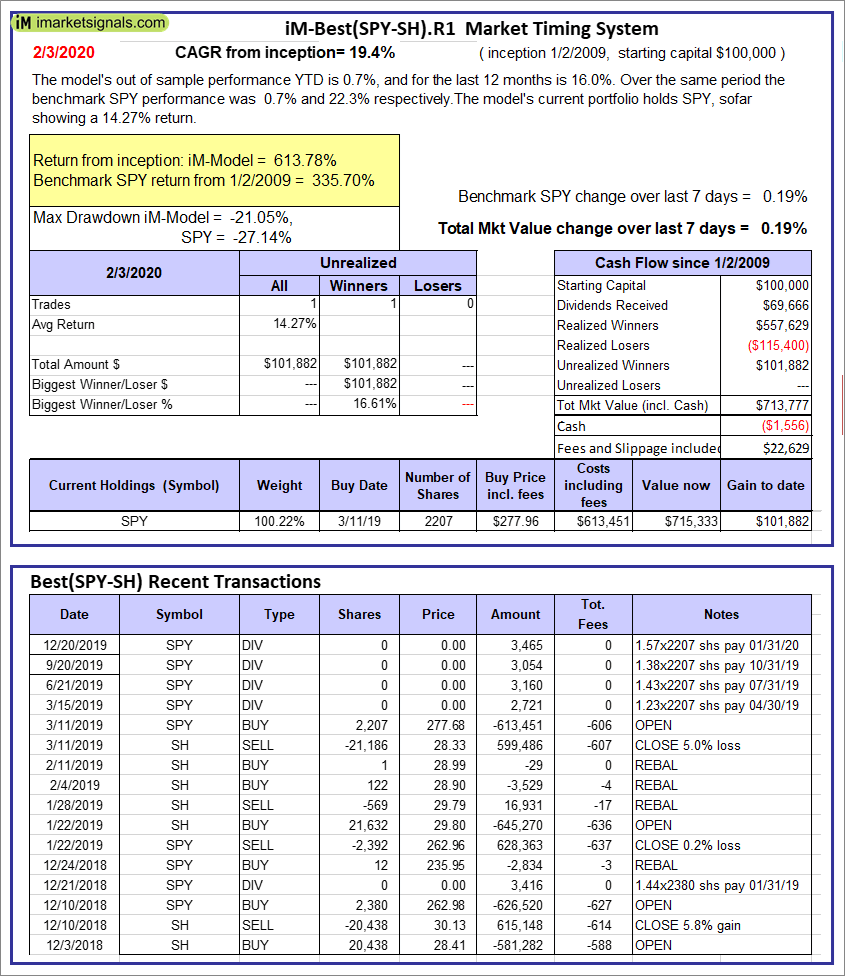 |
iM-Best(SPY-SH).R1: The model’s out of sample performance YTD is 0.7%, and for the last 12 months is 16.0%. Over the same period the benchmark SPY performance was 0.7% and 22.3% respectively. Over the previous week the market value of Best(SPY-SH) gained 0.19% at a time when SPY gained 0.19%. A starting capital of $100,000 at inception on 1/2/2009 would have grown to $713,777 which includes -$1,556 cash and excludes $22,629 spent on fees and slippage. |
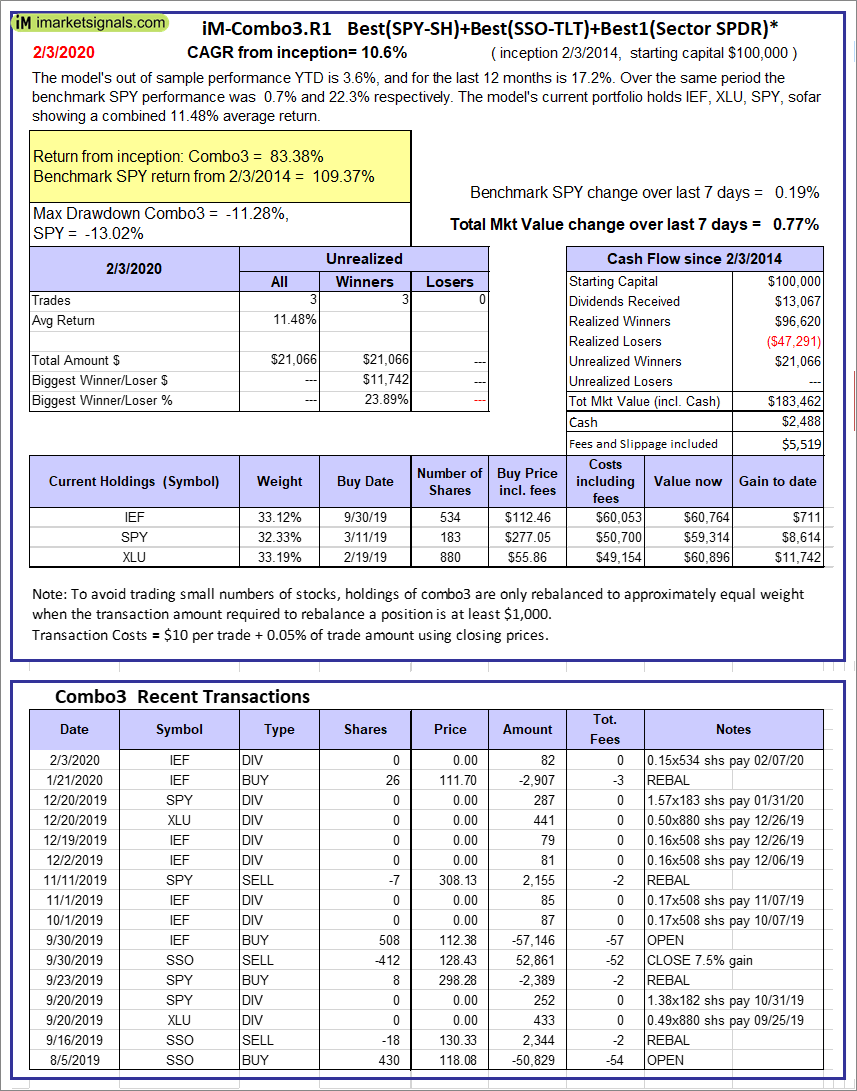 |
iM-Combo3.R1: The model’s out of sample performance YTD is 3.6%, and for the last 12 months is 17.2%. Over the same period the benchmark SPY performance was 0.7% and 22.3% respectively. Over the previous week the market value of iM-Combo3.R1 gained 0.77% at a time when SPY gained 0.19%. A starting capital of $100,000 at inception on 2/3/2014 would have grown to $183,462 which includes $2,488 cash and excludes $5,519 spent on fees and slippage. |
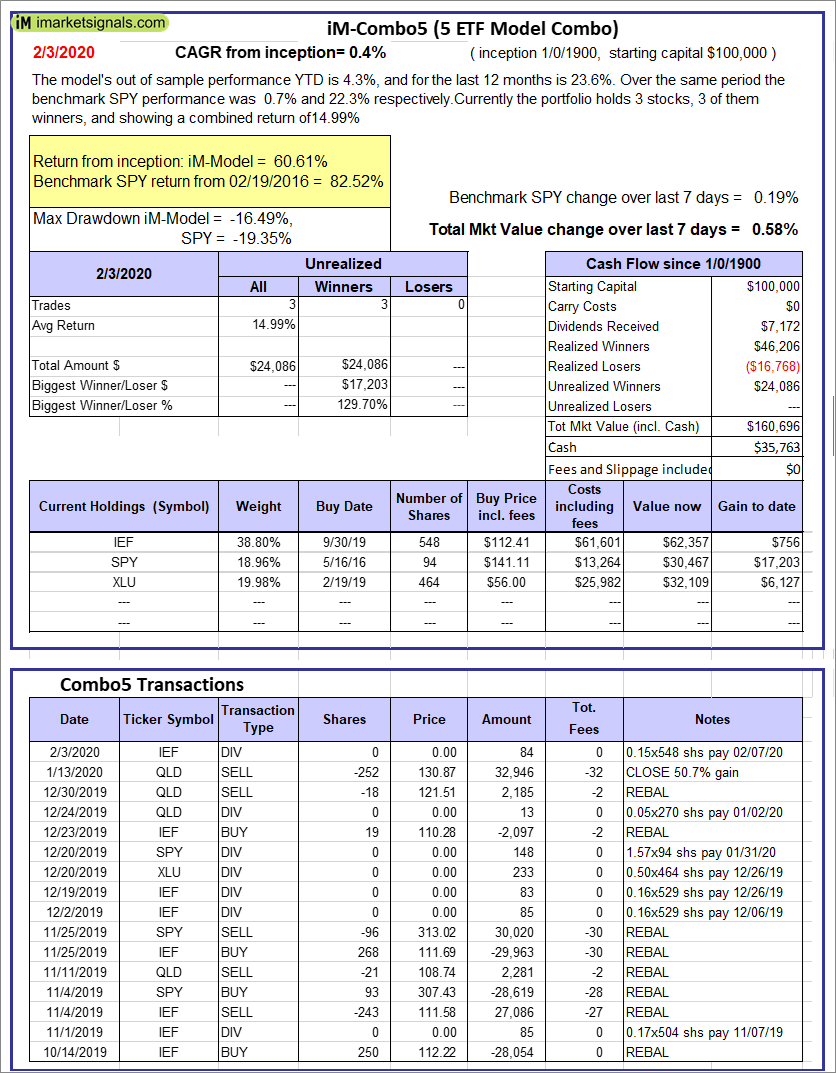 |
iM-Combo5: The model’s out of sample performance YTD is 4.3%, and for the last 12 months is 23.6%. Over the same period the benchmark SPY performance was 0.7% and 22.3% respectively. Over the previous week the market value of iM-Combo5 gained 0.58% at a time when SPY gained 0.19%. A starting capital of $100,000 at inception on 2/22/2016 would have grown to $160,696 which includes $35,763 cash and excludes $0 spent on fees and slippage. |
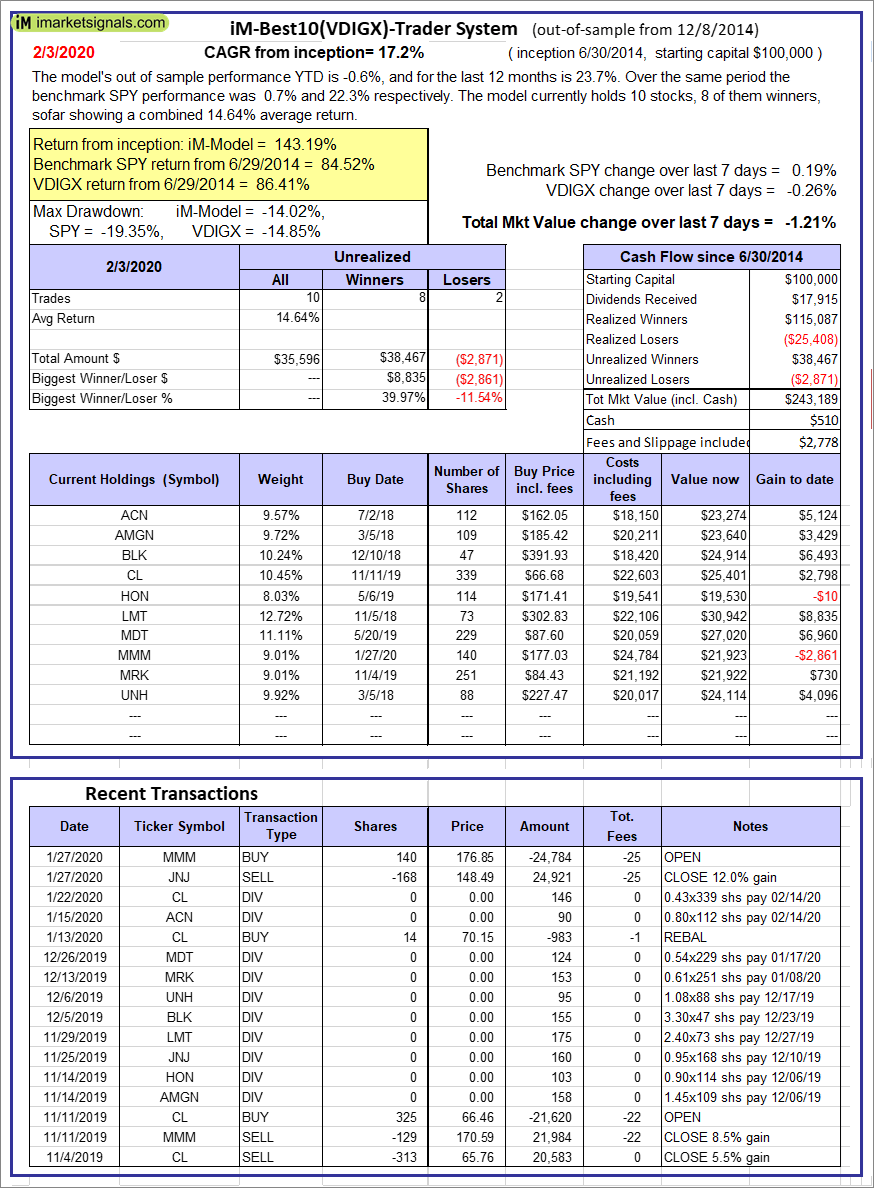 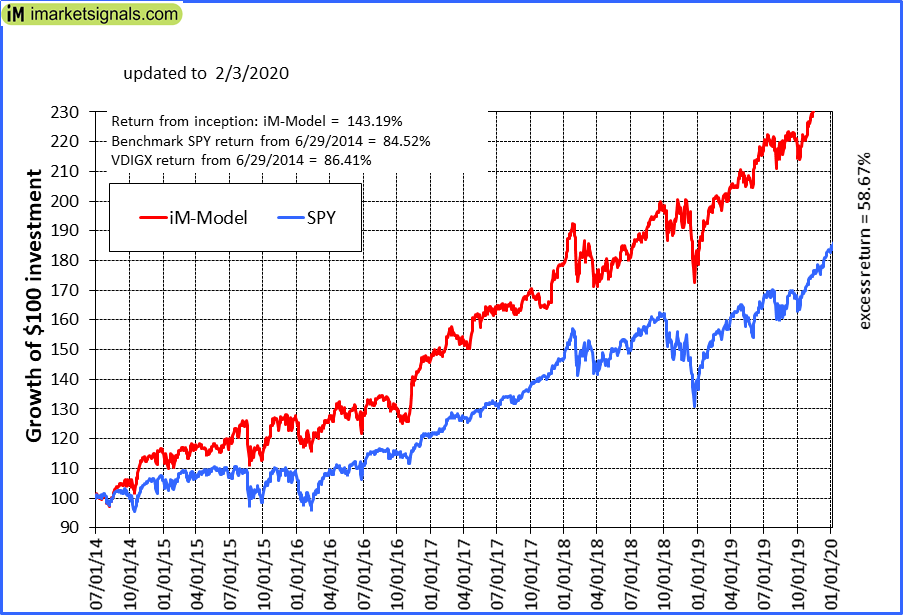 |
iM-Best10(VDIGX)-Trader: The model’s out of sample performance YTD is -0.6%, and for the last 12 months is 23.7%. Over the same period the benchmark SPY performance was 0.7% and 22.3% respectively. Since inception, on 7/1/2014, the model gained 143.19% while the benchmark SPY gained 84.52% and VDIGX gained 86.41% over the same period. Over the previous week the market value of iM-Best10(VDIGX) gained -1.21% at a time when SPY gained 0.19%. A starting capital of $100,000 at inception on 7/1/2014 would have grown to $243,189 which includes $510 cash and excludes $2,778 spent on fees and slippage. |
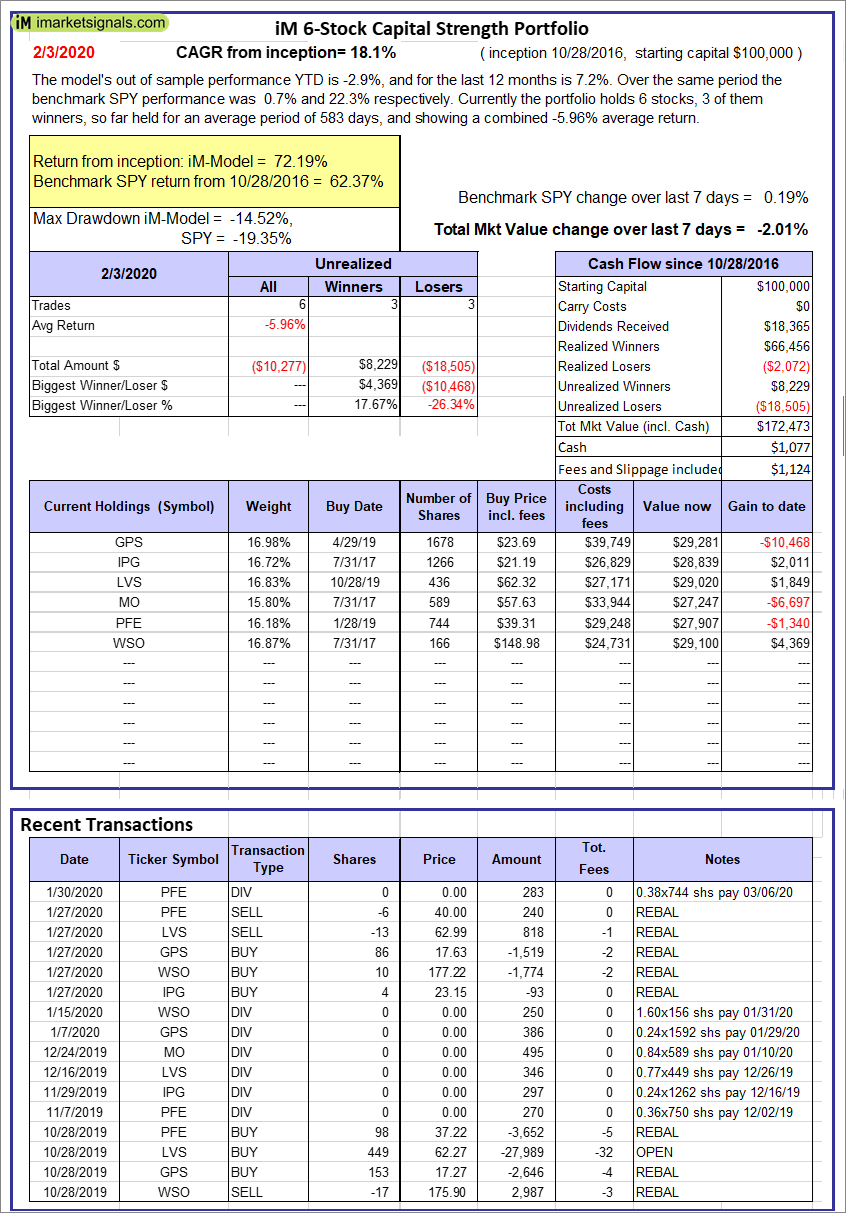 |
iM 6-Stock Capital Strength Portfolio: The model’s out of sample performance YTD is -2.9%, and for the last 12 months is 7.2%. Over the same period the benchmark SPY performance was 0.7% and 22.3% respectively. Over the previous week the market value of the iM 6-Stock Capital Strength Portfolio gained -2.01% at a time when SPY gained 0.19%. A starting capital of $100,000 at inception on 10/28/2016 would have grown to $172,473 which includes $1,077 cash and excludes $1,124 spent on fees and slippage. |
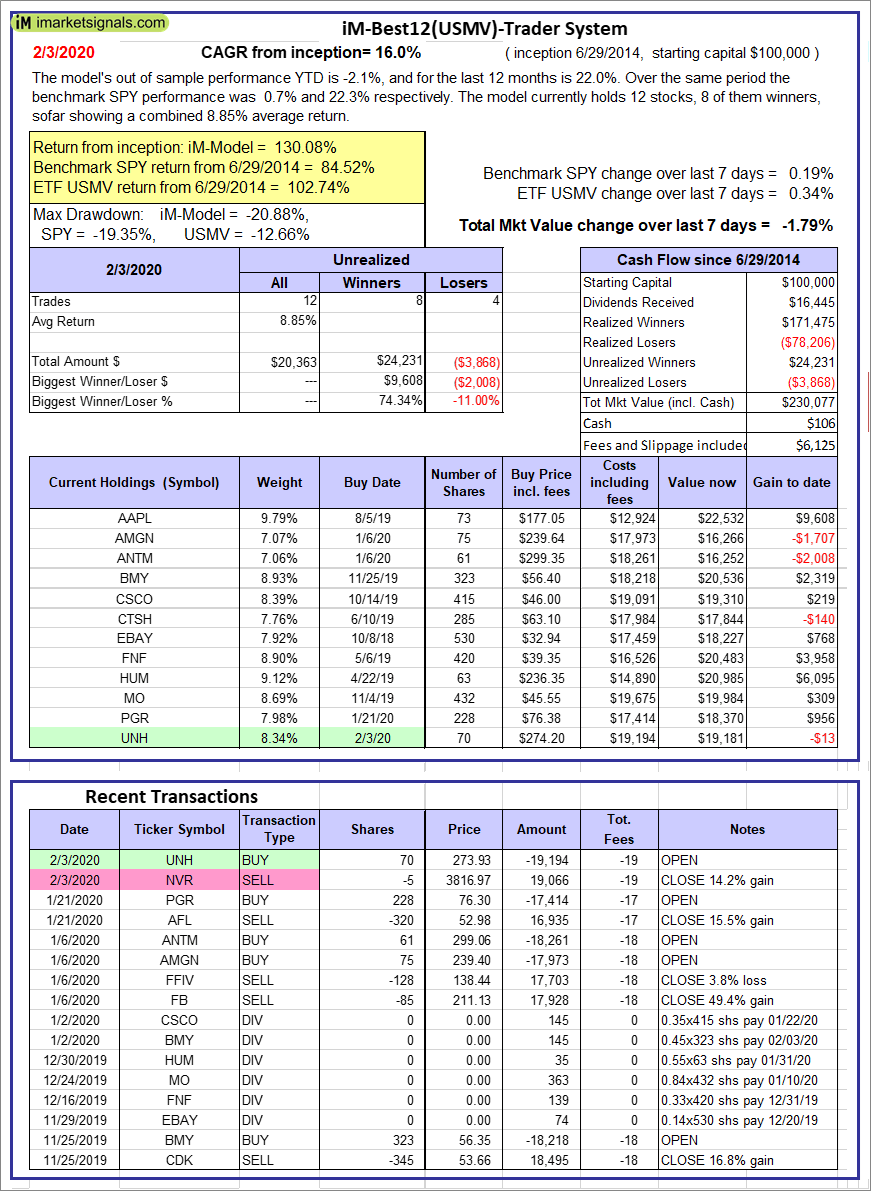  |
iM-Best12(USMV)-Trader: The model’s out of sample performance YTD is -2.1%, and for the last 12 months is 22.0%. Over the same period the benchmark SPY performance was 0.7% and 22.3% respectively. Since inception, on 6/30/2014, the model gained 130.08% while the benchmark SPY gained 84.52% and the ETF USMV gained 102.74% over the same period. Over the previous week the market value of iM-Best12(USMV)-Trader gained -1.79% at a time when SPY gained 0.19%. A starting capital of $100,000 at inception on 6/30/2014 would have grown to $230,077 which includes $106 cash and excludes $6,125 spent on fees and slippage. |
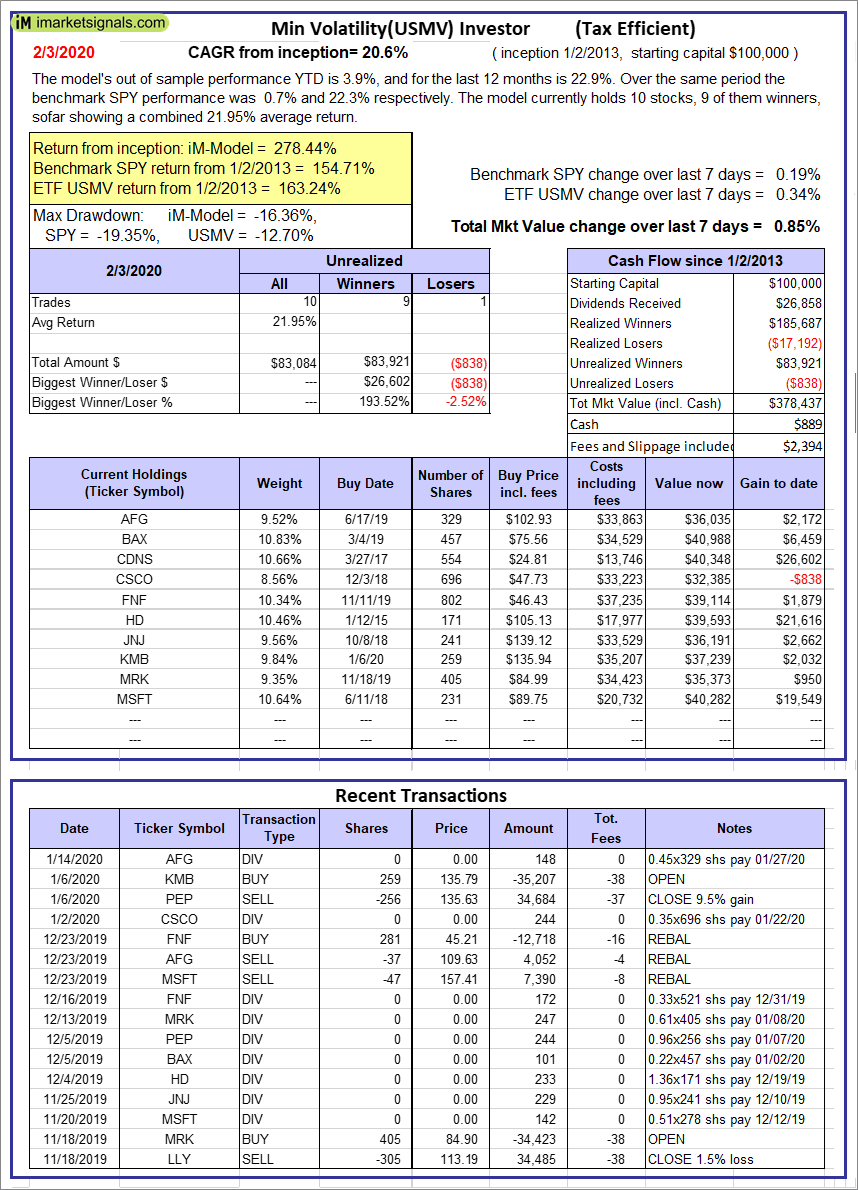  |
iM-Min Volatility(USMV) Investor (Tax Efficient): The model’s out of sample performance YTD is 3.9%, and for the last 12 months is 22.9%. Over the same period the benchmark SPY performance was 0.7% and 22.3% respectively. Since inception, on 1/3/2013, the model gained 278.44% while the benchmark SPY gained 154.71% and the ETF USMV gained 163.24% over the same period. Over the previous week the market value of iM-Best12(USMV)Q1 gained 0.85% at a time when SPY gained 0.19%. A starting capital of $100,000 at inception on 1/3/2013 would have grown to $378,437 which includes $889 cash and excludes $2,394 spent on fees and slippage. |
 |
iM-Bond Market Trader (High-Yield Bond or 10-yr Treasury Bond): The model’s out of sample performance YTD is 1.5%, and for the last 12 months is 12.8%. Over the same period the benchmark SPY performance was 0.7% and 22.3% respectively. Over the previous week the market value of the iM-Bond Market Trader (High-Yield Bond or 10-yr Treasury Bond) gained 1.11% at a time when BND gained 0.30%. A starting capital of $100,000 at inception on 10/30/2016 would have grown to $151,674 which includes $5,978 cash and excludes $1,985 spent on fees and slippage. |
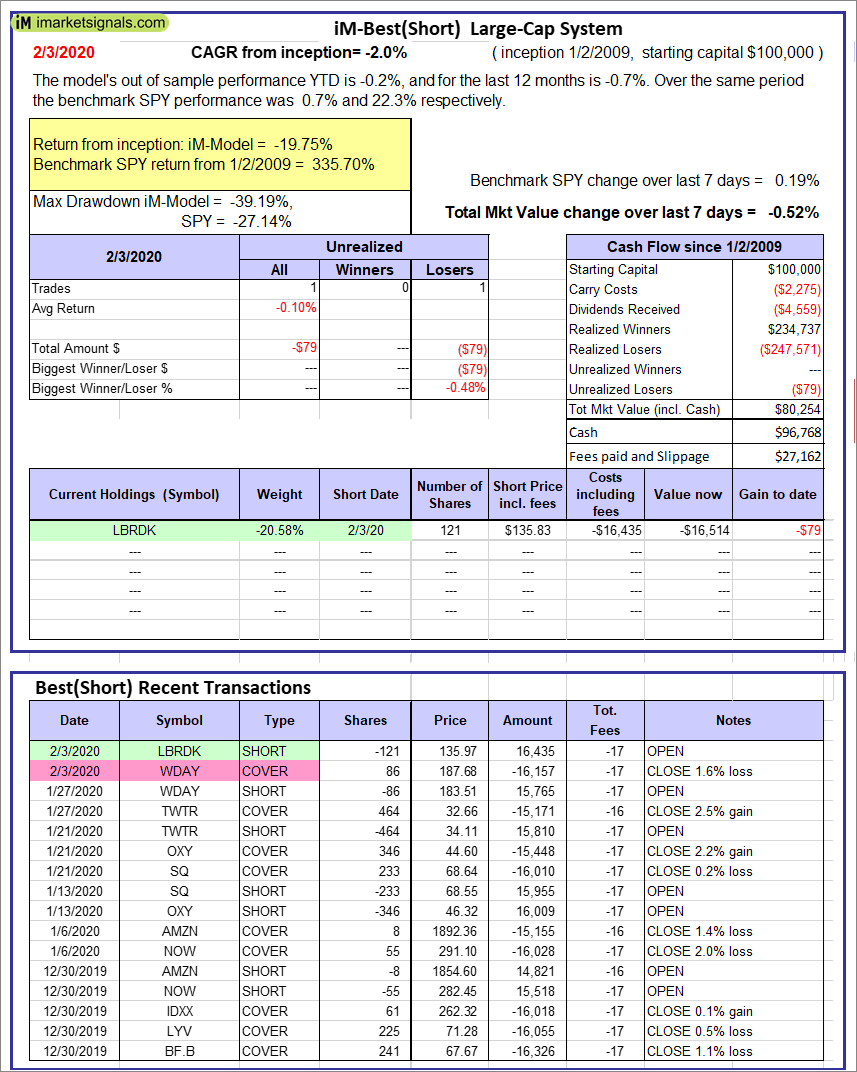 |
iM-Best(Short): The model’s out of sample performance YTD is -0.2%, and for the last 12 months is -0.7%. Over the same period the benchmark SPY performance was 0.7% and 22.3% respectively. Over the previous week the market value of iM-Best(Short) gained -0.52% at a time when SPY gained 0.19%. Over the period 1/2/2009 to 2/3/2020 the starting capital of $100,000 would have grown to $80,254 which includes $96,768 cash and excludes $27,162 spent on fees and slippage. |
 |
iM-Best2 MC-Score ETF System: The model’s out of sample performance YTD is 1.6%, and for the last 12 months is 14.3%. Over the same period the benchmark SPY performance was 0.7% and 22.3% respectively. Over the previous week the market value of the iM-Best2 MC-Score ETF System gained 0.01% at a time when SPY gained 0.19%. A starting capital of $100,000 at inception on 6/30/2016 would have grown to $127,751 which includes $53 cash and excludes $676 spent on fees and slippage. |
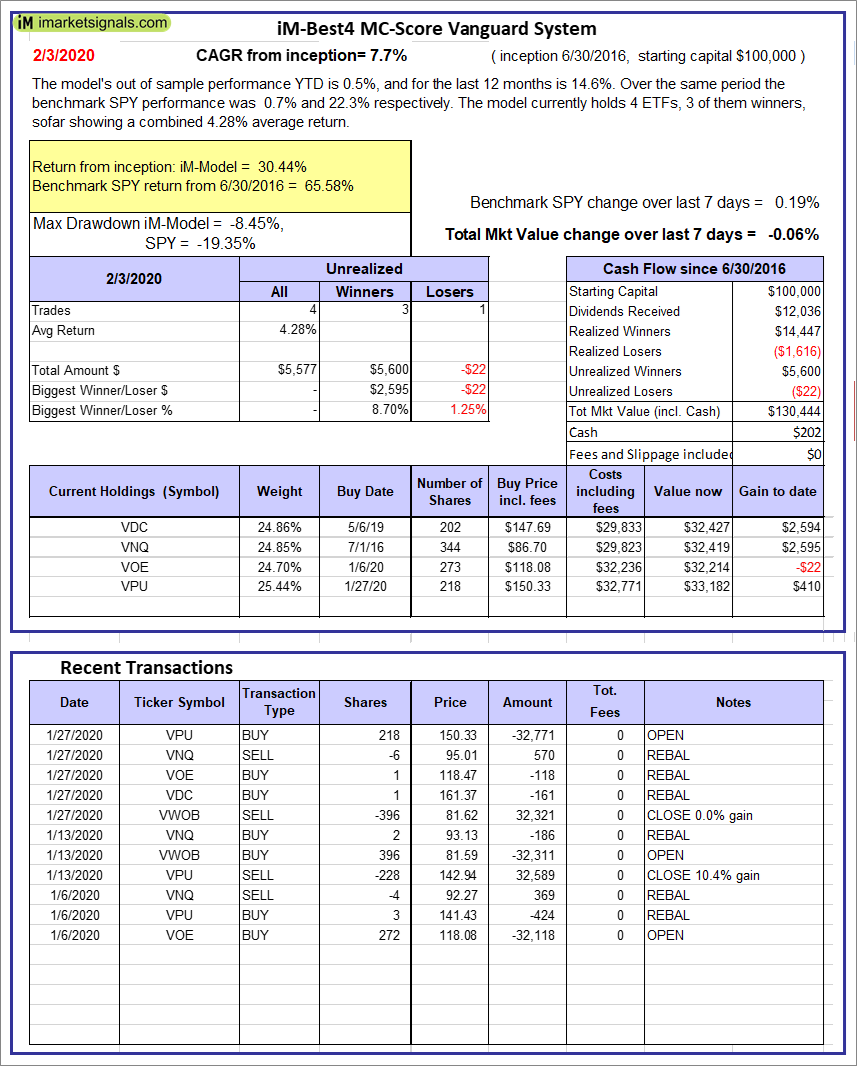 |
iM-Best4 MC-Score Vanguard System: The model’s out of sample performance YTD is 0.5%, and for the last 12 months is 14.6%. Over the same period the benchmark SPY performance was 0.7% and 22.3% respectively. Over the previous week the market value of the iM-Best4 MC-Score Vanguard System gained -0.06% at a time when SPY gained 0.19%. A starting capital of $100,000 at inception on 6/30/2016 would have grown to $130,444 which includes $202 cash and excludes $00 spent on fees and slippage. |
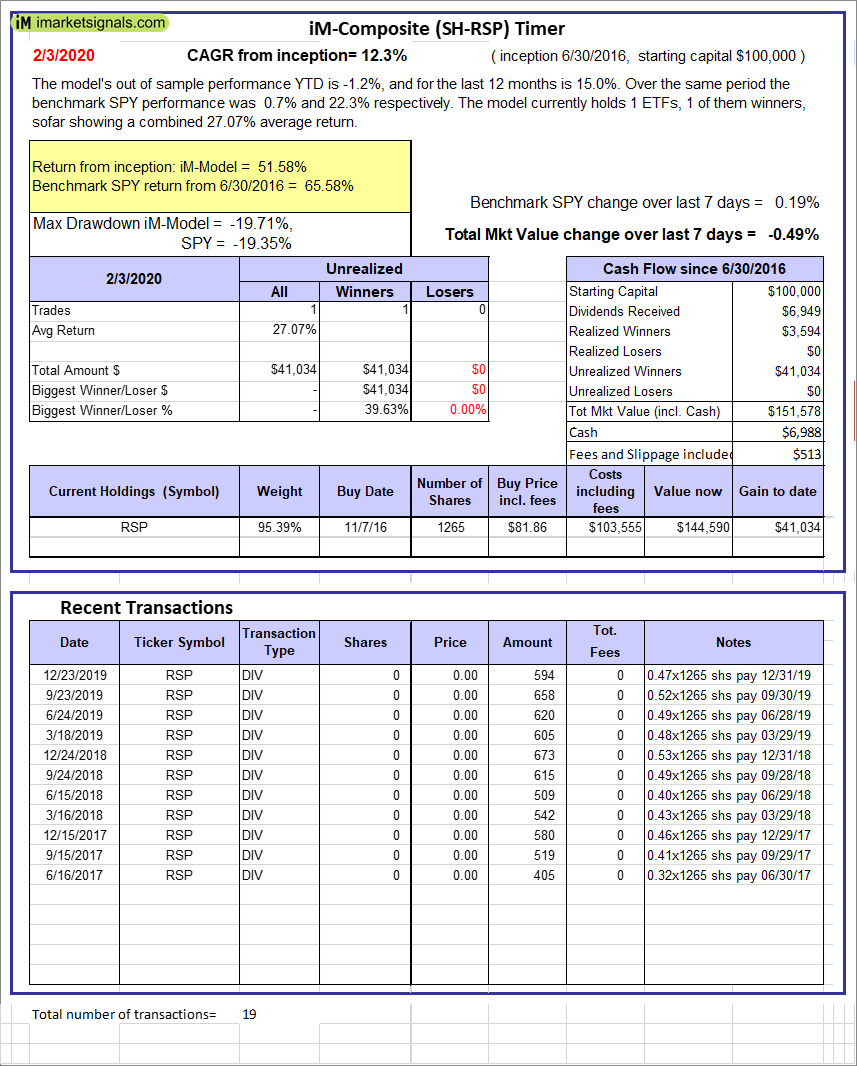 |
iM-Composite (SH-RSP) Timer: The model’s out of sample performance YTD is -1.2%, and for the last 12 months is 15.0%. Over the same period the benchmark SPY performance was 0.7% and 22.3% respectively. Over the previous week the market value of the iM-Composite (SH-RSP) Timer gained -0.49% at a time when SPY gained 0.19%. A starting capital of $100,000 at inception on 6/30/2016 would have grown to $151,578 which includes $6,988 cash and excludes $513 spent on fees and slippage. |
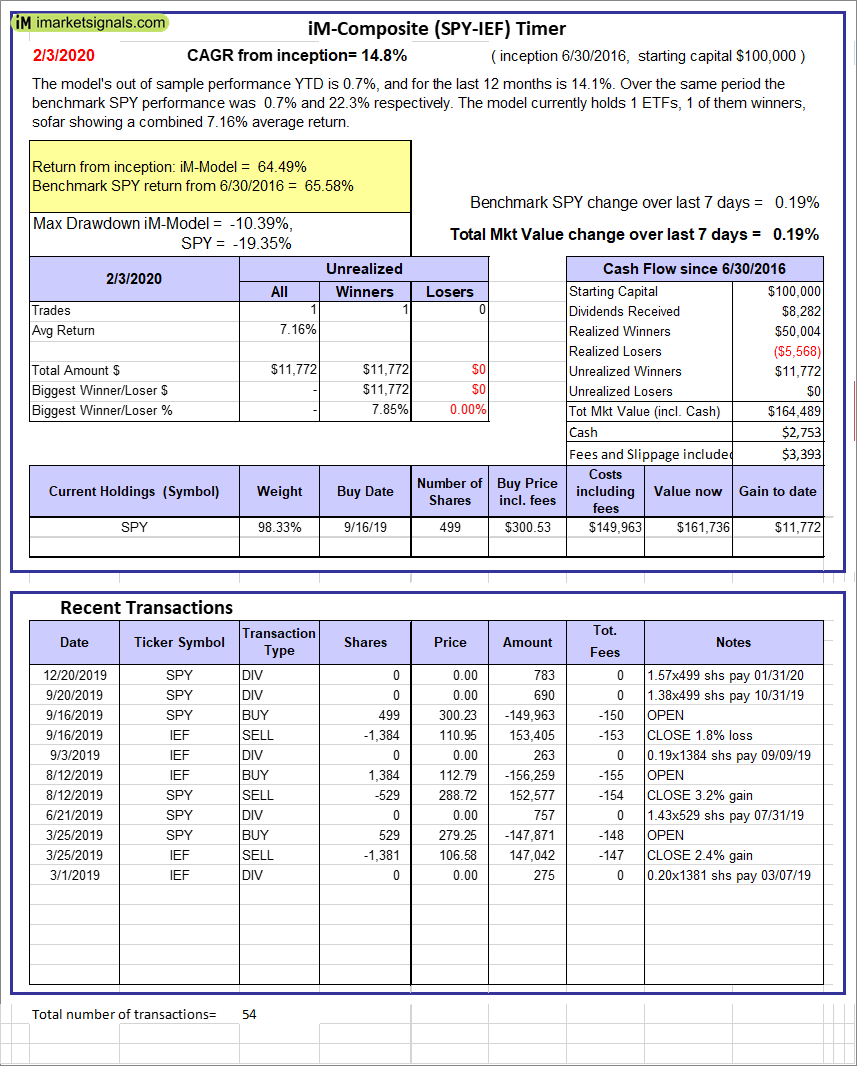 |
iM-Composite (SPY-IEF) Timer: The model’s out of sample performance YTD is 0.7%, and for the last 12 months is 14.1%. Over the same period the benchmark SPY performance was 0.7% and 22.3% respectively. Over the previous week the market value of the iM-Composite (SPY-IEF) Timer gained 0.19% at a time when SPY gained 0.19%. A starting capital of $100,000 at inception on 6/30/2016 would have grown to $164,489 which includes $2,753 cash and excludes $3,393 spent on fees and slippage. |
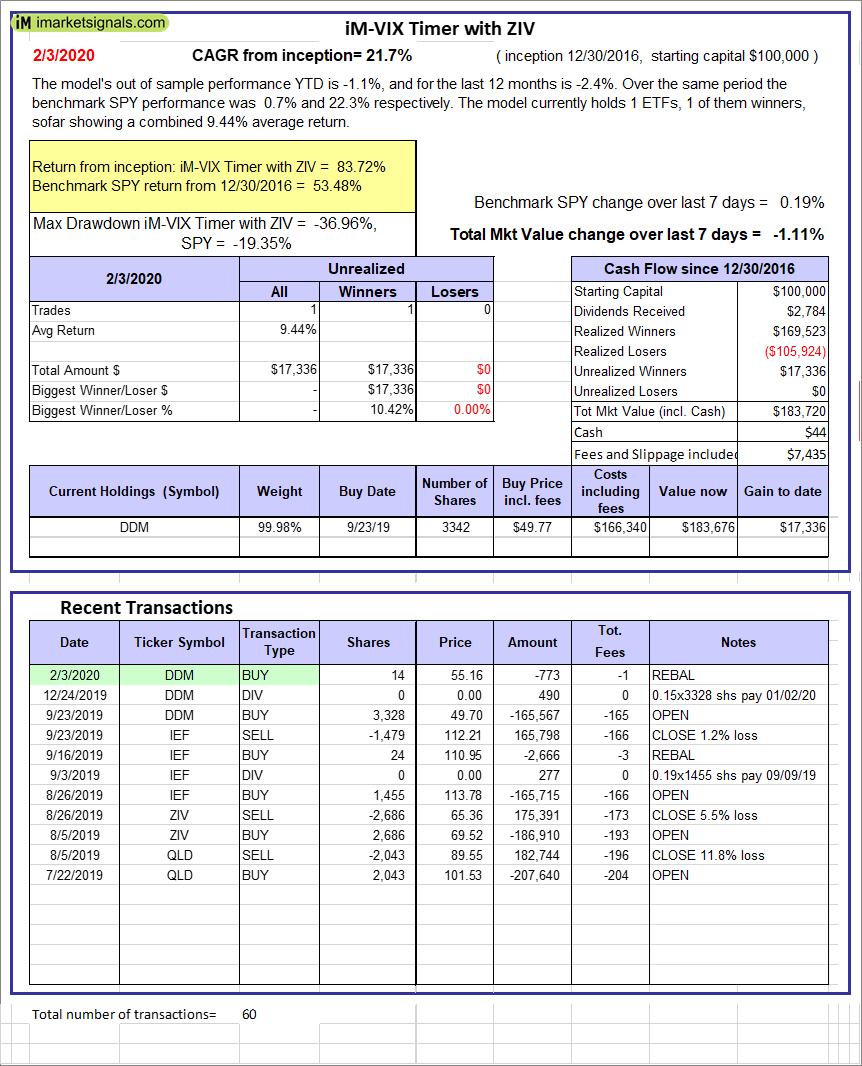 |
iM-VIX Timer with ZIV: The model’s out of sample performance YTD is -1.1%, and for the last 12 months is -2.4%. Over the same period the benchmark SPY performance was 0.7% and 22.3% respectively. Over the previous week the market value of the iM-VIX Timer with ZIV gained -1.11% at a time when SPY gained 0.19%. A starting capital of $100,000 at inception on 6/30/2016 would have grown to $183,720 which includes $44 cash and excludes $7,435 spent on fees and slippage. |
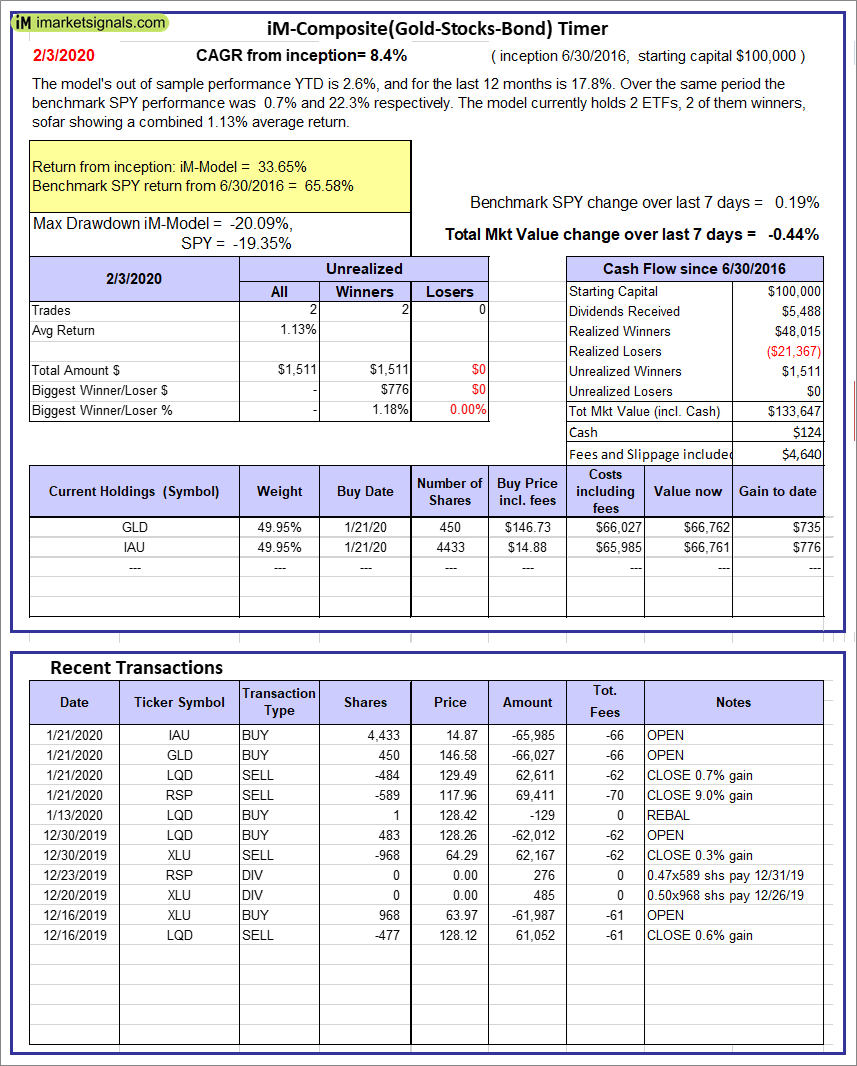 |
iM-Composite(Gold-Stocks-Bond) Timer: The model’s out of sample performance YTD is 2.6%, and for the last 12 months is 17.8%. Over the same period the benchmark SPY performance was 0.7% and 22.3% respectively. Over the previous week the market value of the iM-Composite(Gold-Stocks-Bond) Timer gained -0.44% at a time when SPY gained 0.19%. A starting capital of $100,000 at inception on 6/30/2016 would have grown to $133,647 which includes $124 cash and excludes $4,640 spent on fees and slippage. |
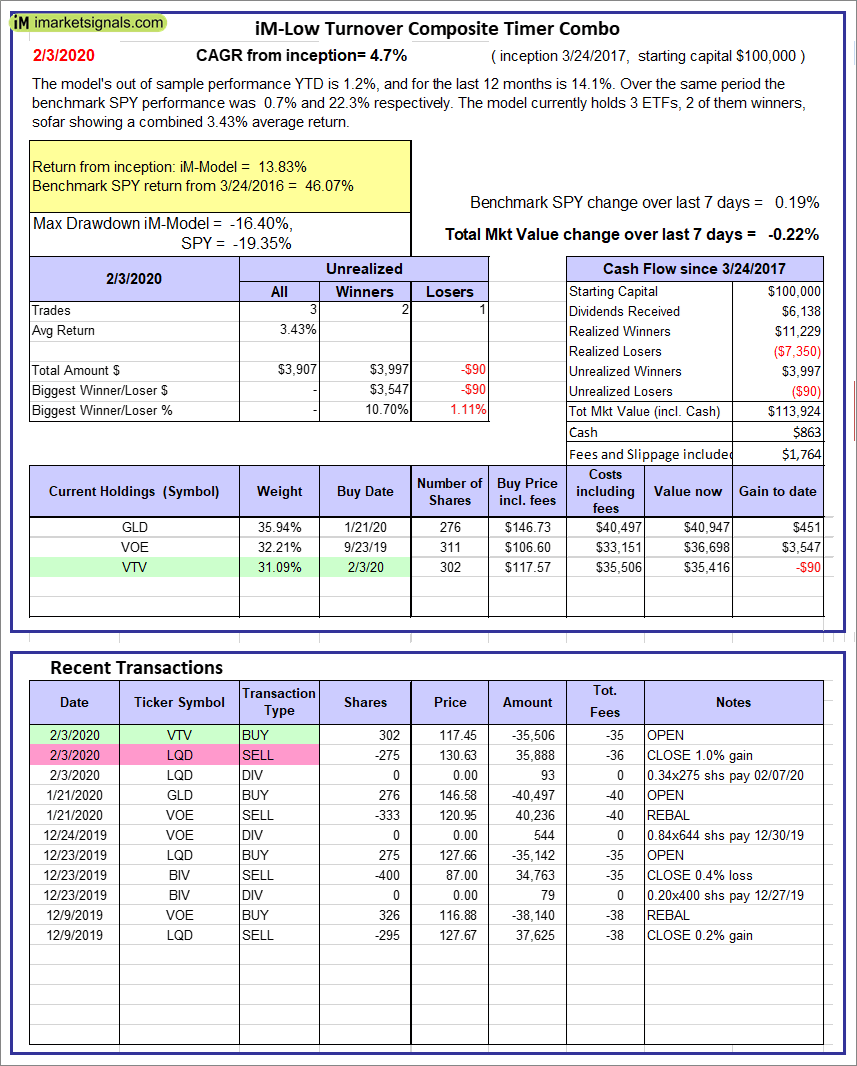 |
iM-Low Turnover Composite Timer Combo: The model’s out of sample performance YTD is 1.2%, and for the last 12 months is 14.1%. Over the same period the benchmark SPY performance was 0.7% and 22.3% respectively. Over the previous week the market value of the iM-Low Turnover Composite Timer Combo gained -0.22% at a time when SPY gained 0.19%. A starting capital of $100,000 at inception on 3/24/27 would have grown to $113,924 which includes $863 cash and excludes $1,764 spent on fees and slippage. |
 |
iM-5ETF Trader (includes leveraged ETFs): The model’s out of sample performance YTD is 1.5%, and for the last 12 months is 12.8%. Over the same period the benchmark SPY performance was 0.7% and 22.3% respectively. Over the previous week the market value of the iM-5ETF Trader (includes leveraged ETFs) gained -0.08% at a time when SPY gained 0.19%. A starting capital of $100,000 at inception on 10/30/2016 would have grown to $159,708 which includes $1,489 cash and excludes $3,569 spent on fees and slippage. |
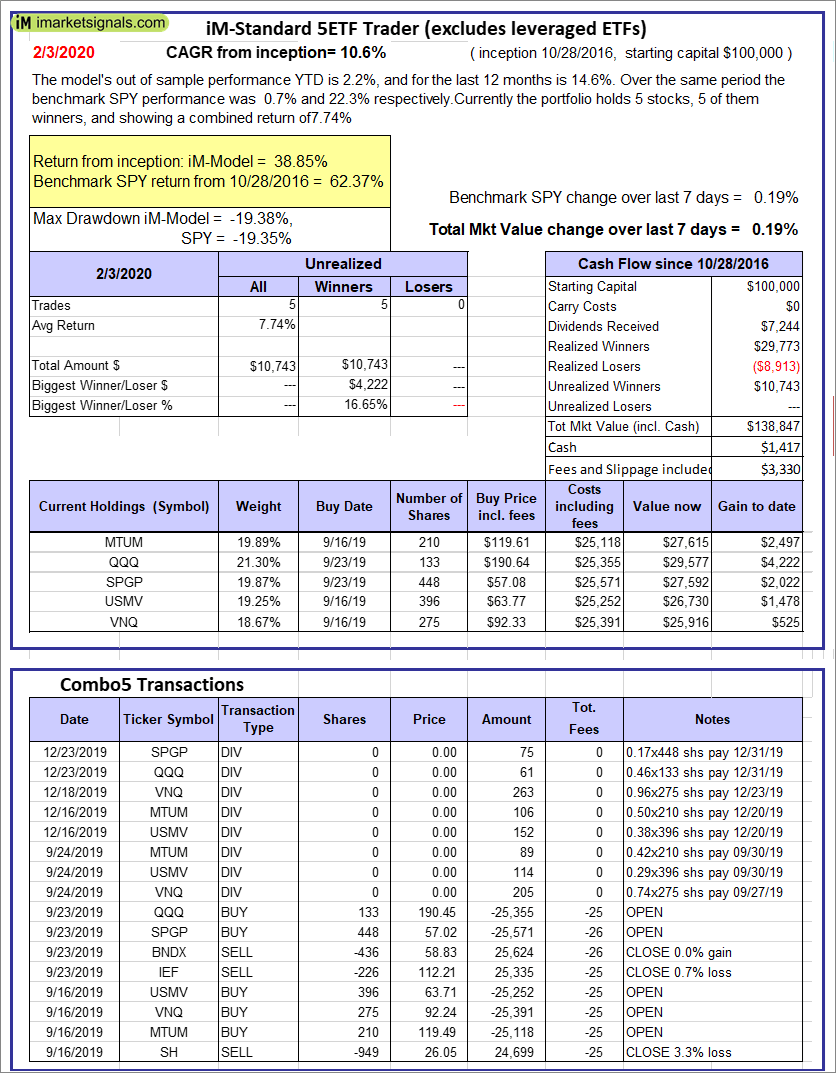 |
iM-Standard 5ETF Trader (excludes leveraged ETFs): The model’s out of sample performance YTD is 2.2%, and for the last 12 months is 14.6%. Over the same period the benchmark SPY performance was 0.7% and 22.3% respectively. Over the previous week the market value of the iM-Standard 5ETF Trader (excludes leveraged ETFs) gained 0.19% at a time when SPY gained 0.19%. A starting capital of $100,000 at inception on 10/30/2016 would have grown to $138,847 which includes $1,417 cash and excludes $3,330 spent on fees and slippage. |
iM-Best Reports – 2/3/2020
Posted in pmp SPY-SH
Leave a Reply
You must be logged in to post a comment.