
Note: This article was first published on Advisers Perspectives
In a previous article, I discussed the seasonal effect in equities and showed that they perform best from November to April, the “good” period, and that replacing equities with fixed income during the “bad” period of May thru October is a winning strategy over the longer term.
Since future returns from fixed income are uncertain, the strategy proposed here is to always invest in sector equity ETFs. I defined two super-sector groups, classified as aggressive and defensive, each with four sector ETFs which have historically performed best from November to April and relatively well from May to October, respectively.
This simple strategy invests alternately in the aggressive and defensive super sectors during their respective six-month periods, switching from aggressive to defensive at the end of April, and vice versa at the end of October.
This trading strategy carries less risk than investing in the S&P 500 ETF (SPY) over the longer term. From 1999 to 2020 it would have produced a positive alpha of 5.4%, indicating that this strategy would have outperformed its risk-adjusted benchmark (SPY) return on average by 5.4% per year.
The super sectors
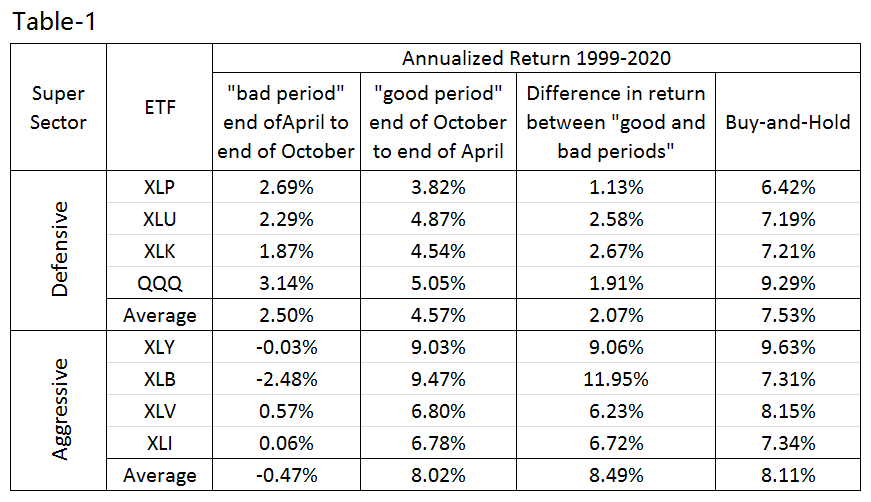
The eight sector ETFs were classified into two super sectors in accordance with their performance over the 6-month “good” and “bad” periods as shown in table 1 below.
The aggressive super sector has four constituent sectors:
- Materials, represented by the materials select sector SPDR fund (XLB).
- Consumer cyclical, represented by the consumer discretionary select sector SPDR fund (XLY).
- Healthcare, represented by the healthcare select sector SPDR fund (XLV).
- Industrials, represented by the industrial select sector SPDR fund (XLI)
The defensive super sector also has four constituent sectors:
- Consumer defensive, represented by the consumer staples select sector SPDR fund (XLP).
- Utilities, represented by the utilities select sector SPDR fund (XLU).
- Technology, represented by the technology select sector SPDR fund (XLK).
- Innovation, represented by Invesco QQQ Trust (QQQ).
Historic performance of the super-sector ETFs
Table 1 below shows the performance from 1/2/1999 to 10/27/2020 of the eight sector ETFs, assuming investments during the “good” or “bad” six-month periods only. One can observe the following:
- For all ETFs the “bad” period returns are lower than the “good” period returns;
- the defensive super-sector ETFs show positive returns for all investment periods and a low difference in return between the “good” and “bad” periods;
- the aggressive super-sector ETFs show a negative average return for the “bad” investment periods, but a relatively high return for the “good” investment periods, resulting in a high difference in returns between the “good” and “bad” periods; and
- there is not a significant difference between the buy-and-hold returns, being 7.5% and 8.1% for the defensive- and aggressive-super sectors, respectively.
Performance from 1999 to 2020
The analysis was performed using the on-line portfolio simulation platform Portfolio 123, which provides historic financial data for stocks, bonds and ETFs. Positions are equal weighted and rebalanced every 13 weeks, with a maximum position drift of 5% from ideal weight allowed before rebalancing is required. Trading costs were ignored in the simulation.
Figure 1 shows the simulated performance from 1/2/1999 to 10/27/2020. The annualized return would have been 12.0% (versus 6.7% for SPY) with a maximum drawdown of -47% (-55% for SPY).
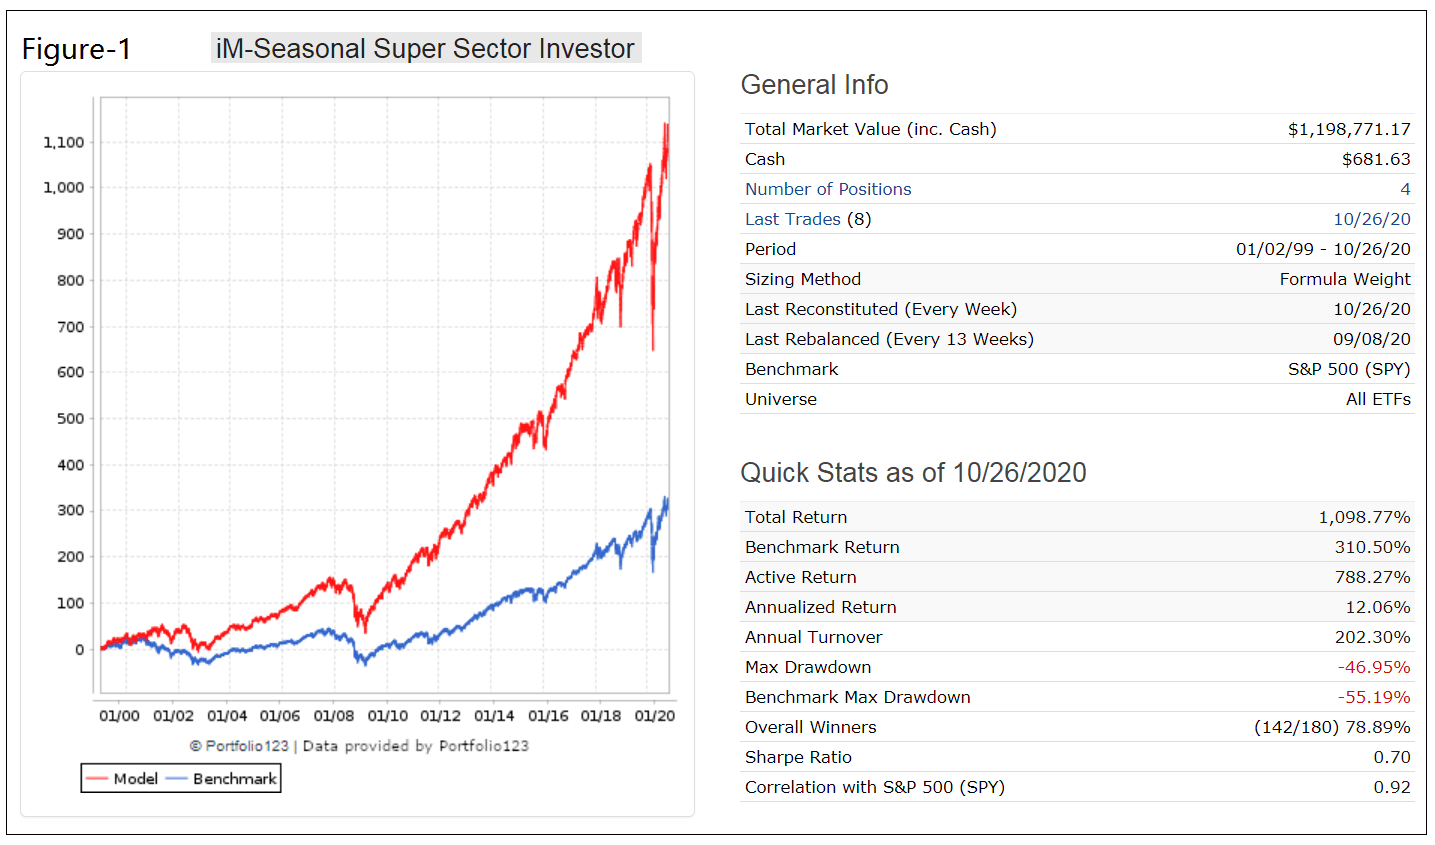
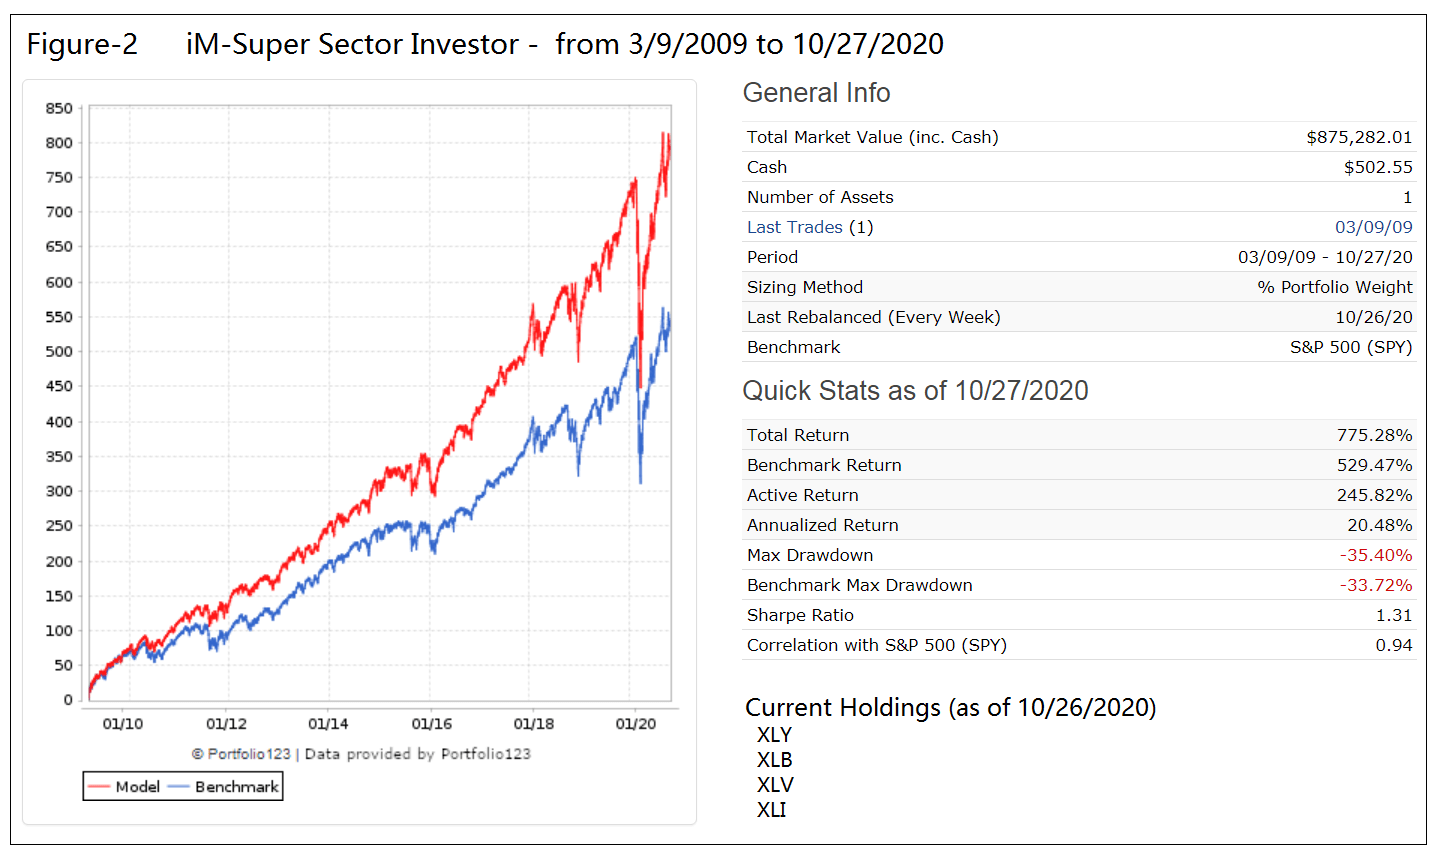
Figure 2 is the model’s performance for the up-market period starting 3/9/2009 when the S&P 500 index was at its lowest during the financial crisis recession. The annualized return over this period would have been 20.5% (17.1% for SPY) with a maximum drawdown of -35% (-34% for SPY).
The risk measurements for this period show a positive alpha of 4.1% indicating that this strategy would have outperformed its risk-adjusted benchmark return on average by 4.1% per year.
Investment risk
In table 2 below are the risk statistics from 1999 to 2020 for the model relative to the benchmark S&P 500 (SPY). It is evident from the risk measures that the trading strategy carries less risk than investing in SPY over the longer term. The positive alpha of 5.4% indicates that this strategy would have outperformed its risk-adjusted benchmark return on average by 5.4% per year.
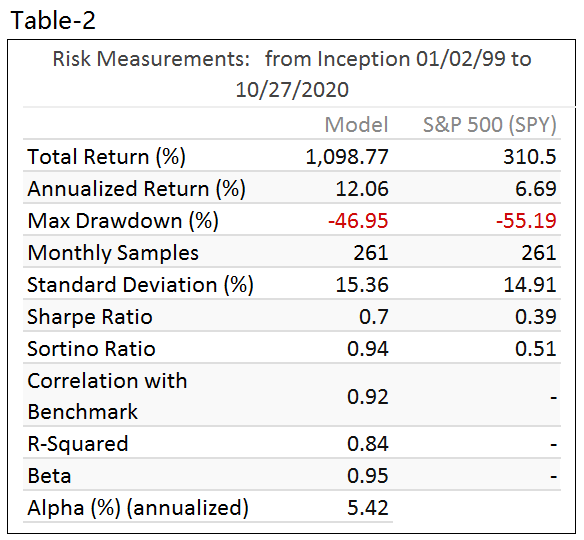
Portfolio123 uses the industry standard (calendar monthly returns) for these statistics.
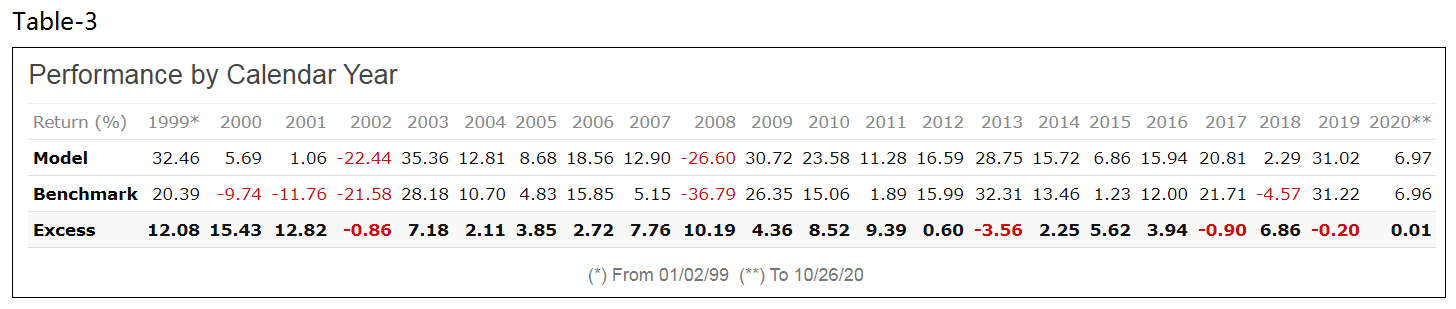
Calendar-year performance
Table 3 shows the calendar-year performance since 1999 for the strategy and the benchmark ETF (SPY). The strategy would have produced excess returns in 19 of the 23 years, and small deficiencies in the other four years.
Conclusion
Nobody knows which sector ETF will perform best over any period. However, the seasonality of the stock market has been observed for many years. It should be advantageous to follow this seasonal super-sector investment strategy, which does not rely on the performance of a single ETF, but uses two groups of four ETFs.
Such a strategy would have produced good returns, much better than a buy-and-hold investment in the stock index fund SPY or in any of the component ETFs used.
Hardly any trading is needed; aggressive and defensive super sectors positions are held for six months. However, occasional rebalancing to equal weight is required.
The analysis is based on sector ETFs – seven SPDR select sector ETFs and the innovation sector ETF (QQQ) – and not on ETFs with maximum returns. This analysis is therefore not tainted by survivorship bias. The excess return over SPY is created by the seasonal switching strategy and the grouping of the sector ETFs into defensive and aggressive super sectors.
Disclaimer:
All results shown are hypothetical and the result of backtesting over the period 2000 to 2020. No claim is made about future performance.
Really good article. Would be interesting to see the results from putting the four applicable funds during each six months into your Sector-SH ranking algorithm and incorporate switching among the “best” of the four during the applicable period.
Tom C
Another thing I noticed is that compared to your other seasonal switching strategy, this one considers XLK and QQQ to be “defensive” and XLV to be “aggressive”, which is somewhat of a switch. Does that have to do with the nature of the mean reversion ranking system in your other model?
Tom C